Percentage Charts
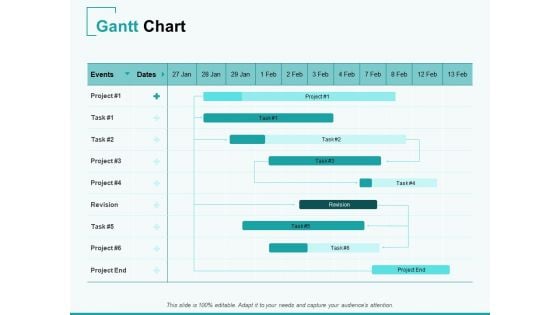
Home Remodeling Proposal Gantt Chart Ppt PowerPoint Presentation Slides Example Topics PDF
Our Gantt Chart PowerPoint Template is a modern and professional layout designed to create some of the vital components that help you to create timelines, roadmaps, project plans, etc. Communicate your project activity durations, milestones, tasks, subtasks, dependencies and other attributes with this content-ready PowerPoint template. Further, showcase precedence against time by employing this fully editable PowerPoint chart into your business tasks. With a single glance at this resourceful PPT layout, the audiences can get a complete overview of the tasks, duration, resources employed, and overlapping of the activities in a particular project, making it an ideal choice for project managers and leaders. Not only this, but the color scheme of this template is also such that it is sure to impress your audience, no matter which niche they

Annual Work Schedule Plan Gantt Chart For Project Manager Rules PDF
This slide covers project managers tasks list for four years. It starts from contacting client for requirements, preparation of project plan, allocate financial budget, project team creation , train line staff, etc.Showcasing this set of slides titled Annual Work Schedule Plan Gantt Chart For Project Manager Rules PDF. The topics addressed in these templates are Project Requirements, Preparation Project, Creation Project. All the content presented in this PPT design is completely editable. Download it and make adjustments in color, background, font etc. as per your unique business setting.
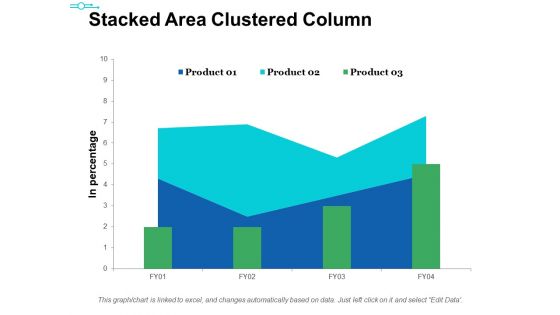
Stacked Area Clustered Column Ppt PowerPoint Presentation Ideas Themes
This is a stacked area clustered column ppt powerpoint presentation ideas themes. This is a three stage process. The stages in this process are product, in percentage, bar graph, area chart, growth.
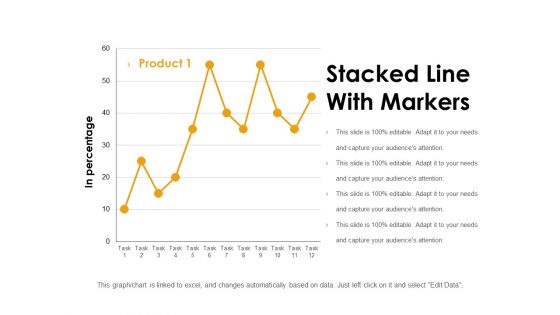
Stacked Line With Markers Ppt PowerPoint Presentation Inspiration Graphics Pictures
This is a stacked line with markers ppt powerpoint presentation inspiration graphics pictures. This is a one stage process. The stages in this process are in percentage, growth, business, marketing, chart.
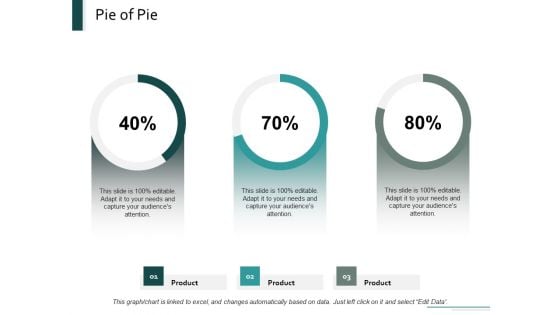
Pie Of Pie Marketing Ppt Powerpoint Presentation Inspiration Designs
This is a pie of pie marketing ppt powerpoint presentation inspiration designs. This is a three stage process. The stages in this process are finance, pie chart, product, marketing, percentage.

Key Prioritization Techniques For Project Team Management Gantt Chart For Tasks Assigned To Employees Ppt Professional Model PDF
Presenting this set of slides with name key prioritization techniques for project team management gantt chart for tasks assigned to employees ppt professional model pdf. The topics discussed in these slides are gantt chart, tasks assigned, employees, marketing. This is a completely editable PowerPoint presentation and is available for immediate download. Download now and impress your audience.
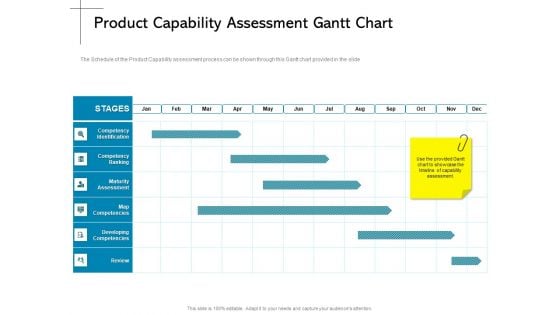
New Product Introduction In The Market Product Capability Assessment Gantt Chart Ppt PowerPoint Presentation Slides Graphics Tutorials PDF
Our Gantt Chart PowerPoint Template is a modern and professional layout designed to create some of the vital components that help you to create timelines, roadmaps, project plans, etc. Communicate your project activity durations, milestones, tasks, subtasks, dependencies and other attributes with this content-ready PowerPoint template. Further, showcase precedence against time by employing this fully editable PowerPoint chart into your business tasks. With a single glance at this resourceful PPT layout, the audiences can get a complete overview of the tasks, duration, resources employed, and overlapping of the activities in a particular project, making it an ideal choice for project managers and leaders. Not only this, but the color scheme of this template is also such that it is sure to impress your audience, no matter which niche they belong to. Thus steer your project meetings, meetups, and conferences with this Gantt Chart PPT slide.
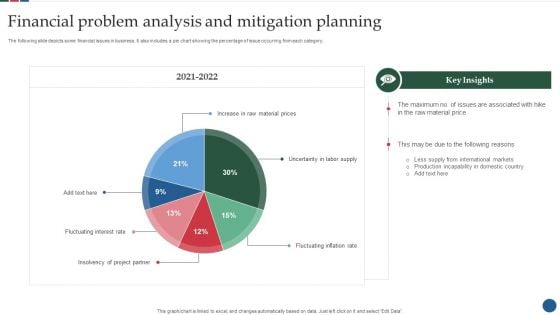
Financial Problem Analysis And Mitigation Planning Portrait PDF
The following slide depicts some financial issues in business. It also includes a pie chart showing the percentage of issue occurring from each category. Showcasing this set of slides titled Financial Problem Analysis And Mitigation Planning Portrait PDF. The topics addressed in these templates are Raw Material Price, International Markets, Production Incapability. All the content presented in this PPT design is completely editable. Download it and make adjustments in color, background, font etc. as per your unique business setting.
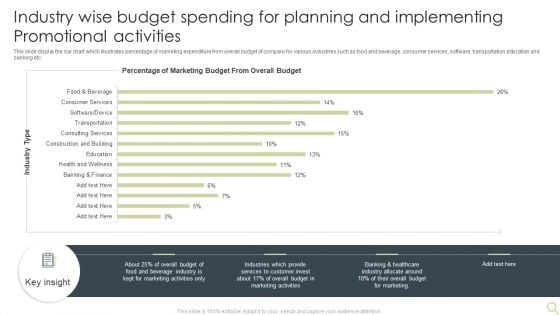
Industry Wise Budget Spending For Planning And Implementing Promotional Activities Introduction PDF
This slide display the bar chart which illustrates percentage of marketing expenditure from overall budget of company for various industries such as food and beverage, consumer services, software, transportation,education and banking etc. Showcasing this set of slides titled Industry Wise Budget Spending For Planning And Implementing Promotional Activities Introduction PDF. The topics addressed in these templates are Marketing, Beverage Industry, Budget. All the content presented in this PPT design is completely editable. Download it and make adjustments in color, background, font etc. as per your unique business setting.
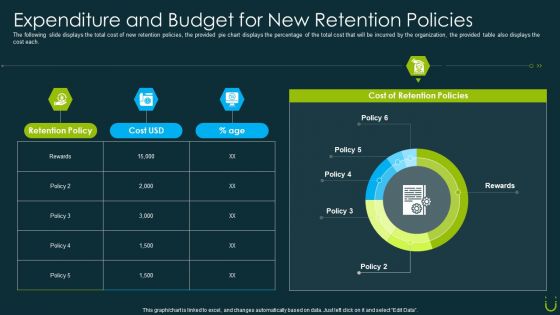
Staff Retention Plan Expenditure And Budget For New Retention Policies Ppt Ideas Graphics PDF
The following slide displays the total cost of new retention policies, the provided pie chart displays the percentage of the total cost that will be incurred by the organization, the provided table also displays the cost each. Deliver an awe inspiring pitch with this creative staff retention plan expenditure and budget for new retention policies ppt ideas graphics pdf bundle. Topics like expenditure and budget for new retention policies can be discussed with this completely editable template. It is available for immediate download depending on the needs and requirements of the user.

Modal Transportation Share In United States Brochure PDF
The slide shows the pie chart presentation of percentage share of all modes of transportations Trains, Passenger cars, Other motor, buses etc., that travelers used to commute. Additionally, it provides key details related to companys strategic plan to attract new customers.Deliver and pitch your topic in the best possible manner with this modal transportation share in united states brochure pdf. Use them to share invaluable insights on transportation share 2021 and impress your audience. This template can be altered and modified as per your expectations. So, grab it now.
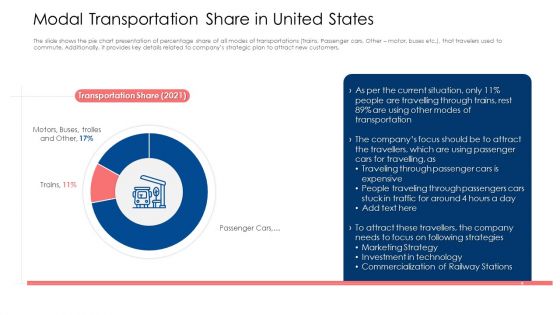
Modal Transportation Share In United States Ppt Inspiration Master Slide PDF
The slide shows the pie chart presentation of percentage share of all modes of transportations Trains, Passenger cars, Other motor, buses etc., that travelers used to commute. Additionally, it provides key details related to companys strategic plan to attract new customers. Deliver and pitch your topic in the best possible manner with this modal transportation share in united states ppt inspiration master slide pdf. Use them to share invaluable insights on marketing strategy, investment in technology, strategies and impress your audience. This template can be altered and modified as per your expectations. So, grab it now.
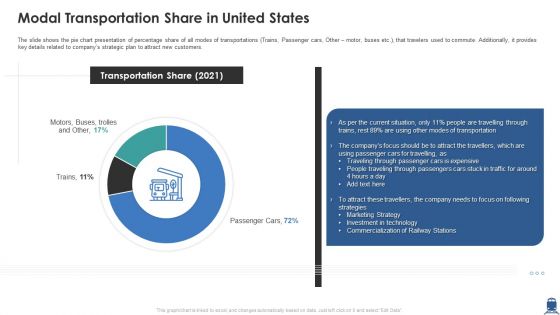
Modal Transportation Share In United States Sample PDF
The slide shows the pie chart presentation of percentage share of all modes of transportations Trains, Passenger cars, Other motor, buses etc. that travelers used to commute. Additionally, it provides key details related to companys strategic plan to attract new customers. Deliver and pitch your topic in the best possible manner with this modal transportation share in united states sample pdf. Use them to share invaluable insights on marketing strategy, investment technology, commercialization and impress your audience. This template can be altered and modified as per your expectations. So, grab it now.
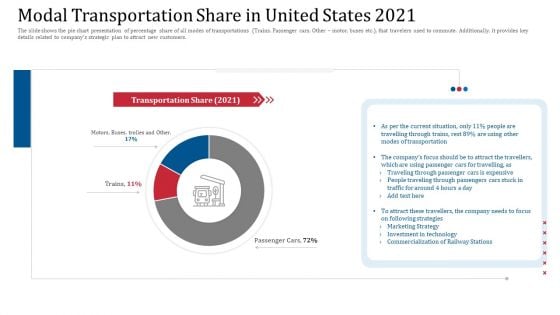
Modal Transportation Share In United States 2021 Introduction PDF
The slide shows the pie chart presentation of percentage share of all modes of transportations Trains, Passenger cars, Other motor, buses etc, that travelers used to commute. Additionally, it provides key details related to companys strategic plan to attract new customers.Deliver an awe inspiring pitch with this creative modal transportation share in united states 2021 introduction pdf bundle. Topics like modes of transportation, commercialization of railway, marketing strategy can be discussed with this completely editable template. It is available for immediate download depending on the needs and requirements of the user.
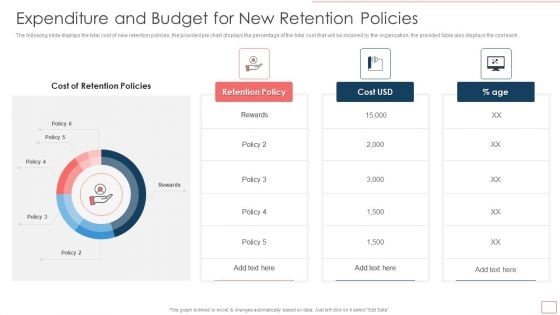
Strategic Human Resource Retention Management Expenditure And Budget Inspiration PDF
The following slide displays the total cost of new retention policies, the provided pie chart displays the percentage of the total cost that will be incurred by the organization, the provided table also displays the cost each. Deliver an awe inspiring pitch with this creative Strategic Human Resource Retention Management Expenditure And Budget Inspiration PDF bundle. Topics like Retention Policies, Rewards, Cost Of Retention can be discussed with this completely editable template. It is available for immediate download depending on the needs and requirements of the user.
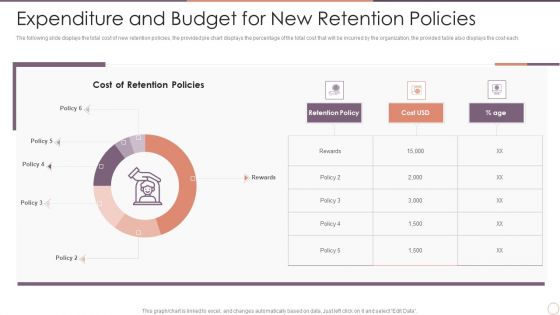
Managing Employee Turnover Expenditure And Budget For New Retention Policies Topics PDF
The following slide displays the total cost of new retention policies, the provided pie chart displays the percentage of the total cost that will be incurred by the organization, the provided table also displays the cost each. Deliver and pitch your topic in the best possible manner with this Managing Employee Turnover Expenditure And Budget For New Retention Policies Topics PDF. Use them to share invaluable insights on Expenditure And Budget, New Retention Policies and impress your audience. This template can be altered and modified as per your expectations. So, grab it now.
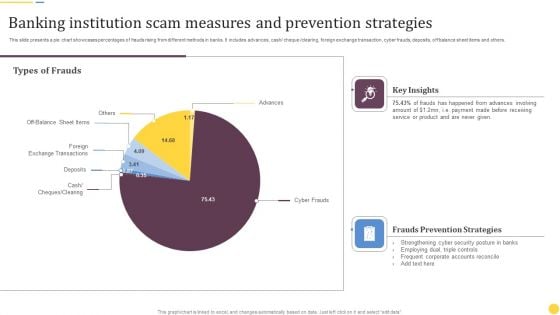
Banking Institution Scam Measures And Prevention Strategies Information PDF
This slide presents a pie chart showcases percentages of frauds rising from different methods in banks. It includes advances, cash or cheque or clearing, foreign exchange transaction, cyber frauds, deposits, off balance sheet items and others. Showcasing this set of slides titled Banking Institution Scam Measures And Prevention Strategies Information PDF. The topics addressed in these templates are Key Insights, Frauds Prevention Strategies, Types Of Frauds. All the content presented in this PPT design is completely editable. Download it and make adjustments in color, background, font etc. as per your unique business setting.
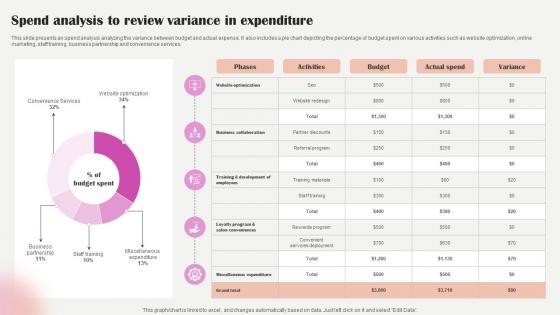
Salon Marketing Plan To Optimize Spend Analysis To Review Variance In Expenditure Strategy SS V
This slide presents an spend analysis analyzing the variance between budget and actual expense. It also includes a pie chart depicting the percentage of budget spent on various activities such as website optimization, online marketing, staff training, business partnership and convenience services. Explore a selection of the finest Salon Marketing Plan To Optimize Spend Analysis To Review Variance In Expenditure Strategy SS V here. With a plethora of professionally designed and pre-made slide templates, you can quickly and easily find the right one for your upcoming presentation. You can use our Salon Marketing Plan To Optimize Spend Analysis To Review Variance In Expenditure Strategy SS V to effectively convey your message to a wider audience. Slidegeeks has done a lot of research before preparing these presentation templates. The content can be personalized and the slides are highly editable. Grab templates today from Slidegeeks. This slide presents an spend analysis analyzing the variance between budget and actual expense. It also includes a pie chart depicting the percentage of budget spent on various activities such as website optimization, online marketing, staff training, business partnership and convenience services.
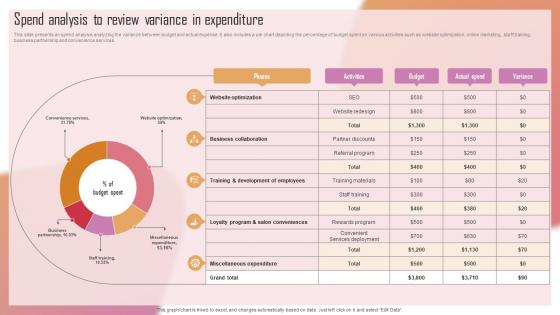
Customizing The Salon Experience Spend Analysis To Review Variance In Expenditure Strategy SS V
This slide presents an spend analysis analyzing the variance between budget and actual expense. It also includes a pie chart depicting the percentage of budget spent on various activities such as website optimization, online marketing, staff training, business partnership and convenience services. Do you know about Slidesgeeks Customizing The Salon Experience Spend Analysis To Review Variance In Expenditure Strategy SS V These are perfect for delivering any kind od presentation. Using it, create PowerPoint presentations that communicate your ideas and engage audiences. Save time and effort by using our pre-designed presentation templates that are perfect for a wide range of topic. Our vast selection of designs covers a range of styles, from creative to business, and are all highly customizable and easy to edit. Download as a PowerPoint template or use them as Google Slides themes. This slide presents an spend analysis analyzing the variance between budget and actual expense. It also includes a pie chart depicting the percentage of budget spent on various activities such as website optimization, online marketing, staff training, business partnership and convenience services.
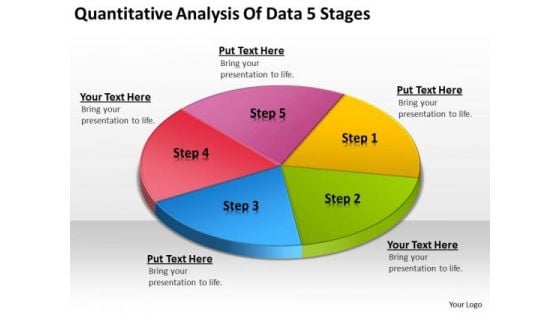
Quantitative Analysis Of Data 5 Stages Business Plan For Bar PowerPoint Slides
We present our quantitative analysis of data 5 stages business plan for bar PowerPoint Slides.Use our Circle Charts PowerPoint Templates because Our PowerPoint Templates and Slides will give good value for money. They also have respect for the value of your time. Download our Business PowerPoint Templates because Our PowerPoint Templates and Slides will let you Leave a lasting impression to your audiences. They possess an inherent longstanding recall factor. Use our Shapes PowerPoint Templates because You can safely bank on our PowerPoint Templates and Slides. They will provide a growth factor to your valuable thoughts. Use our Signs PowerPoint Templates because You have gained great respect for your brilliant ideas. Use our PowerPoint Templates and Slides to strengthen and enhance your reputation. Download and present our Metaphors-Visual Concepts PowerPoint Templates because Our PowerPoint Templates and Slides are Clear and concise. Use them and dispel any doubts your team may have.Use these PowerPoint slides for presentations relating to business, chart, circle, circular, diagram, economy, finance, framework, graph, isolated, percentage, pie chart, results, scheme, statistics, stats, strategy, success. The prominent colors used in the PowerPoint template are Purple, Yellow, Green. Examine all factors in detail. Give each one close attention with our Quantitative Analysis Of Data 5 Stages Business Plan For Bar PowerPoint Slides.
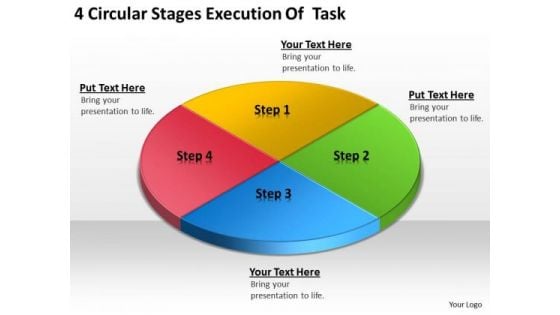
4 Circular Stages Execution Of Task Small Business Plan PowerPoint Templates
We present our 4 circular stages execution of task small business plan PowerPoint templates.Present our Circle Charts PowerPoint Templates because Our PowerPoint Templates and Slides will Activate the energies of your audience. Get their creative juices flowing with your words. Download and present our Business PowerPoint Templates because Our PowerPoint Templates and Slides are created with admirable insight. Use them and give your group a sense of your logical mind. Present our Shapes PowerPoint Templates because Our PowerPoint Templates and Slides will let you meet your Deadlines. Present our Signs PowerPoint Templates because Our PowerPoint Templates and Slides will let your words and thoughts hit bullseye everytime. Download our Metaphors-Visual Concepts PowerPoint Templates because You should Bet on your luck with our PowerPoint Templates and Slides. Be assured that you will hit the jackpot.Use these PowerPoint slides for presentations relating to business, chart, circle, circular, diagram, economy, finance, framework, graph, isolated, percentage, pie chart, results, scheme, statistics, stats, strategy, success. The prominent colors used in the PowerPoint template are Red, Yellow, Green. Excellence is a byword for our 4 Circular Stages Execution Of Task Small Business Plan PowerPoint Templates. They aim for the best without exception.
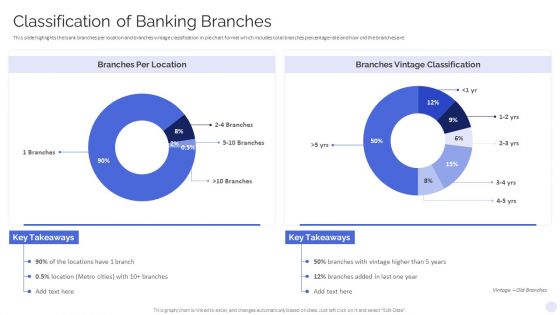
Banking Operations Model Revamp Plan Classification Of Banking Branches Demonstration PDF
This slide highlights the bank branches per location and branches vintage classification in pie chart format which includes total branches percentage rate and how old the branches are. Deliver and pitch your topic in the best possible manner with this Banking Operations Model Revamp Plan Classification Of Banking Branches Demonstration PDF. Use them to share invaluable insights on Branches Per Location, Branches Vintage Classification and impress your audience. This template can be altered and modified as per your expectations. So, grab it now.
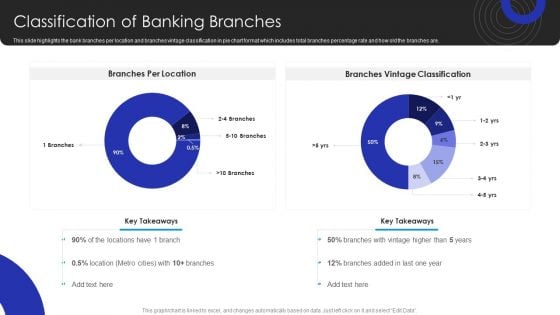
Operational Innovation In Banking Classification Of Banking Branches Rules PDF
This slide highlights the bank branches per location and branches vintage classification in pie chart format which includes total branches percentage rate and how old the branches are. There are so many reasons you need a Operational Innovation In Banking Classification Of Banking Branches Rules PDF. The first reason is you cant spend time making everything from scratch, Thus, Slidegeeks has made presentation templates for you too. You can easily download these templates from our website easily.
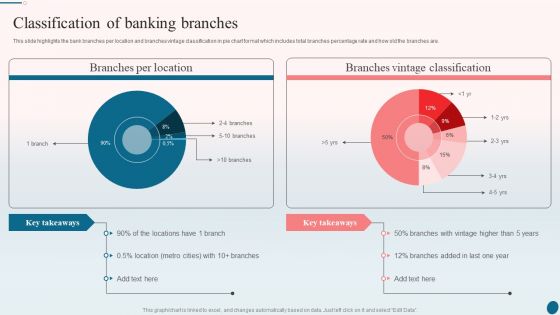
Banking Operations Management Classification Of Banking Branches Information PDF
This slide highlights the bank branches per location and branches vintage classification in pie chart format which includes total branches percentage rate and how old the branches are. Deliver and pitch your topic in the best possible manner with this Banking Operations Management Classification Of Banking Branches Information PDF. Use them to share invaluable insights on Branches Per Location, Classification Of Banking Branches and impress your audience. This template can be altered and modified as per your expectations. So, grab it now.
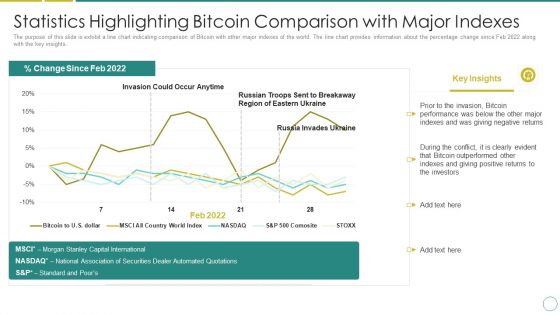
Russia Ukraine Statistics Highlighting Bitcoin Comparison With Major Indexes Mockup PDF
The purpose of this slide is exhibit a line chart indicating comparison of Bitcoin with other major indexes of the world. The line chart provides information about the percentage change since Feb 2022 along with the key insights. Deliver an awe inspiring pitch with this creative russia ukraine statistics highlighting bitcoin comparison with major indexes mockup pdf bundle. Topics like invasion could occur anytime, russia invades ukraine, bitcoin performance can be discussed with this completely editable template. It is available for immediate download depending on the needs and requirements of the user.
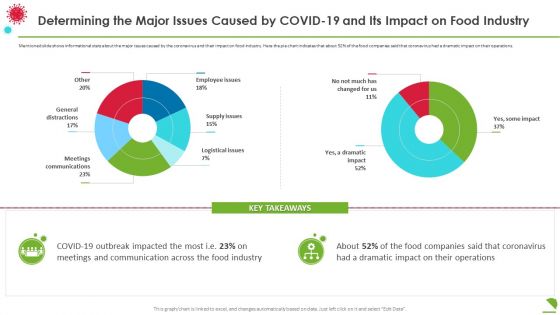
Determining The Major Issues Caused By Covid19 And Its Impact On Food Industry Demonstration PDF
Mentioned slide shows informational stats about the major issues caused by the coronavirus and their impact on food industry. Here the pie chart indicates that about 52 percentage of the food companies said that coronavirus had a dramatic impact on their operations. Deliver and pitch your topic in the best possible manner with this determining the major issues caused by covid19 and its impact on food industry demonstration pdf. Use them to share invaluable insights on communication, industry, dramatic and impress your audience. This template can be altered and modified as per your expectations. So, grab it now.
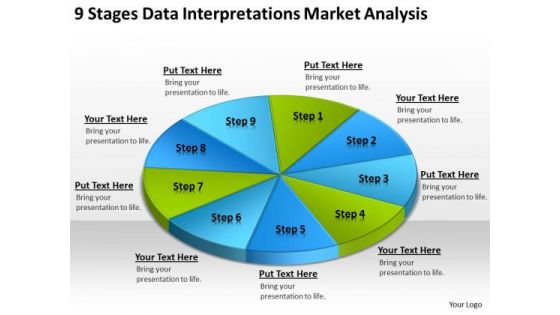
Data Interpretations Market Analysis Templates For Business Plan PowerPoint
We present our data interpretations market analysis templates for business plan PowerPoint.Present our Circle Charts PowerPoint Templates because Our PowerPoint Templates and Slides come in all colours, shades and hues. They help highlight every nuance of your views. Use our Business PowerPoint Templates because Our PowerPoint Templates and Slides will let you Hit the right notes. Watch your audience start singing to your tune. Download our Shapes PowerPoint Templates because Our PowerPoint Templates and Slides will fulfill your every need. Use them and effectively satisfy the desires of your audience. Present our Signs PowerPoint Templates because Our PowerPoint Templates and Slides will provide you a launch platform. Give a lift off to your ideas and send them into orbit. Use our Metaphors-Visual Concepts PowerPoint Templates because You have a driving passion to excel in your field. Our PowerPoint Templates and Slides will prove ideal vehicles for your ideas.Use these PowerPoint slides for presentations relating to business, chart, circle, circular, diagram, economy, finance, framework, graph, isolated, percentage, pie chart, results, scheme, statistics, stats, strategy, success. The prominent colors used in the PowerPoint template are Blue, Green, Blue light. Affiliate our Data Interpretations Market Analysis Templates For Business Plan PowerPoint to your thoughts. They will develop an affinity for them.
Strategic Marketing For Hair And Beauty Salon To Increase Spend Analysis To Review Variance Introduction PDF
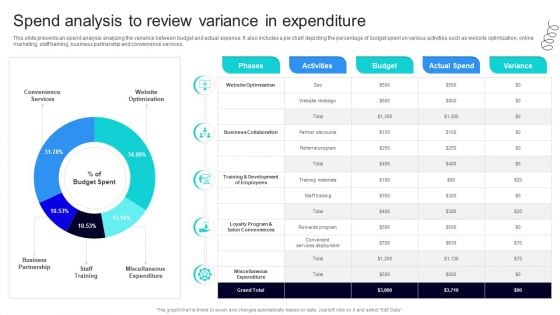
This slide presents an spend analysis analyzing the variance between budget and actual expense. It also includes a pie chart depicting the percentage of budget spent on various activities such as website optimization, online marketing, staff training, business partnership and convenience services. Retrieve professionally designed Strategic Marketing For Hair And Beauty Salon To Increase Spend Analysis To Review Variance Introduction PDF to effectively convey your message and captivate your listeners. Save time by selecting pre made slideshows that are appropriate for various topics, from business to educational purposes. These themes come in many different styles, from creative to corporate, and all of them are easily adjustable and can be edited quickly. Access them as PowerPoint templates or as Google Slides themes. You do not have to go on a hunt for the perfect presentation because Slidegeeks got you covered from everywhere.
Improving Digital Banking Operations And Services Framework Classification Of Banking Branches Brochure PDF
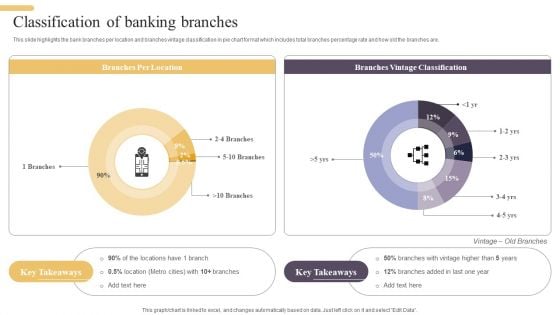
This slide highlights the bank branches per location and branches vintage classification in pie chart format which includes total branches percentage rate and how old the branches are. Take your projects to the next level with our ultimate collection of Improving Digital Banking Operations And Services Framework Classification Of Banking Branches Brochure PDF. Slidegeeks has designed a range of layouts that are perfect for representing task or activity duration, keeping track of all your deadlines at a glance. Tailor these designs to your exact needs and give them a truly corporate look with your own brand colors they will make your projects stand out from the rest.
Dashboard To Monitor Medical Sales Framework Implementation Progress Formats Pdf
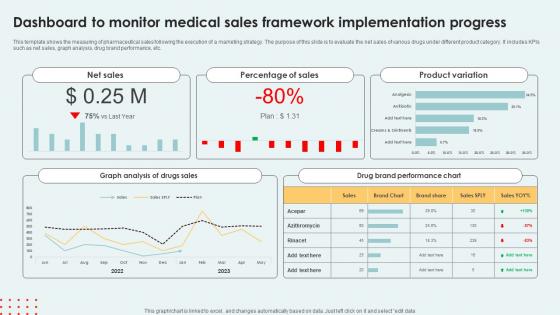
This template shows the measuring of pharmaceutical sales following the execution of a marketing strategy. The purpose of this slide is to evaluate the net sales of various drugs under different product category. It includes KPIs such as net sales, graph analysis, drug brand performance, etc. Showcasing this set of slides titled Dashboard To Monitor Medical Sales Framework Implementation Progress Formats Pdf The topics addressed in these templates are Percentage Sales, Product Variation, Brand Performance Chart All the content presented in this PPT design is completely editable. Download it and make adjustments in color, background, font etc. as per your unique business setting. This template shows the measuring of pharmaceutical sales following the execution of a marketing strategy. The purpose of this slide is to evaluate the net sales of various drugs under different product category. It includes KPIs such as net sales, graph analysis, drug brand performance, etc.
Implementing Marketing Mix Strategy To Enhance Overall Performance Allocating Marketing Budget To Key Activities Mockup PDF
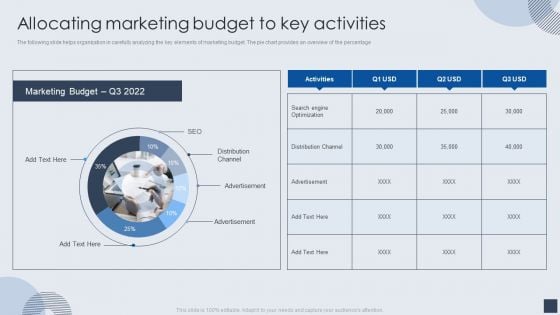
The following slide helps organization in carefully analyzing the key elements of marketing budget. The pie chart provides an overview of the percentage. Deliver and pitch your topic in the best possible manner with this Implementing Marketing Mix Strategy To Enhance Overall Performance Allocating Marketing Budget To Key Activities Mockup PDF. Use them to share invaluable insights on Marketing Budget, Optimization, Advertisement and impress your audience. This template can be altered and modified as per your expectations. So, grab it now.
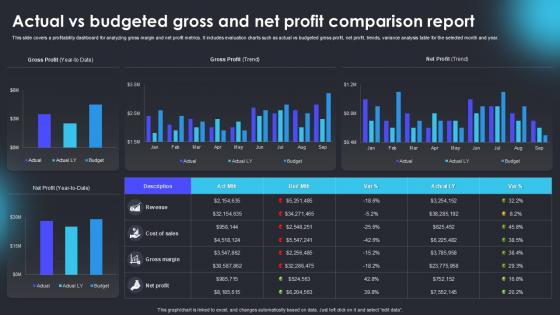
Actual Vs Budgeted Gross And Net Profit Comparison Report
Boost your pitch with our creative Actual Vs Budgeted Gross And Net Profit Comparison Report. Deliver an awe-inspiring pitch that will mesmerize everyone. Using these presentation templates you will surely catch everyones attention. You can browse the ppts collection on our website. We have researchers who are experts at creating the right content for the templates. So you do not have to invest time in any additional work. Just grab the template now and use them. This PowerPoint template is designed to present a detailed comparison between actual financial performance and budgeted projections for gross and net profit. It includes charts, graphs, and tables to effectively illustrate variances, percentage differences, and key financial insights. The template helps in identifying discrepancies, evaluating financial strategies, and guiding corrective measures. Ideal for finance professionals, analysts, and business executives for quarterly, annual, or project-based financial reviews.
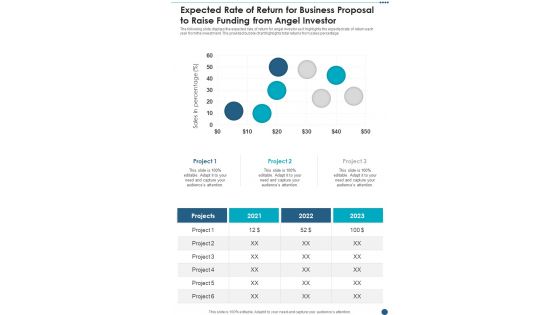
Expected Rate Of Return For Business Proposal To Raise Funding From Angel Investor One Pager Sample Example Document
The following slide displays the expected rate of return for angel investor as it highlights the expected rate of return each year from the investment. The provided bubble chart highlights total returns from sales percentage. Presenting you an exemplary Expected Rate Of Return For Business Proposal To Raise Funding From Angel Investor One Pager Sample Example Document. Our one-pager comprises all the must-have essentials of an inclusive document. You can edit it with ease, as its layout is completely editable. With such freedom, you can tweak its design and other elements to your requirements. Download this Expected Rate Of Return For Business Proposal To Raise Funding From Angel Investor One Pager Sample Example Document brilliant piece now.

Facility Planning Management Workforce Productivity Dashboard Formats PDF
This slide showcase employees productivity driven by facility planning in organisation.it includes workforce productivity , organisation department , monthly productivity percentage and facility percentage. Showcasing this set of slides titled Facility Planning Management Workforce Productivity Dashboard Formats PDF. The topics addressed in these templates are Workforce Productivity, Work Productivity, Facility Percentage. All the content presented in this PPT design is completely editable. Download it and make adjustments in color, background, font etc. as per your unique business setting.
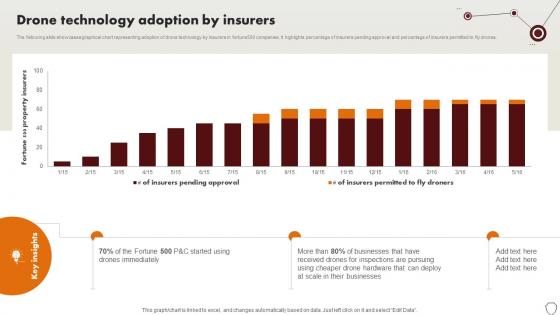
Technology Trends In Online Insurance Drone Technology Adoption By Insurers
The following slide showcases graphical chart representing adoption of drone technology by insurers in fortune500 companies. It highlights percentage of insurers pending approval and percentage of insurers permitted to fly drones. Welcome to our selection of the Technology Trends In Online Insurance Drone Technology Adoption By Insurers. These are designed to help you showcase your creativity and bring your sphere to life. Planning and Innovation are essential for any business that is just starting out. This collection contains the designs that you need for your everyday presentations. All of our PowerPoints are 100Percent editable, so you can customize them to suit your needs. This multi-purpose template can be used in various situations. Grab these presentation templates today. The following slide showcases graphical chart representing adoption of drone technology by insurers in fortune500 companies. It highlights percentage of insurers pending approval and percentage of insurers permitted to fly drones.
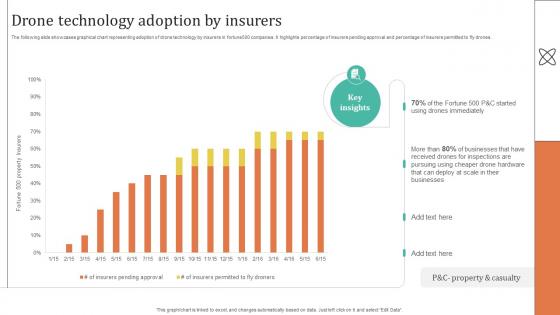
Improving Customer Satisfaction Drone Technology Adoption By Insurers
The following slide showcases graphical chart representing adoption of drone technology by insurers in fortune500 companies. It highlights percentage of insurers pending approval and percentage of insurers permitted to fly drones. Coming up with a presentation necessitates that the majority of the effort goes into the content and the message you intend to convey. The visuals of a PowerPoint presentation can only be effective if it supplements and supports the story that is being told. Keeping this in mind our experts created Improving Customer Satisfaction Drone Technology Adoption By Insurers to reduce the time that goes into designing the presentation. This way, you can concentrate on the message while our designers take care of providing you with the right template for the situation. The following slide showcases graphical chart representing adoption of drone technology by insurers in fortune500 companies. It highlights percentage of insurers pending approval and percentage of insurers permitted to fly drones.

Statistics Highlighting Robotic Process Automation With AI Adoption By Telecom Company Template Pdf
Following slide showcases yearly intelligent automation adoption rate of telecommunication industry for proving 5G services to customers. It includes key elements such as no automation percentage and RPA and AI adoption percentage. Showcasing this set of slides titled Statistics Highlighting Robotic Process Automation With AI Adoption By Telecom Company Template Pdf. The topics addressed in these templates are No Automation, RPA AI Adoption, Key Insights. All the content presented in this PPT design is completely editable. Download it and make adjustments in color, background, font etc. as per your unique business setting. Following slide showcases yearly intelligent automation adoption rate of telecommunication industry for proving 5G services to customers. It includes key elements such as no automation percentage and RPA and AI adoption percentage.
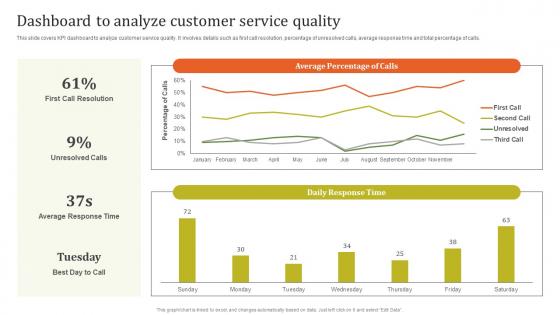
Dashboard To Analyze Customer Executing Effective Quality Enhancement Mockup Pdf
This slide covers KPI dashboard to analyze customer service quality. It involves details such as first call resolution, percentage of unresolved calls, average response time and total percentage of calls. From laying roadmaps to briefing everything in detail, our templates are perfect for you. You can set the stage with your presentation slides. All you have to do is download these easy to edit and customizable templates. Dashboard To Analyze Customer Executing Effective Quality Enhancement Mockup Pdf will help you deliver an outstanding performance that everyone would remember and praise you for. Do download this presentation today. This slide covers KPI dashboard to analyze customer service quality. It involves details such as first call resolution, percentage of unresolved calls, average response time and total percentage of calls.
Leveraging Logistics Automation Dashboard For Tracking Impact Of Procurement Ideas Pdf
This slide covers the dashboard for analysing procurement performance after automation. It include KPIs such as on time delivery, percentage of returns, compliance index percentage, procurement ROI, cost saving, budget spent on training, etc. Slidegeeks is here to make your presentations a breeze with Leveraging Logistics Automation Dashboard For Tracking Impact Of Procurement Ideas Pdf With our easy to use and customizable templates, you can focus on delivering your ideas rather than worrying about formatting. With a variety of designs to choose from, you are sure to find one that suits your needs. And with animations and unique photos, illustrations, and fonts, you can make your presentation pop. So whether you are giving a sales pitch or presenting to the board, make sure to check out Slidegeeks first. This slide covers the dashboard for analysing procurement performance after automation. It include KPIs such as on time delivery, percentage of returns, compliance index percentage, procurement ROI, cost saving, budget spent on training, etc.
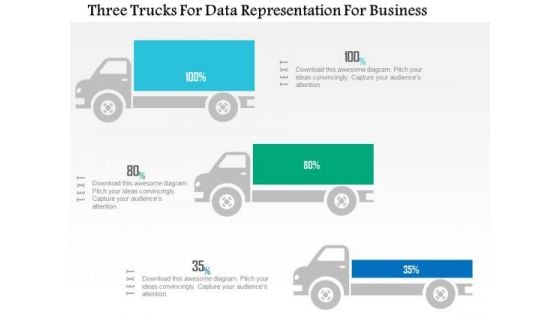
Business Diagram Three Trucks For Data Representation For Business PowerPoint Slide
This business diagram displays three trucks graphic. This diagram contains trucks for percentage value growth. Use this diagram to display business growth over a period of time.
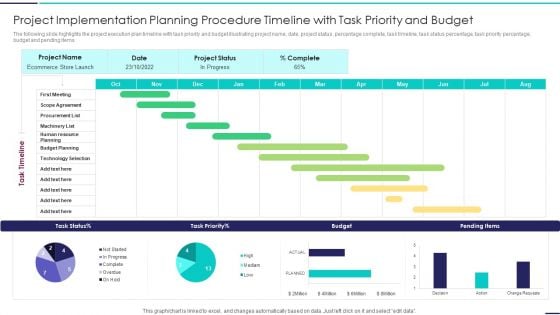
Project Implementation Planning Procedure Timeline With Task Priority And Budget Guidelines PDF
The following slide highlights the project execution plan timeline with task priority and budget illustrating project name, date, project status, percentage complete, task timeline, task status percentage, task priority percentage, budget and pending items. Showcasing this set of slides titled Project Implementation Planning Procedure Timeline With Task Priority And Budget Guidelines PDF. The topics addressed in these templates are Project Implementation Planning Procedure Timeline With Task Priority And Budget. All the content presented in this PPT design is completely editable. Download it and make adjustments in color, background, font etc. as per your unique business setting.
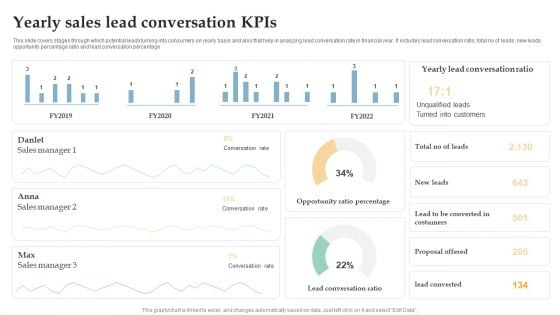
Yearly Sales Lead Conversation Kpis Ppt Inspiration Brochure PDF
This slide covers stages through which potential leads turning into consumers on yearly basis and also that help in analyzing lead conversation rate in financial year. It includes lead conversation ratio, total no of leads, new leads opportunity percentage ratio and lead conversation percentage. Pitch your topic with ease and precision using this Yearly Sales Lead Conversation Kpis Ppt Inspiration Brochure PDF. This layout presents information on Sales Manager, Conversation Rate, Opportunity Ratio Percentage. It is also available for immediate download and adjustment. So, changes can be made in the color, design, graphics or any other component to create a unique layout.
Coronavirus Cases And Deaths Update By Age Group Icons PDF
Following slide provides information regarding distribution of confirmed coronavirus cases and deaths which government uses to take necessary measure in containing virus outspread. Percentage of confirmed cases and deaths are demonstrated in this slide. Showcasing this set of slides titled Coronavirus Cases And Deaths Update By Age Group Icons PDF. The topics addressed in these templates are Highest Percentage, Age Group, Least Percentage. All the content presented in this PPT design is completely editable. Download it and make adjustments in color, background, font etc. as per your unique business setting.
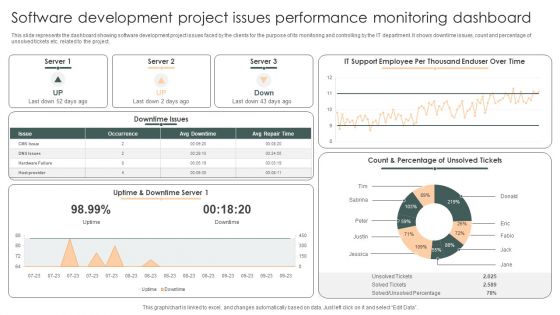
Software Development Project Issues Performance Monitoring Dashboard Structure PDF
This slide represents the dashboard showing software development project issues faced by the clients for the purpose of its monitoring and controlling by the IT department. It shows downtime issues, count and percentage of unsolved tickets etc. related to the project.Showcasing this set of slides titled Software Development Project Issues Performance Monitoring Dashboard Structure PDF. The topics addressed in these templates are Downtime Issues, Count Percentage, Unsolved Percentage. All the content presented in this PPT design is completely editable. Download it and make adjustments in color, background, font etc. as per your unique business setting.
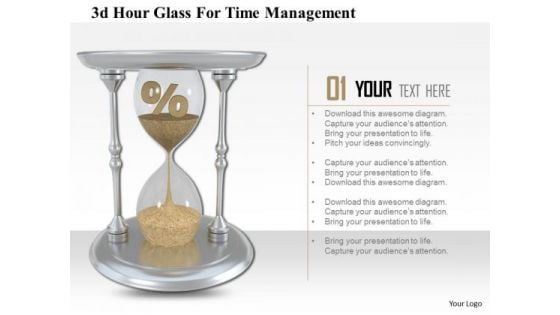
Stock Photo 3d Hour Glass For Time Management Image Graphics For PowerPoint Slide
This image slide displays hourglass with percentage symbol. This image slide may be used to display the time management and profit percentage. Make outstanding presentations using this image.
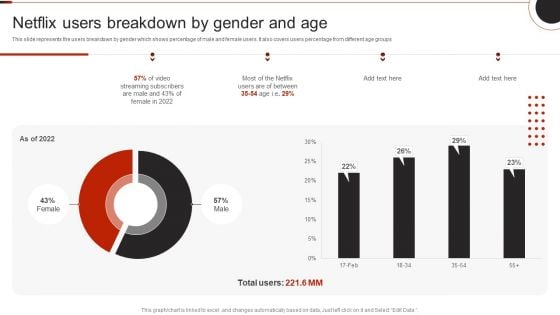
Netflix Company Outline Netflix Users Breakdown By Gender And Age Template PDF
This slide represents the users breakdown by gender which shows percentage of male and female users. It also covers users percentage from different age groups.Deliver an awe inspiring pitch with this creative Netflix Company Outline Netflix Users Breakdown By Gender And Age Template PDF bundle. Topics like Streaming Subscribers, Male Female, Total Users can be discussed with this completely editable template. It is available for immediate download depending on the needs and requirements of the user.
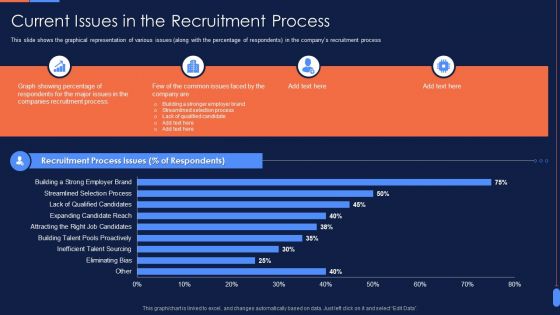
Recruitment Training To Optimize Current Issues In The Recruitment Process Designs PDF
This slide shows the graphical representation of various issues along with the percentage of respondents in the companys recruitment process. Deliver an awe inspiring pitch with this creative Recruitment Training To Optimize Current Issues In The Recruitment Process Designs PDF bundle. Topics like Graph Showing Percentage, Recruitment Process Issues, Eliminating Bias, Inefficient Talent Sourcing can be discussed with this completely editable template. It is available for immediate download depending on the needs and requirements of the user.
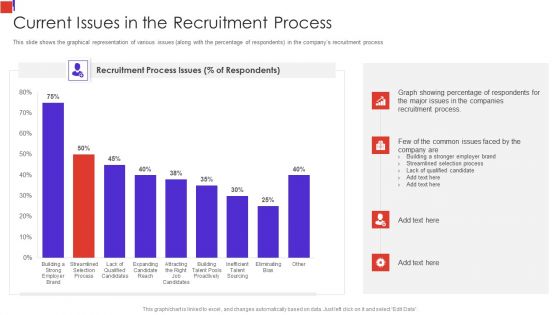
Outline Of Employee Recruitment Current Issues In The Recruitment Process Information PDF
This slide shows the graphical representation of various issues along with the percentage of respondents in the companys recruitment process Deliver an awe inspiring pitch with this creative Outline Of Employee Recruitment Current Issues In The Recruitment Process Information PDF bundle. Topics like Showing Percentage, Issues In The Companies, Recruitment Process can be discussed with this completely editable template. It is available for immediate download depending on the needs and requirements of the user.
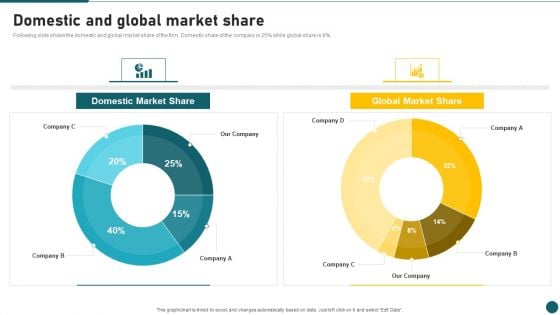
Due Diligence In Amalgamation And Acquisition Domestic And Global Market Share Slides PDF
Following slide shows the domestic and global market share of the firm. Domestic share of the company is 25 percentage while global share is 8 percentage. Deliver an awe inspiring pitch with this creative Due Diligence In Amalgamation And Acquisition Domestic And Global Market Share Slides PDF bundle. Topics like Domestic Market Share, Global Market Share can be discussed with this completely editable template. It is available for immediate download depending on the needs and requirements of the user.
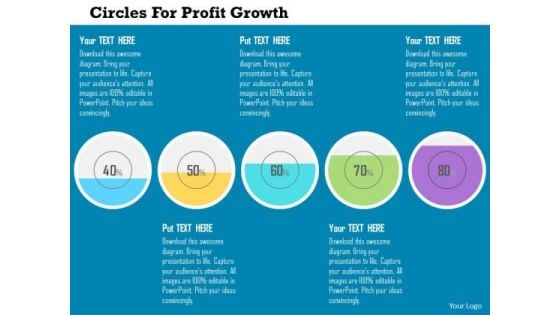
Business Diagram Circles For Profit Growth Presentation Template
This diagram displays four text circles for profit growth. This business diagram has been designed with graphic of circles with percentage ratios. Use this diagram to depict business planning process in your presentations.
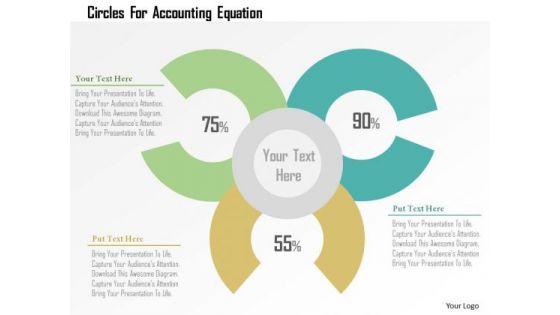
Business Diagram Circles For Accounting Equation PowerPoint Templates
Graphic of Venn diagram with percentage value has been used to design this business diagram. These circles may also be used to depict accounting equations. Use this diagram to illustrate your thoughts and experiences to your staff.
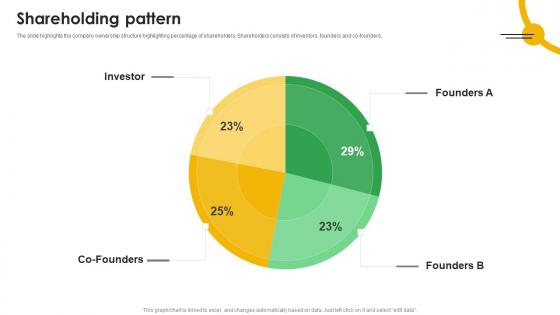
Shareholding Pattern Mobile App Analytics Company Fund Raising Pitch Deck Microsoft Pdf
The slide highlights the company ownership structure highlighting percentage of shareholders. Shareholders consists of investors, founders and co founders. If your project calls for a presentation, then Slidegeeks is your go to partner because we have professionally designed, easy to edit templates that are perfect for any presentation. After downloading, you can easily edit Shareholding Pattern Mobile App Analytics Company Fund Raising Pitch Deck Microsoft Pdf and make the changes accordingly. You can rearrange slides or fill them with different images. Check out all the handy templates The slide highlights the company ownership structure highlighting percentage of shareholders. Shareholders consists of investors, founders and co founders.

Balance Portfolio Funding Allocation Graph Investment Fund PPT Presentation
Mentioned slide provides information about balance options for funding allocation.It includes funding allocation graph, various investment avenues, percentage of funding allocation, and asset classes. There are so many reasons you need a Balance Portfolio Funding Allocation Graph Investment Fund PPT Presentation. The first reason is you can not spend time making everything from scratch, Thus, Slidegeeks has made presentation templates for you too. You can easily download these templates from our website easily. Mentioned slide provides information about balance options for funding allocation.It includes funding allocation graph, various investment avenues, percentage of funding allocation, and asset classes.
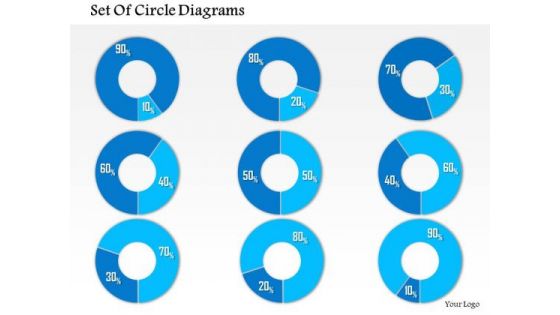
Business Framework 10 Percent To 90 Percent PowerPoint Presentation
This business diagram has been designed with graphic of multiple pie graphs. This diagram slide contains the concept of result analysis with percentage values. Use this diagram to present and compare data in an impressive manner
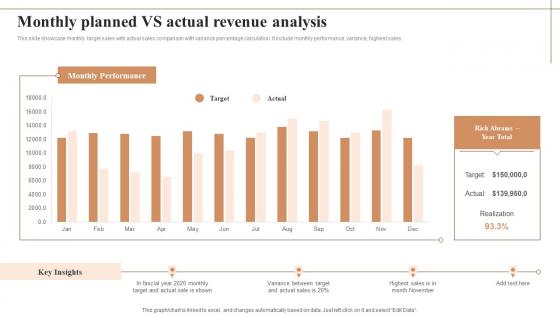
Monthly Planned Vs Actual Revenue Analysis Professional Pdf
This slide showcase monthly target sales with actual sales comparison with variance percentage calculation. It include monthly performance, variance, highest sales. Showcasing this set of slides titled Monthly Planned Vs Actual Revenue Analysis Professional Pdf The topics addressed in these templates are Monthly Planned, Actual Revenue Analysis All the content presented in this PPT design is completely editable. Download it and make adjustments in color, background, font etc. as per your unique business setting. This slide showcase monthly target sales with actual sales comparison with variance percentage calculation. It include monthly performance, variance, highest sales.
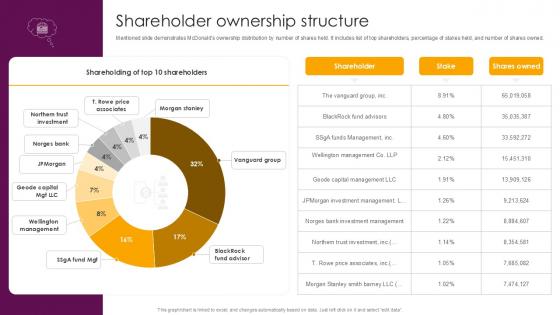
Shareholder Ownership Structure Food And Beverages Company Profile Ppt Example CP SS V
Mentioned slide demonstrates McDonalds ownership distribution by number of shares held. It includes list of top shareholders, percentage of stakes held, and number of shares owned. There are so many reasons you need a Shareholder Ownership Structure Food And Beverages Company Profile Ppt Example CP SS V The first reason is you can not spend time making everything from scratch, Thus, Slidegeeks has made presentation templates for you too. You can easily download these templates from our website easily. Mentioned slide demonstrates McDonalds ownership distribution by number of shares held. It includes list of top shareholders, percentage of stakes held, and number of shares owned.
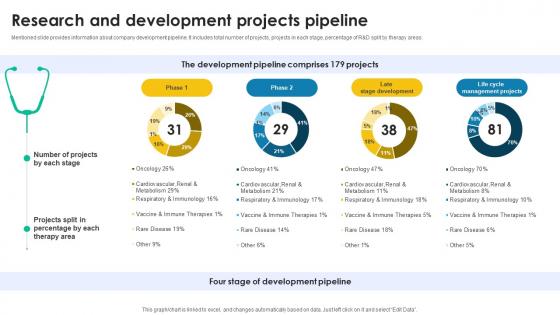
Research And Development Projects Pipeline Medical Research And Development Company Profile CP SS V
Mentioned slide provides information about company development pipeline. It includes total number of projects, projects in each stage, percentage of RandD split by therapy areas. Find a pre-designed and impeccable Research And Development Projects Pipeline Medical Research And Development Company Profile CP SS V. The templates can ace your presentation without additional effort. You can download these easy-to-edit presentation templates to make your presentation stand out from others. So, what are you waiting for Download the template from Slidegeeks today and give a unique touch to your presentation. Mentioned slide provides information about company development pipeline. It includes total number of projects, projects in each stage, percentage of RandD split by therapy areas.
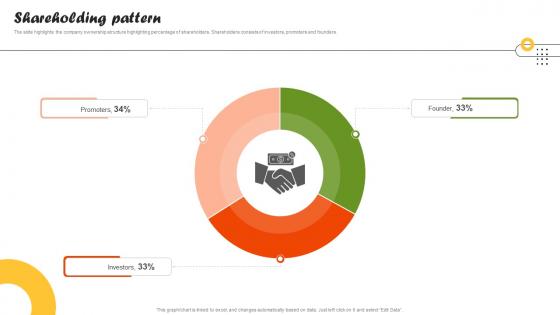
Shareholding Pattern On Demand Food Delivery Platform Investor Funding Elevator Pitch Deck
The slide highlights the company ownership structure highlighting percentage of shareholders. Shareholders consists of investors, promoters and founders. Find a pre-designed and impeccable Shareholding Pattern On Demand Food Delivery Platform Investor Funding Elevator Pitch Deck. The templates can ace your presentation without additional effort. You can download these easy-to-edit presentation templates to make your presentation stand out from others. So, what are you waiting for Download the template from Slidegeeks today and give a unique touch to your presentation. The slide highlights the company ownership structure highlighting percentage of shareholders. Shareholders consists of investors, promoters and founders.
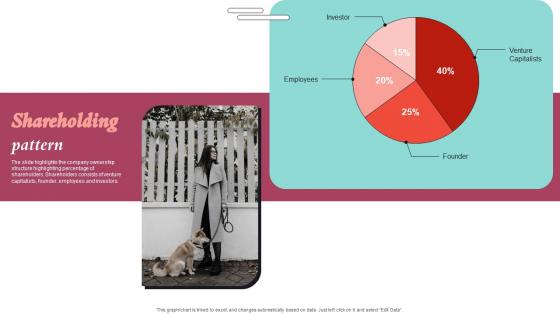
Shareholding Pattern Pet Care Company Investor Funding Elevator Pitch Deck Infographics Pdf
The slide highlights the company ownership structure highlighting percentage of shareholders. Shareholders consists of venture capitalists, founder, employees and investors. Make sure to capture your audiences attention in your business displays with our gratis customizable Shareholding Pattern Pet Care Company Investor Funding Elevator Pitch Deck Infographics Pdf. These are great for business strategies, office conferences, capital raising or task suggestions. If you desire to acquire more customers for your tech business and ensure they stay satisfied, create your own sales presentation with these plain slides. The slide highlights the company ownership structure highlighting percentage of shareholders. Shareholders consists of venture capitalists, founder, employees and investors.

Patient Retention Approaches For Improving Brand Loyalty Current Patient Satisfaction Status Graphics PDF
This slide shows the current Patient Satisfaction Status at the medical facility. This slide shows the percentage of patients that are satisfied and percentage that are dissatisfied at a medical facility due to various reasons.Deliver and pitch your topic in the best possible manner with this patient retention approaches for improving brand loyalty current patient satisfaction status graphics pdf Use them to share invaluable insights on percentages patients, patient satisfaction status, dissatisfied are around and impress your audience. This template can be altered and modified as per your expectations. So, grab it now.


 Continue with Email

 Home
Home


