Percentage Charts
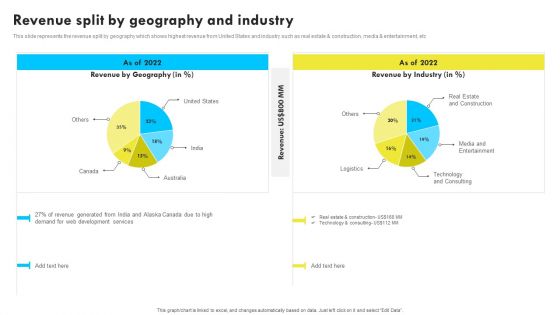
Revenue Split By Geography And Industry Web Design And Development Company Profile Microsoft PDF
This slide represents the revenue split by geography which shows highest revenue from United States and industry such as real estate and construction, media and entertainment, etc The best PPT templates are a great way to save time, energy, and resources. Slidegeeks have 100 percentage editable powerpoint slides making them incredibly versatile. With these quality presentation templates, you can create a captivating and memorable presentation by combining visually appealing slides and effectively communicating your message. Download Revenue Split By Geography And Industry Web Design And Development Company Profile Microsoft PDF from Slidegeeks and deliver a wonderful presentation.
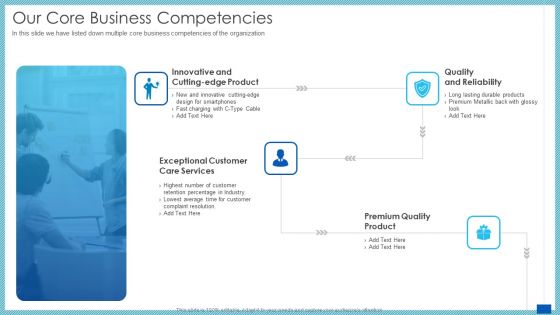
Evaluation Evolving Advanced Enterprise Development Marketing Tactics Our Core Business Competencies Brochure PDF
In this slide we have listed down multiple core business competencies of the organization. Presenting evaluation evolving advanced enterprise development marketing tactics our core business competencies brochure pdf to provide visual cues and insights. Share and navigate important information on four stages that need your due attention. This template can be used to pitch topics like retention percentage in industry, quality and reliability, premium quality product, exceptional customer care services, innovative and cutting edge product . In addtion, this PPT design contains high resolution images, graphics, etc, that are easily editable and available for immediate download.

Scale Up Plan For Data Inventory Model Budget Summary For Data Repository Expansion And Optimization Project Structure PDF
This slide represents the cost associated with each stage of the data repository expansion project. It also provides details regarding the percentage of the overall budget utilization at every step. Deliver an awe inspiring pitch with this creative scale up plan for data inventory model budget summary for data repository expansion and optimization project structure pdf. Topics like planning, designing, implementation, testing, go live can be discussed with this completely editable template. It is available for immediate download depending on the needs and requirements of the user.
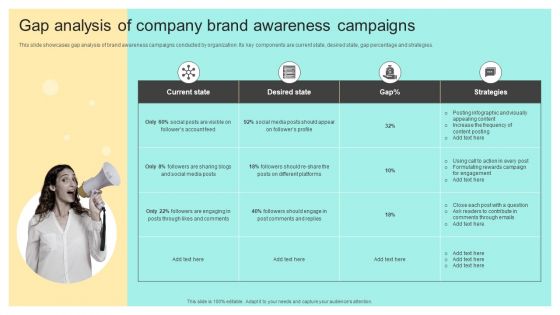
Gap Analysis Of Company Brand Awareness Campaigns Online And Offline Brand Download PDF
This slide showcases gap analysis of brand awareness campaigns conducted by organization. Its key components are current state, desired state, gap percentage and strategies.Welcome to our selection of the Gap Analysis Of Company Brand Awareness Campaigns Online And Offline Brand Download PDF. These are designed to help you showcase your creativity and bring your sphere to life. Planning and Innovation are essential for any business that is just starting out. This collection contains the designs that you need for your everyday presentations. All of our PowerPoints are 100 precent editable, so you can customize them to suit your needs. This multi-purpose template can be used in various situations. Grab these presentation templates today.
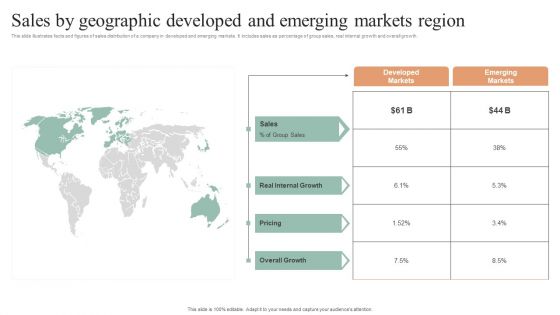
Sales By Geographic Developed And Emerging Markets Region Inspiration PDF
This slide illustrates facts and figures of sales distribution of a company in developed and emerging markets. It includes sales as percentage of group sales, real internal growth and overall growth. Presenting Sales By Geographic Developed And Emerging Markets Region Inspiration PDF to dispense important information. This template comprises one stages. It also presents valuable insights into the topics including Internal Growth, Sales, Pricing. This is a completely customizable PowerPoint theme that can be put to use immediately. So, download it and address the topic impactfully.
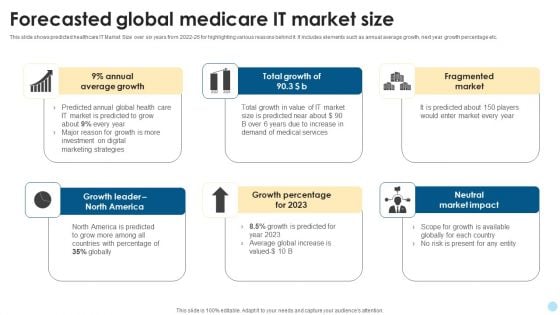
Forecasted Global Medicare IT Market Size Pictures PDF
This slide shows predicted healthcare IT Market Size over six years from 2022-26 for highlighting various reasons behind it. It includes elements such as annual average growth, next year growth percentage etc. Presenting Forecasted Global Medicare IT Market Size Pictures PDF to dispense important information. This template comprises six stages. It also presents valuable insights into the topics including Annual Average Growth, Fragmented Market, Neutral Market Impact. This is a completely customizable PowerPoint theme that can be put to use immediately. So, download it and address the topic impactfully.
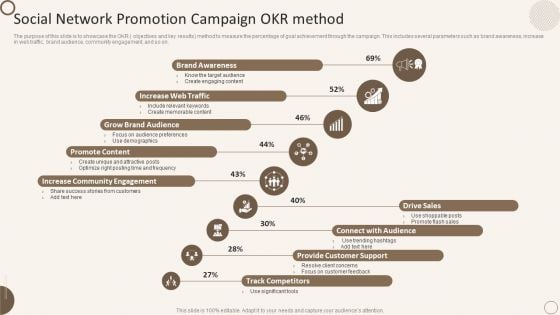
Social Network Promotion Campaign Okr Method Ppt Model Graphics Template PDF
The purpose of this slide is to showcase the OKR objectives and key results method to measure the percentage of goal achievement through the campaign. This includes several parameters such as brand awareness, increase in web traffic, brand audience, community engagement, and so on. Presenting Social Network Promotion Campaign Okr Method Ppt Model Graphics Template PDF to dispense important information. This template comprises nine stages. It also presents valuable insights into the topics including Promote Content, Brand Awareness, Increase Web Traffic. This is a completely customizable PowerPoint theme that can be put to use immediately. So, download it and address the topic impactfully.
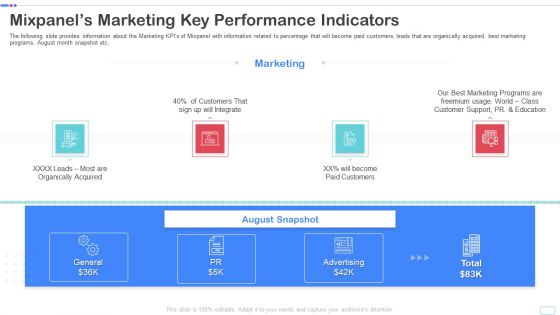
Mixpanel Capital Raising Pitch Deck Mixpanels Marketing Key Performance Indicators Portrait PDF
The following slide provides information about the Marketing KPIs of Mixpanel with information related to percentage that will become paid customers, leads that are organically acquired, best marketing programs, August month snapshot etc. Presenting mixpanel capital raising pitch deck mixpanels marketing key performance indicators portrait pdf to provide visual cues and insights. Share and navigate important information on four stages that need your due attention. This template can be used to pitch topics like mixpanels marketing key performance indicators. In addtion, this PPT design contains high resolution images, graphics, etc, that are easily editable and available for immediate download.
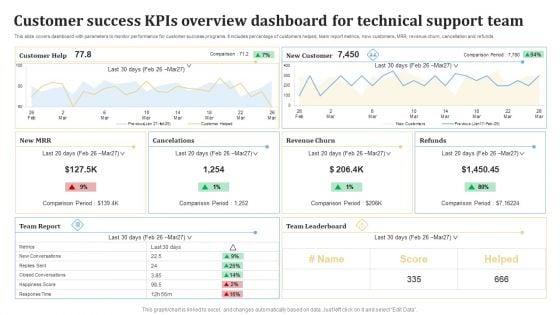
Customer Success KPIS Overview Dashboard For Technical Support Team Ppt PowerPoint Presentation Gallery Layouts PDF
This slide covers dashboard with parameters to monitor performance for customer success programs. It includes percentage of customers helped, team report metrics, new customers, MRR, revenue churn, cancellation and refunds. Showcasing this set of slides titled Customer Success KPIS Overview Dashboard For Technical Support Team Ppt PowerPoint Presentation Gallery Layouts PDF. The topics addressed in these templates are Customer, Cancelations, New Customer, Revenue Churn. All the content presented in this PPT design is completely editable. Download it and make adjustments in color, background, font etc. as per your unique business setting.
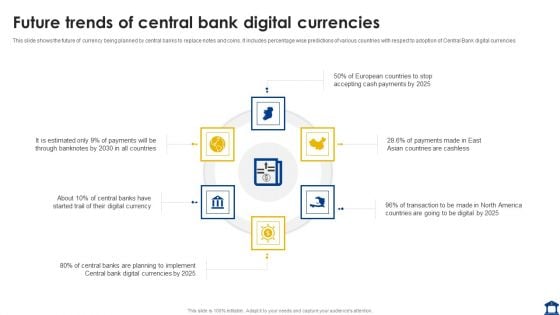
Future Trends Of Central Bank Digital Currencies Guidelines PDF
This slide shows the future of currency being planned by central banks to replace notes and coins. It includes percentage wise predictions of various countries with respect to adoption of Central Bank digital currencies. Persuade your audience using this Future Trends Of Central Bank Digital Currencies Guidelines PDF. This PPT design covers six stages, thus making it a great tool to use. It also caters to a variety of topics including Accepting Cash Payments, Planning, Digital Currency. Download this PPT design now to present a convincing pitch that not only emphasizes the topic but also showcases your presentation skills.
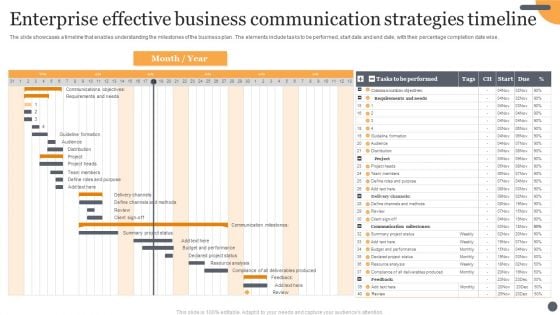
Enterprise Effective Business Communication Strategies Timeline Rules PDF
The slide showcases a timeline that enables understanding the milestones of the business plan . The elements include tasks to be performed, start date and end date, with their percentage completion date wise. Pitch your topic with ease and precision using this Enterprise Effective Business Communication Strategies Timeline Rules PDF. This layout presents information on Communications Objectives, Requirements And Needs, Communication Milestones. It is also available for immediate download and adjustment. So, changes can be made in the color, design, graphics or any other component to create a unique layout.
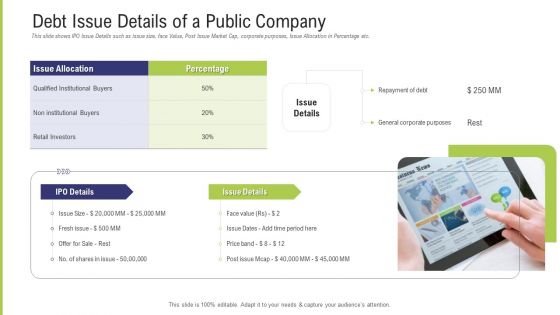
Funding Pitch Deck To Obtain Long Term Debt From Banks Debt Issue Details Of A Public Company Ideas PDF
This slide shows IPO Issue Details such as issue size, face Value, Post Issue Market Cap, corporate purposes, Issue Allocation in Percentage etc. Presenting funding pitch deck to obtain long term debt from banks debt issue details of a public company ideas pdf to provide visual cues and insights. Share and navigate important information on one stage that need your due attention. This template can be used to pitch topics like general corporate purposes, retail investors, price band, debt issue details of a public company. In addtion, this PPT design contains high resolution images, graphics, etc, that are easily editable and available for immediate download.
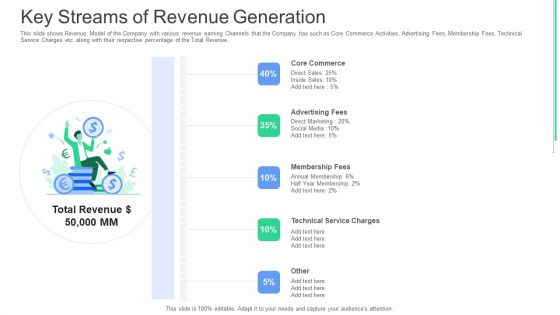
Key Streams Of Revenue Generation Ppt Outline Graphics PDF
This slide shows Revenue Model of the Company with various revenue earning Channels that the Company has such as Core Commerce Activities, Advertising Fees, Membership Fees, Technical Service Charges etc. along with their respective percentage of the Total Revenue. This is a key streams of revenue generation ppt outline graphics pdf. template with various stages. Focus and dispense information on five stages using this creative set, that comes with editable features. It contains large content boxes to add your information on topics like core commerce, advertising fees, membership fees, technical service charges, other. You can also showcase facts, figures, and other relevant content using this PPT layout. Grab it now.
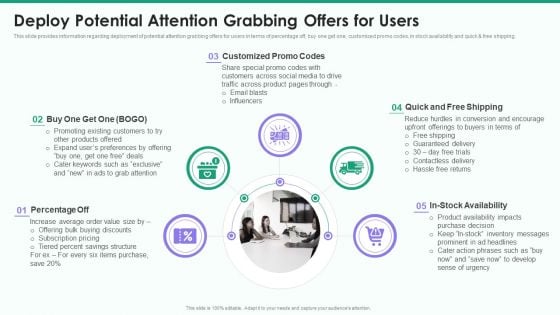
Online Business Strategy Playbook Deploy Potential Attention Grabbing Offers For Users Download PDF
This slide provides information regarding deployment of potential attention grabbing offers for users in terms of percentage off, buy one get one, customized promo codes, in stock availability and quick and free shipping. Presenting online business strategy playbook deploy potential attention grabbing offers for users download pdf to provide visual cues and insights. Share and navigate important information on five stages that need your due attention. This template can be used to pitch topics like customized, influencers, preferences, structure, purchase. In addtion, this PPT design contains high resolution images, graphics, etc, that are easily editable and available for immediate download.
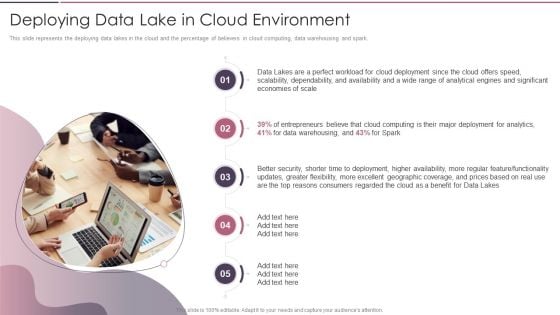
Data Lake Development With Azure Cloud Software Deploying Data Lake In Cloud Environment Designs PDF
This slide represents the deploying data lakes in the cloud and the percentage of believers in cloud computing, data warehousing and spark. Presenting Data Lake Development With Azure Cloud Software Deploying Data Lake In Cloud Environment Designs PDF to provide visual cues and insights. Share and navigate important information on five stages that need your due attention. This template can be used to pitch topics like Warehousing, Excellent Geographic, Security. In addtion, this PPT design contains high resolution images, graphics, etc, that are easily editable and available for immediate download.
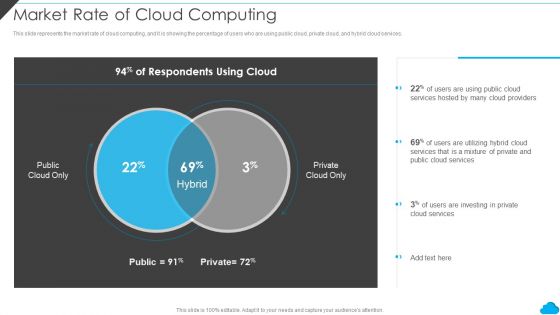
Cloud Distribution Service Models Market Rate Of Cloud Computing Introduction PDF
This slide represents the market rate of cloud computing, and it is showing the percentage of users who are using public cloud, private cloud, and hybrid cloud services. This is a Cloud Distribution Service Models Market Rate Of Cloud Computing Introduction PDF template with various stages. Focus and dispense information on two stages using this creative set, that comes with editable features. It contains large content boxes to add your information on topics like Market Rate, Cloud Computing. You can also showcase facts, figures, and other relevant content using this PPT layout. Grab it now.
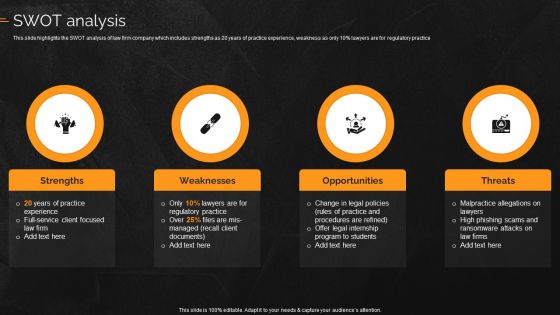
Law And Enforcement Company Profile Swot Analysis Formats PDF
This slide highlights the SWOT analysis of law firm company which includes strengths as 20 years of practice experience, weakness as only 10 percentage lawyers are for regulatory practice. This is a Law And Enforcement Company Profile Swot Analysis Formats PDF template with various stages. Focus and dispense information on five stages using this creative set, that comes with editable features. It contains large content boxes to add your information on topics like Opportunities, Threats, Weaknesses, Strengths. You can also showcase facts, figures, and other relevant content using this PPT layout. Grab it now.
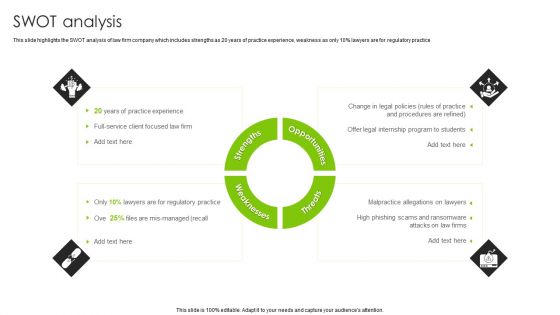
International Legal And Business Services Company Profile SWOT Analysis Formats PDF
This slide highlights the SWOT analysis of law firm company which includes strengths as 20 years of practice experience, weakness as only 10 percentage lawyers are for regulatory practice. This is a International Legal And Business Services Company Profile SWOT Analysis Formats PDF template with various stages. Focus and dispense information on four stages using this creative set, that comes with editable features. It contains large content boxes to add your information on topics like Opportunities, Threats, Strengths, Weakness. You can also showcase facts, figures, and other relevant content using this PPT layout. Grab it now.
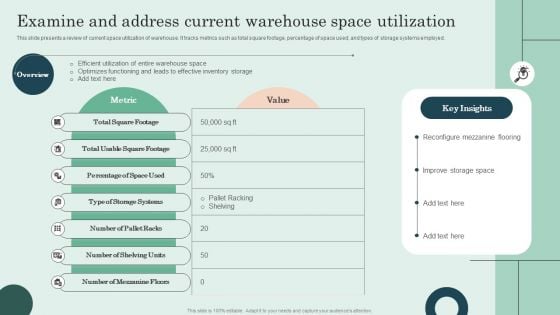
Examine And Address Current Warehouse Space Utilization Pictures PDF
This slide presents a review of current space utilization of warehouse. It tracks metrics such as total square footage, percentage of space used, and types of storage systems employed. Take your projects to the next level with our ultimate collection of Examine And Address Current Warehouse Space Utilization Pictures PDF. Slidegeeks has designed a range of layouts that are perfect for representing task or activity duration, keeping track of all your deadlines at a glance. Tailor these designs to your exact needs and give them a truly corporate look with your own brand colors they will make your projects stand out from the rest.
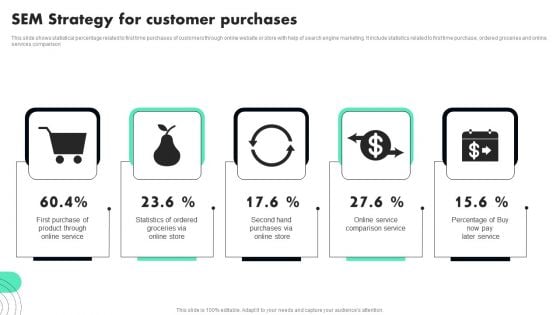
SEM Strategy For Customer Purchases Mockup PDF
This slide shows statistical percentage related to first time purchases of customers through online website or store with help of search engine marketing. It include statistics related to first time purchase, ordered groceries and online services comparison. Persuade your audience using this SEM Strategy For Customer Purchases Mockup PDF. This PPT design covers five stages, thus making it a great tool to use. It also caters to a variety of topics including Online Service, Purchase, Comparison Service. Download this PPT design now to present a convincing pitch that not only emphasizes the topic but also showcases your presentation skills.
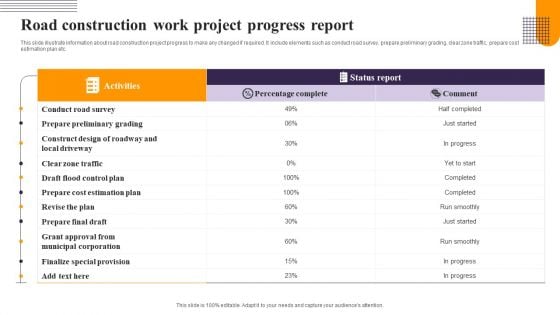
Road Construction Work Project Progress Report Background PDF
This slide illustrate information about road construction project progress to make any changed if required. It include elements such as conduct road survey, prepare preliminary grading, clear zone traffic, prepare cost estimation plan etc. Pitch your topic with ease and precision using this Road Construction Work Project Progress Report Background PDF. This layout presents information on Activities, Status Report, Percentage Complete. It is also available for immediate download and adjustment. So, changes can be made in the color, design, graphics or any other component to create a unique layout.

Feature Acquisition Marketing Campaign Analysis Slides PDF
This slide illustrate analysis of feature adoption marketing campaign to get improvement plan for future marketing campaign. It includes elements such as features, number of clicks, percentage volume, key insights etc. Pitch your topic with ease and precision using this Feature Acquisition Marketing Campaign Analysis Slides PDF. This layout presents information on Feature Acquisition, Marketing Campaign Analysis. It is also available for immediate download and adjustment. So, changes can be made in the color, design, graphics or any other component to create a unique layout.
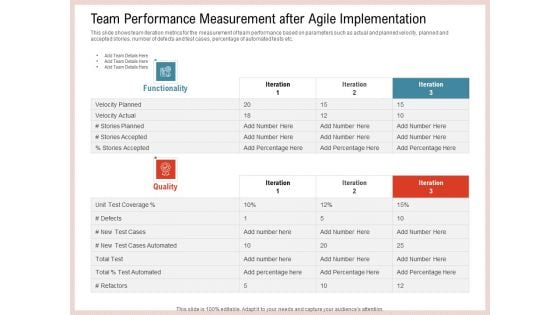
Agile Model Improve Task Team Performance Team Performance Measurement After Agile Implementation Slides PDF
This slide shows team iteration metrics for the measurement of team performance based on parameters such as actual and planned velocity, planned and accepted stories, number of defects and test cases, percentage of automated tests etc. Deliver and pitch your topic in the best possible manner with this agile model improve task team performance team performance measurement after agile implementation slides pdf. Use them to share invaluable insights on planned, actual, automated and impress your audience. This template can be altered and modified as per your expectations. So, grab it now.
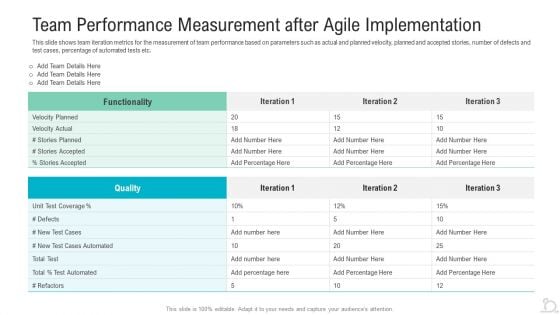
Team Performance Measurement After Agile Implementation Inspiration PDF
This slide shows team iteration metrics for the measurement of team performance based on parameters such as actual and planned velocity, planned and accepted stories, number of defects and test cases, percentage of automated tests etc. Deliver and pitch your topic in the best possible manner with this team performance measurement after agile implementation inspiration pdf. Use them to share invaluable insights on functionality, quality, velocity planned and impress your audience. This template can be altered and modified as per your expectations. So, grab it now.

Agile Methodologies Team Performance Measurement After Agile Implementation Infographics Ppt Infographic Template Ideas PDF
This slide shows team iteration metrics for the measurement of team performance based on parameters such as actual and planned velocity, planned and accepted stories, number of defects and test cases, percentage of automated tests etc. Deliver an awe inspiring pitch with this creative agile methodologies team performance measurement after agile implementation infographics ppt infographic template ideas pdf bundle. Topics like Team Performance Measurement After Agile Implementation can be discussed with this completely editable template. It is available for immediate download depending on the needs and requirements of the user.
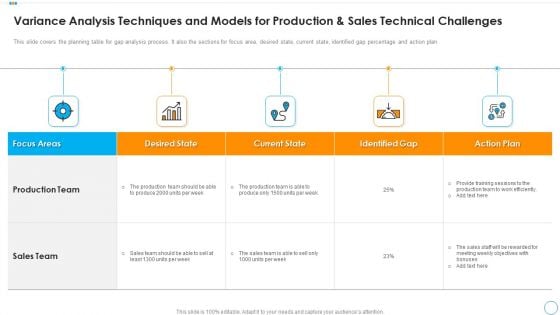
Variance Analysis Techniques And Models For Production And Sales Technical Challenges Graphics PDF
This slide covers the planning table for gap analysis process. It also the sections for focus area, desired state, current state, identified gap percentage and action plan.Persuade your audience using this variance analysis techniques and models for production and sales technical challenges graphics pdf. This PPT design covers five stages, thus making it a great tool to use. It also caters to a variety of topics including production team, sales team, identified gap. Download this PPT design now to present a convincing pitch that not only emphasizes the topic but also showcases your presentation skills.
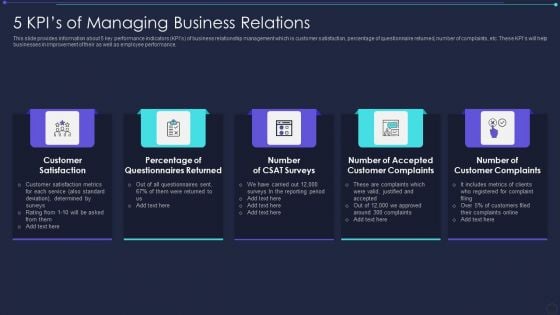
5 Kpis Of Managing Business Relations Elements PDF
This slide provides information about 5 key performance indicators KPIs of business relationship management which is customer satisfaction, percentage of questionnaire returned, number of complaints, etc. These KPIs will help businesses in improvement of their as well as employee performance. Presenting 5 kpis of managing business relations elements pdf to dispense important information. This template comprises five stages. It also presents valuable insights into the topics including customer satisfaction, determined surveys. This is a completely customizable PowerPoint theme that can be put to use immediately. So, download it and address the topic impactfully.
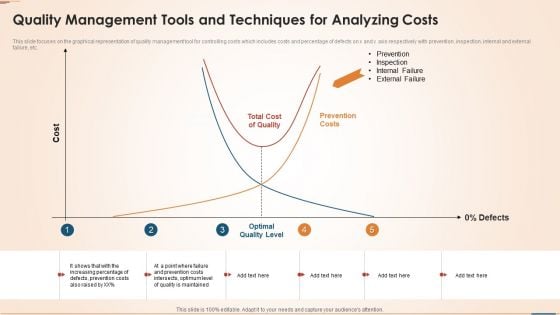
Quality Management Tools And Techniques For Analyzing Costs Brochure PDF
This slide focuses on the graphical representation of quality management tool for controlling costs which includes costs and percentage of defects on x and y axis respectively with prevention, inspection, internal and external failure, etc. Presenting quality management tools and techniques for analyzing costs brochure pdf to dispense important information. This template comprises five stages. It also presents valuable insights into the topics including cost, total cost of quality, prevention costs, optimal quality level, prevention, inspection, internal failure, external failure. This is a completely customizable PowerPoint theme that can be put to use immediately. So, download it and address the topic impactfully.
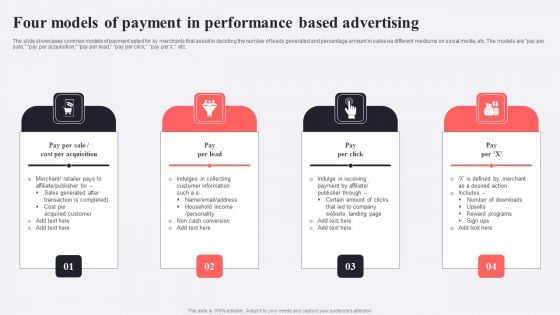
Four Models Of Payment In Performance Based Advertising Ideas PDF
The slide showcases common models of payment opted for by merchants that assist in deciding the number of leads generated and percentage amount in sales via different mediums on social media, etc. The models are pay per sale, pay per acquisition, pay per lead, pay per click, pay per X, etc. Presenting Four Models Of Payment In Performance Based Advertising Ideas PDF to dispense important information. This template comprises four stages. It also presents valuable insights into the topics including Cost Per Acquisition, Pay Per Lead, Pay Per Click. This is a completely customizable PowerPoint theme that can be put to use immediately. So, download it and address the topic impactfully.
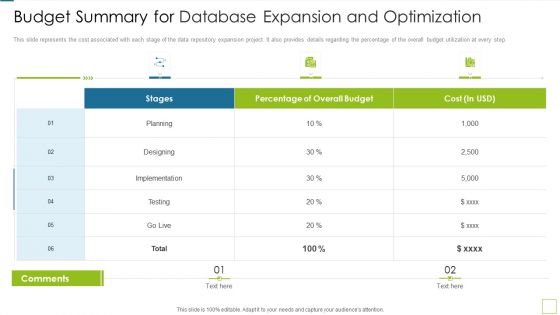
Database Expansion And Optimization Budget Summary For Database Expansion And Optimization Ppt Styles Graphics Pictures
This slide represents the cost associated with each stage of the data repository expansion project. It also provides details regarding the percentage of the overall budget utilization at every step. Deliver an awe inspiring pitch with this creative database expansion and optimization budget summary for database expansion and optimization ppt styles graphics pictures bundle. Topics like planning, designing, implementation, testing, go live can be discussed with this completely editable template. It is available for immediate download depending on the needs and requirements of the user.

Project Portfolio Highlights Web Design And Development Company Profile Professional PDF
This slide showcases the project portfolio highlights which shows successfully designed websites along with company name and location Welcome to our selection of the Project Portfolio Highlights Web Design And Development Company Profile Professional PDF. These are designed to help you showcase your creativity and bring your sphere to life. Planning and Innovation are essential for any business that is just starting out. This collection contains the designs that you need for your everyday presentations. All of our PowerPoints are 100 percentage editable, so you can customize them to suit your needs. This multi purpose template can be used in various situations. Grab these presentation templates today.
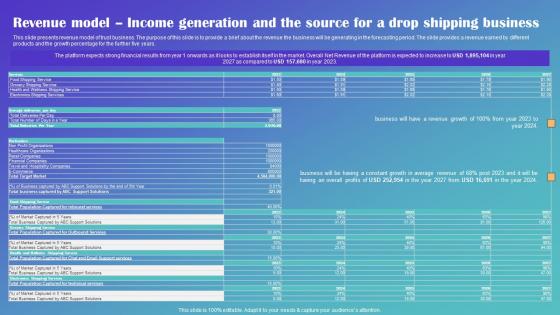
Revenue Model Income Generation And The Source Drop Shipping Business Plan Formats Pdf
This slide presents revenue model of trust business. The purpose of this slide is to provide a brief about the revenue the business will be generating in the forecasting period. The slide provides a revenue earned by different products and the growth percentage for the further five years. If you are looking for a format to display your unique thoughts, then the professionally designed Revenue Model Income Generation And The Source Drop Shipping Business Plan Formats Pdf is the one for you. You can use it as a Google Slides template or a PowerPoint template. Incorporate impressive visuals, symbols, images, and other charts. Modify or reorganize the text boxes as you desire. Experiment with shade schemes and font pairings. Alter, share or cooperate with other people on your work. Download Revenue Model Income Generation And The Source Drop Shipping Business Plan Formats Pdf and find out how to give a successful presentation. Present a perfect display to your team and make your presentation unforgettable. This slide presents revenue model of trust business. The purpose of this slide is to provide a brief about the revenue the business will be generating in the forecasting period. The slide provides a revenue earned by different products and the growth percentage for the further five years.
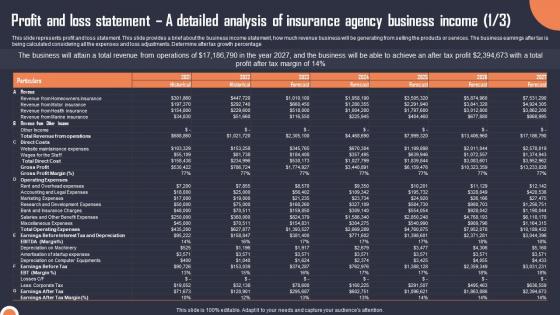
Profit And Loss Statement A Detailed Analysis Of Insurance Building An Insurance Company Sample Pdf
This slide represents profit and loss statement. This slide provides a brief about the business income statement, how much revenue business will be generating from selling the products or services. The business earnings after tax is being calculated considering all the expenses and loss adjustments. Determine after tax growth percentage If you are looking for a format to display your unique thoughts, then the professionally designed Profit And Loss Statement A Detailed Analysis Of Insurance Building An Insurance Company Sample Pdf is the one for you. You can use it as a Google Slides template or a PowerPoint template. Incorporate impressive visuals, symbols, images, and other charts. Modify or reorganize the text boxes as you desire. Experiment with shade schemes and font pairings. Alter, share or cooperate with other people on your work. Download Profit And Loss Statement A Detailed Analysis Of Insurance Building An Insurance Company Sample Pdf and find out how to give a successful presentation. Present a perfect display to your team and make your presentation unforgettable. This slide represents profit and loss statement. This slide provides a brief about the business income statement, how much revenue business will be generating from selling the products or services. The business earnings after tax is being calculated considering all the expenses and loss adjustments. Determine after tax growth percentage
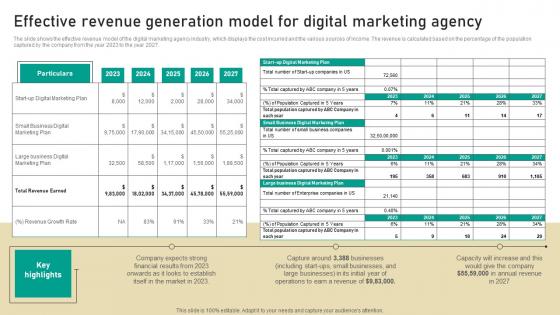
Effective Revenue Generation Model For Digital Digital Marketing Business Designs Pdf
The slide shows the effective revenue model of the digital marketing agency industry, which displays the cost incurred and the various sources of income. The revenue is calculated based on the percentage of the population captured by the company from the year 2023 to the year 2027. If you are looking for a format to display your unique thoughts, then the professionally designed Effective Revenue Generation Model For Digital Digital Marketing Business Designs Pdf is the one for you. You can use it as a Google Slides template or a PowerPoint template. Incorporate impressive visuals, symbols, images, and other charts. Modify or reorganize the text boxes as you desire. Experiment with shade schemes and font pairings. Alter, share or cooperate with other people on your work. Download Effective Revenue Generation Model For Digital Digital Marketing Business Designs Pdf and find out how to give a successful presentation. Present a perfect display to your team and make your presentation unforgettable. The slide shows the effective revenue model of the digital marketing agency industry, which displays the cost incurred and the various sources of income. The revenue is calculated based on the percentage of the population captured by the company from the year 2023 to the year 2027.
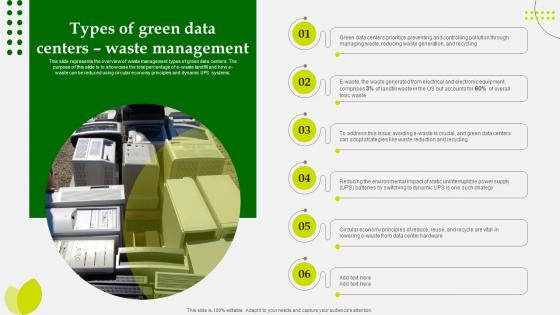
Green Computing Types Of Green Data Centers Waste Management
This slide represents the overview of waste management types of green data centers. The purpose of this slide is to showcase the total percentage of e-waste landfill and how e-waste can be reduced using circular economy principles and dynamic UPS systems. If you are looking for a format to display your unique thoughts, then the professionally designed Green Computing Types Of Green Data Centers Waste Management is the one for you. You can use it as a Google Slides template or a PowerPoint template. Incorporate impressive visuals, symbols, images, and other charts. Modify or reorganize the text boxes as you desire. Experiment with shade schemes and font pairings. Alter, share or cooperate with other people on your work. Download Green Computing Types Of Green Data Centers Waste Management and find out how to give a successful presentation. Present a perfect display to your team and make your presentation unforgettable. This slide represents the overview of waste management types of green data centers. The purpose of this slide is to showcase the total percentage of e-waste landfill and how e-waste can be reduced using circular economy principles and dynamic UPS systems.
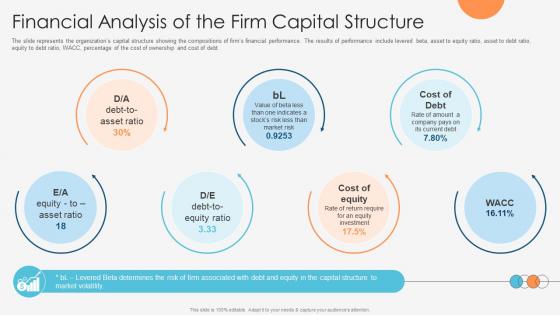
Enhancing Profitability Modelling Financial Analysis Of The Firm Capital Structure
The slide represents the organizations capital structure showing the compositions of firms financial performance. The results of performance include levered beta, asset to equity ratio, asset to debt ratio, equity to debt ratio, WACC, percentage of the cost of ownership and cost of debt. If you are looking for a format to display your unique thoughts, then the professionally designed Enhancing Profitability Modelling Financial Analysis Of The Firm Capital Structure is the one for you. You can use it as a Google Slides template or a PowerPoint template. Incorporate impressive visuals, symbols, images, and other charts. Modify or reorganize the text boxes as you desire. Experiment with shade schemes and font pairings. Alter, share or cooperate with other people on your work. Download Enhancing Profitability Modelling Financial Analysis Of The Firm Capital Structure and find out how to give a successful presentation. Present a perfect display to your team and make your presentation unforgettable. The slide represents the organizations capital structure showing the compositions of firms financial performance. The results of performance include levered beta, asset to equity ratio, asset to debt ratio, equity to debt ratio, WACC, percentage of the cost of ownership and cost of debt.
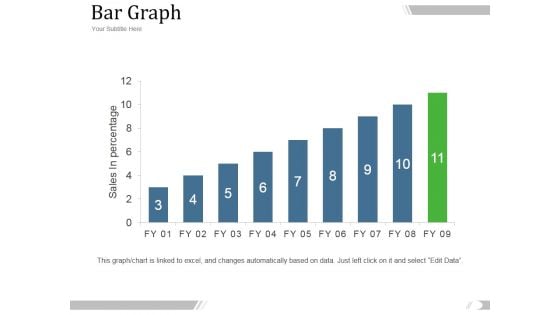
Bar Graph Ppt PowerPoint Presentation Introduction
This is a bar graph ppt powerpoint presentation introduction. This is a eleven stage process. The stages in this process are management, marketing, business, fy, graph, sales in percentage.
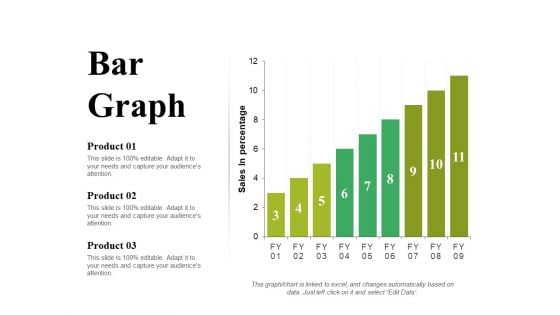
Bar Graph Ppt PowerPoint Presentation Portfolio Slide Portrait
This is a bar graph ppt powerpoint presentation portfolio slide portrait. This is a three stage process. The stages in this process are product, sales in percentage, bar graph, growth, success.
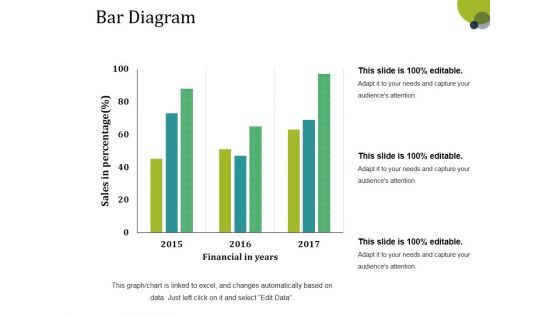
Bar Diagram Ppt PowerPoint Presentation Gallery Structure
This is a bar diagram ppt powerpoint presentation gallery structure. This is a three stage process. The stages in this process are financial in years, sales in percentage, bar graph, growth, success.
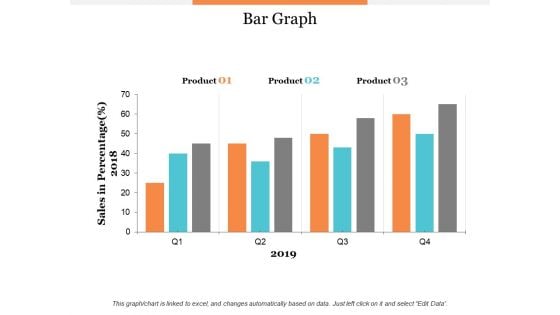
Bar Graph Product Ppt PowerPoint Presentation Model Graphic Tips
This is a bar graph product ppt powerpoint presentation model graphic tips. This is a three stage process. The stages in this process are product, percentage, business, management, marketing.
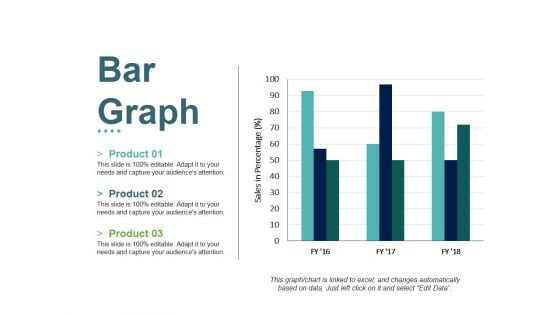
Bar Graph Ppt PowerPoint Presentation File Slides
This is a bar graph ppt powerpoint presentation file slides. This is a three stage process. The stages in this process are product, sales in percentage, bar graph, growth, success.
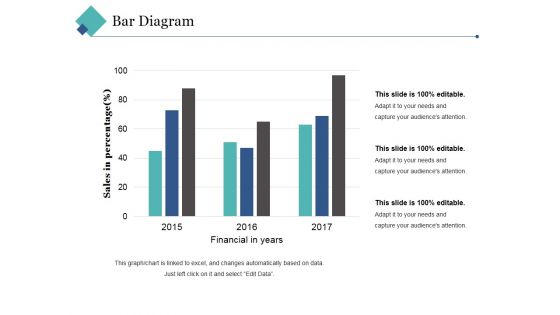
Bar Diagram Ppt PowerPoint Presentation Pictures Background Image
This is a bar diagram ppt powerpoint presentation pictures background image. This is a three stage process. The stages in this process are financial in years, sales in percentage, bar graph, growth, success.
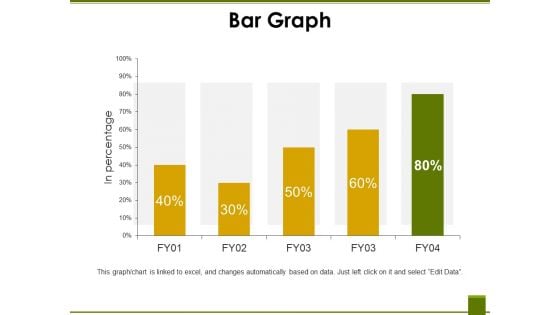
Bar Graph Template 2 Ppt PowerPoint Presentation Ideas Files
This is a bar graph template 2 ppt powerpoint presentation ideas files. This is a five stage process. The stages in this process are in percentage, business, marketing, finance, graph.
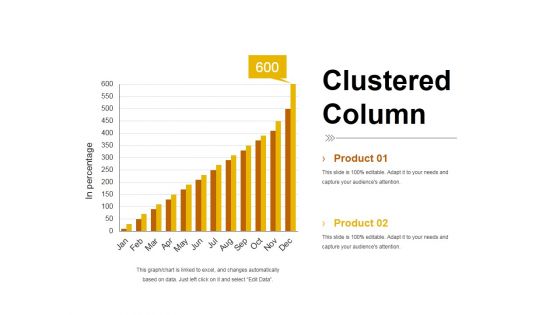
Clustered Column Template 2 Ppt PowerPoint Presentation Summary Smartart
This is a clustered column template 2 ppt powerpoint presentation summary smartart. This is a two stage process. The stages in this process are product, bar graph, in percentage, clustered column, growth.
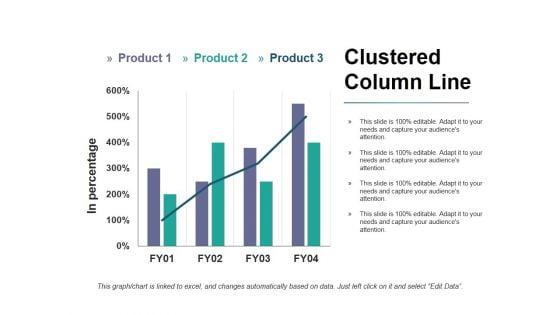
Clustered Column Line Ppt PowerPoint Presentation Infographic Template Pictures
This is a clustered column line ppt powerpoint presentation infographic template pictures. This is a three stage process. The stages in this process are product, in percentage, bar graph, growth, success.
Bar Graph Ppt PowerPoint Presentation Infographics Icon
This is a bar graph ppt powerpoint presentation infographics icon. This is a two stage process. The stages in this process are business, marketing, financial year, in percentage, graph.
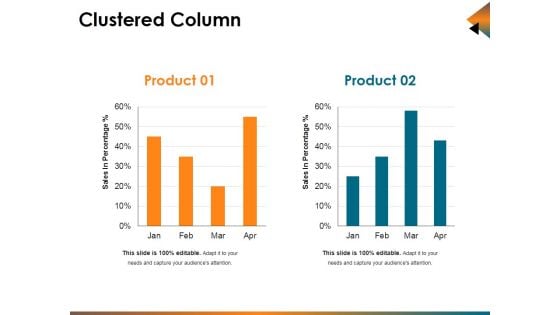
Clustered Column Ppt PowerPoint Presentation Infographic Template Background Designs
This is a clustered column ppt powerpoint presentation infographic template background designs. This is a two stage process. The stages in this process are sales in percentage, bar, business, marketing, planning.
Clustered Column Line Ppt PowerPoint Presentation Icon Ideas
This is a clustered column line ppt powerpoint presentation icon ideas. This is a three stage process. The stages in this process are product, in percentage, bar graph, success, growth.
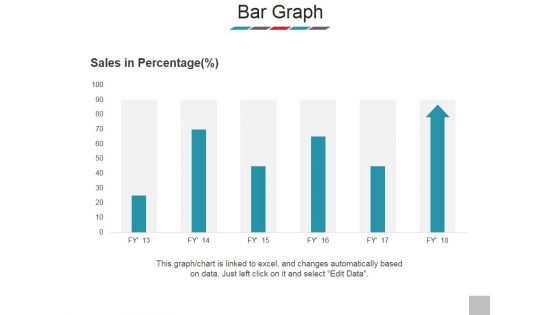
Bar Graph Ppt PowerPoint Presentation Model Clipart
This is a bar graph ppt powerpoint presentation model clipart. This is a six stage process. The stages in this process are sales in percentage, product, bar graph, business, marketing.
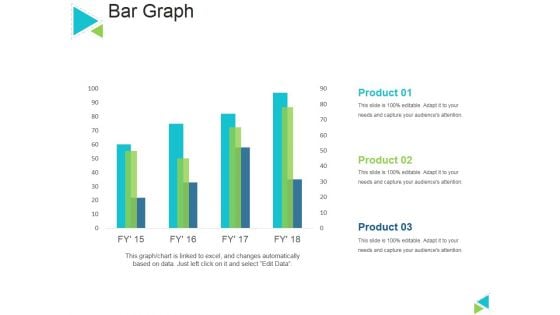
Bar Graph Ppt PowerPoint Presentation Outline Layout
This is a bar graph ppt powerpoint presentation outline layout. This is a four stage process. The stages in this process are sales in percentage, product, bar graph, business, marketing.
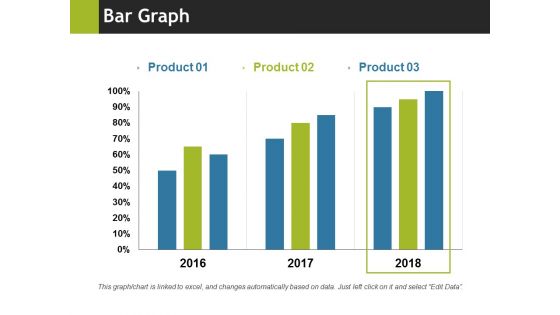
Bar Graph Ppt PowerPoint Presentation Summary Format
This is a bar graph ppt powerpoint presentation summary format. This is a three stage process. The stages in this process are bar graph, business, marketing, years, percentage, finance.
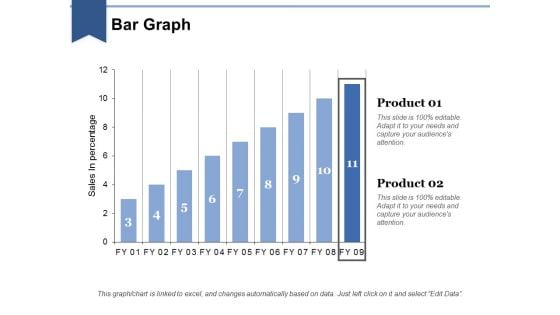
Bar Graph Ppt PowerPoint Presentation Layouts Influencers
This is a bar graph ppt powerpoint presentation layouts influencers. This is a two stage process. The stages in this process are business, marketing, in bar graph, sales in percentage, finance.
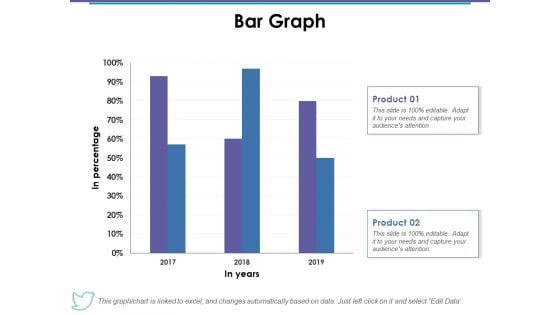
Bar Graph Ppt PowerPoint Presentation Styles Skills
This is a bar graph ppt powerpoint presentation styles skills. This is a two stage process. The stages in this process are bar graph, product, in year, in percentage, business.
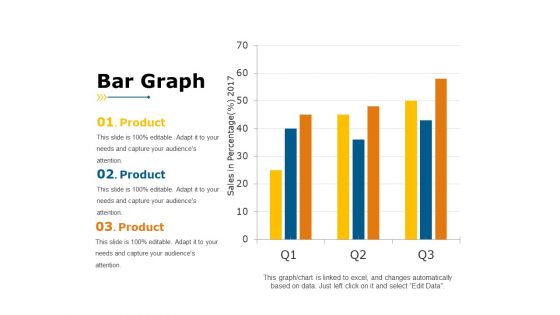
Bar Graph Ppt PowerPoint Presentation Portfolio Example
This is a bar graph ppt powerpoint presentation portfolio example. This is a three stage process. The stages in this process are sales in percentage, year, business, product, business, graph.
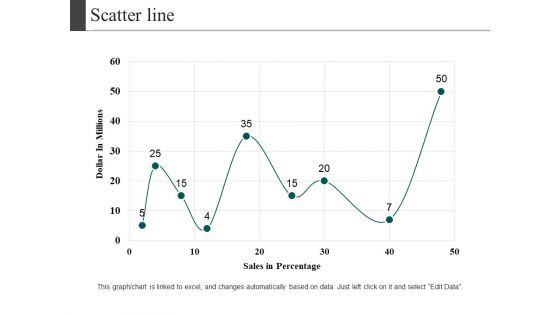
Scatter Line Ppt PowerPoint Presentation Visual Aids Diagrams
This is a scatter line ppt powerpoint presentation visual aids diagrams. This is a one stage process. The stages in this process are dollar in millions, sales in percentage, growth, business, marketing.
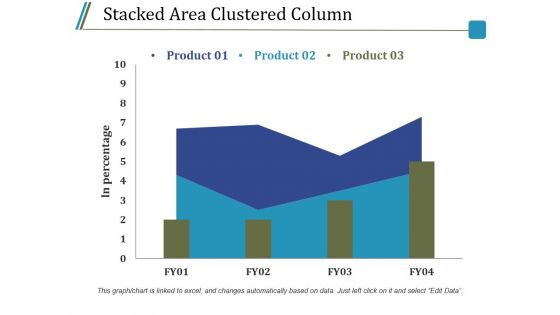
Stacked Area Clustered Column Ppt PowerPoint Presentation Model Guidelines
This is a stacked area clustered column ppt powerpoint presentation model guidelines. This is a three stage process. The stages in this process are product, in percentage, bar graph, growth, success.
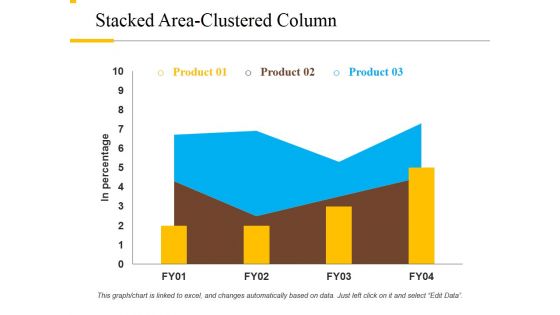
Stacked Area Clustered Column Ppt PowerPoint Presentation File Background Designs
This is a stacked area clustered column ppt powerpoint presentation file background designs. This is a three stage process. The stages in this process are product, in percentage, growth, success, bar graph.
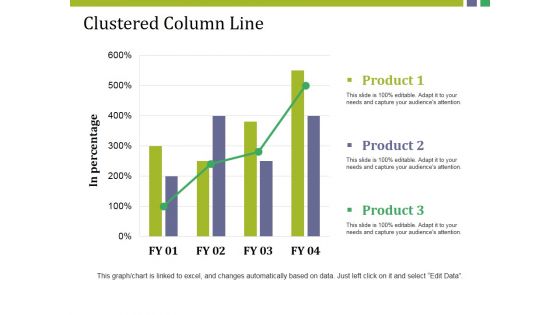
Clustered Column Line Ppt PowerPoint Presentation Pictures Example
This is a clustered column line ppt powerpoint presentation pictures example. This is a three stage process. The stages in this process are product, in percentage, bar graph, growth, success.
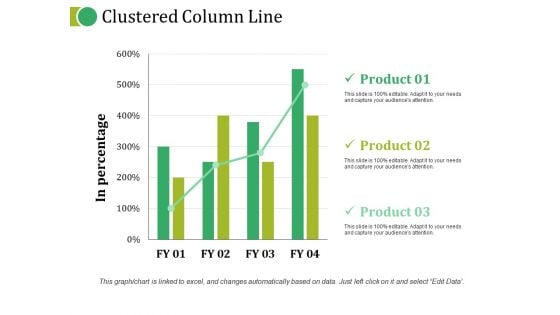
Clustered Column Line Ppt PowerPoint Presentation Topics
This is a clustered column line ppt powerpoint presentation topics. This is a three stage process. The stages in this process are product, in percentage, growth, bar graph, business.
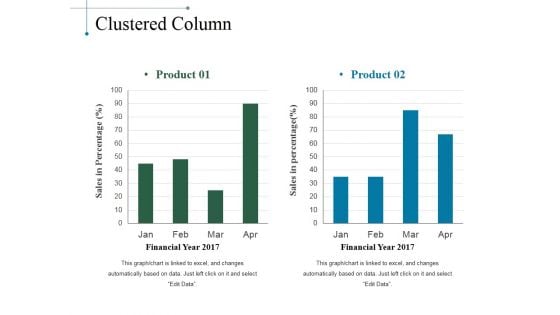
Clustered Column Ppt PowerPoint Presentation Slides Smartart
This is a clustered column ppt powerpoint presentation slides smartart. This is a two stage process. The stages in this process are product, sales in percentage, financial year, bar graph.


 Continue with Email

 Home
Home


