Percentage Growth
Quality Cost Report Ppt PowerPoint Presentation Icon Information
This is a quality cost report ppt powerpoint presentation icon information. This is a three stage process. The stages in this process are types of cost, quality cost, percentage of sales, prevention cost business.

Stock Photo Pyramid Of Balls With Percent Symbols Pwerpoint Slide
This image has been crafted for displaying the concept of discount and leadership. This image contains the graphic of metal balls with percentage symbol on each ball. Use this image and build a unique presentation for business and marketing topics.

Banking Concept Financial PowerPoint Templates And PowerPoint Backgrounds 0211
Microsoft PowerPoint Template and Background with money and percentage symbol in hands Add on the colours with our Banking Concept Financial PowerPoint Templates And PowerPoint Backgrounds 0211. Give your views a decorative look.
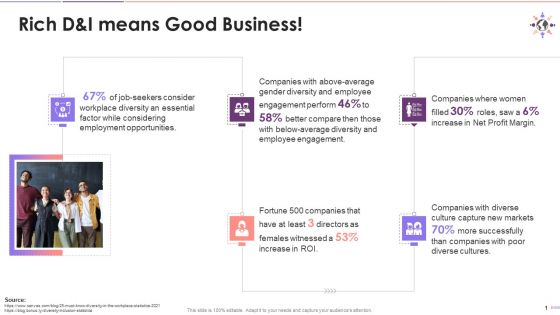
Rich Diversity And Inclusion Benefits Business Training Ppt
This slide provides five major quantitative figures to prove that rich D and I indeed means good business. The most powerful, example, perhaps, is that diverse and inclusive businesses capture new markets 70 percentage more successfully.
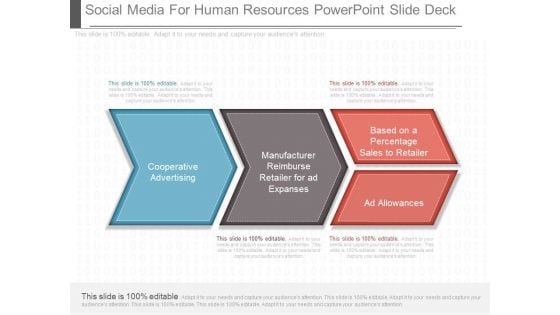
Social Media For Human Resources Powerpoint Slide Deck
This is a social media for human resources powerpoint slide deck. This is a four stage process. The stages in this process are cooperative advertising, manufacturer reimburse retailer for ad expanses, based on a percentage sales to retailer, ad allowances.
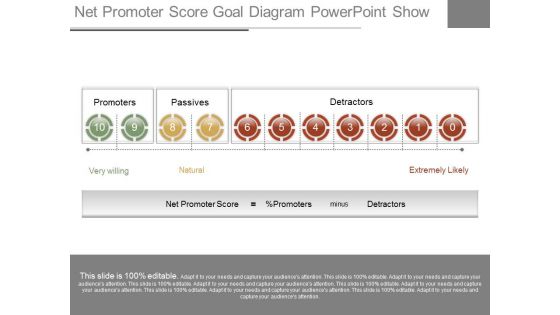
Net Promoter Score Goal Diagram Powerpoint Show
This is a net promoter score goal diagram powerpoint show. This is a ten stage process. The stages in this process are promoters, passives, detractors, very willing, natural, extremely likely, net promoter score, percentage promoters, minus.
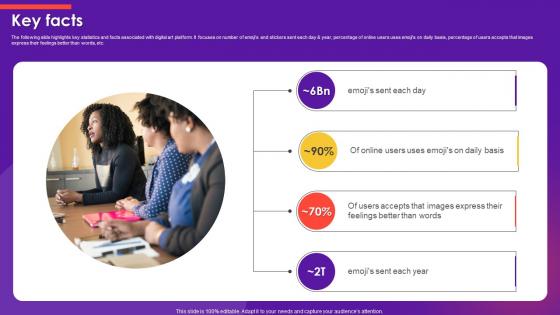
Key Facts Emoji Marketplace Investor Funding Elevator Pitch Deck
The following slide highlights key statistics and facts associated with digital art platform. It focuses on number of emojis and stickers sent each day and year, percentage of online users uses emojis on daily basis, percentage of users accepts that images express their feelings better than words, etc. If your project calls for a presentation, then Slidegeeks is your go-to partner because we have professionally designed, easy-to-edit templates that are perfect for any presentation. After downloading, you can easily edit Key Facts Emoji Marketplace Investor Funding Elevator Pitch Deck and make the changes accordingly. You can rearrange slides or fill them with different images. Check out all the handy templates The following slide highlights key statistics and facts associated with digital art platform. It focuses on number of emojis and stickers sent each day and year, percentage of online users uses emojis on daily basis, percentage of users accepts that images express their feelings better than words, etc.
Business Framework Goal Setting Ladder PowerPoint Presentation
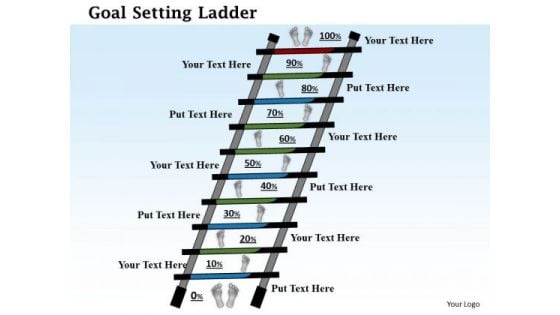
This image slide has been designed to express views on goals, targets and achievements. This image slide displays goal setting ladder with percentage steps. This image slide will enhance the quality of your presentations.
Business Diagram 3d Pie Chart Graphic Diagram PowerPoint Ppt Presentation
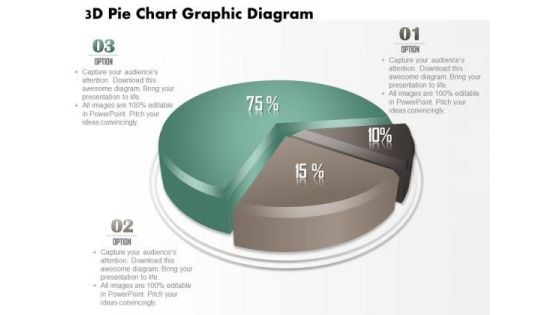
This business diagram displays 3d pie chart. It contains pie chart with percentage ratios. This pie chart is a visual way of displaying data. Use this diagram to make outstanding presentations.

Business Diagram Business Bar Graph For Data Analysis Presentation Template
This business slide displays pie charts with percentage ratios. This diagram is a data visualization tool that gives you a simple way to present statistical information. This slide helps your audience examines and interprets the data you present.
Business Framework 10 Percent To 90 Percent PowerPoint Presentation
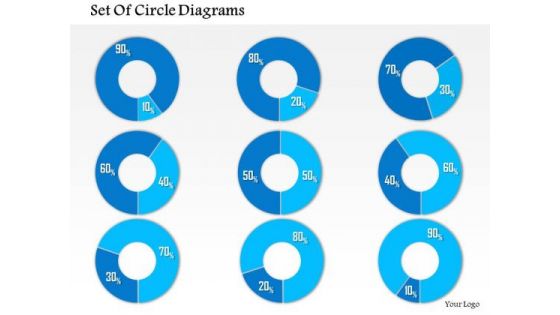
This business diagram has been designed with graphic of multiple pie graphs. This diagram slide contains the concept of result analysis with percentage values. Use this diagram to present and compare data in an impressive manner
Business Diagram Diagram For Visual Data Display Presentation Template
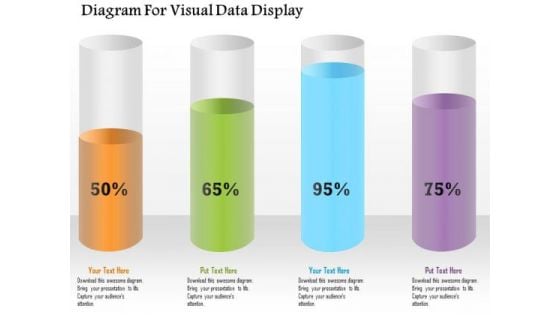
Four colored cylindrical bars with percentage values are used to design this power point template. This diagram slide helps to display financial data analysis. Use this diagram for your business and finance related presentations.
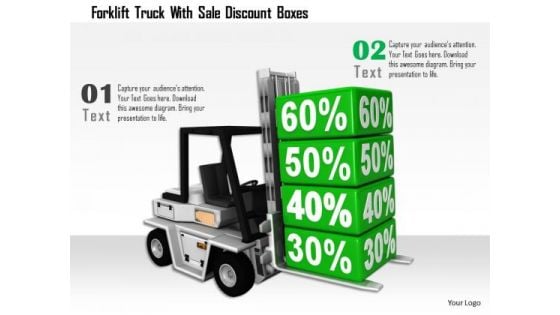
Stock Photo Forklift Truck With Sale Discount Boxes PowerPoint Slide
This image is designed with forklift truck with percentage box. It contains objects like delivery truck with boxes to make meaningful presentations. This is an excellent graphics to attract your viewers.
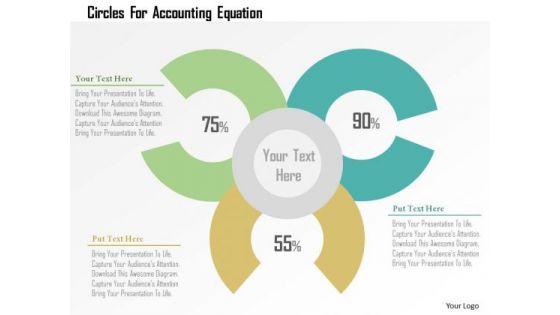
Business Diagram Circles For Accounting Equation PowerPoint Templates
Graphic of Venn diagram with percentage value has been used to design this business diagram. These circles may also be used to depict accounting equations. Use this diagram to illustrate your thoughts and experiences to your staff.
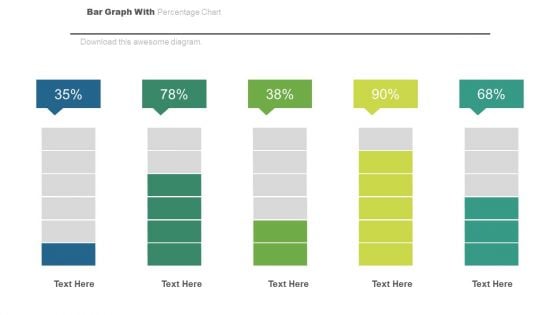
Bar Graph For Statistical Analysis Powerpoint Slides
This PowerPoint template has been designed with bar chart and percentage values. You may download this PPT slide to depict statistical analysis. Add this slide to your presentation and impress your superiors.
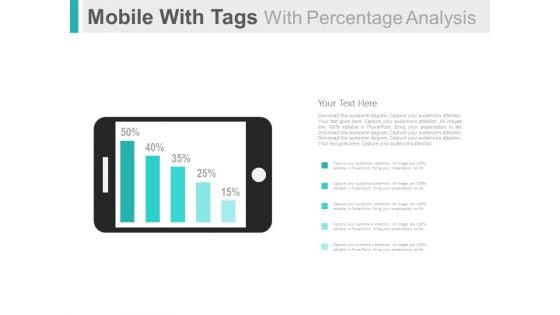
Mobile For Online Survey And Analysis Powerpoint Slides
This PowerPoint template has been designed with graphics of mobile and percentage bar graph. This PPT slide can be used to display online survey and analysis. You can download finance PowerPoint template to prepare awesome presentations.
Pie Chart For Customer Analysis Powerpoint Slides
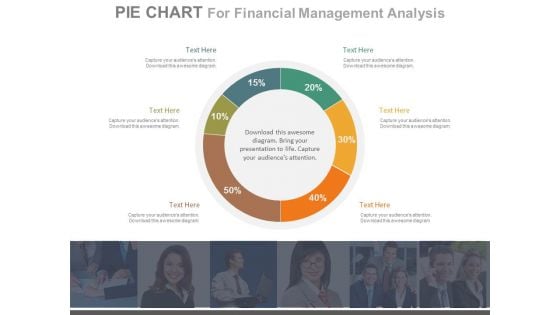
This PowerPoint template has been designed with percentage ratio pie chart. This PPT slide can be used to display customer analysis. You can download finance PowerPoint template to prepare awesome presentations.
Bar Graph With Yearly Statistical Analysis Powerpoint Slides
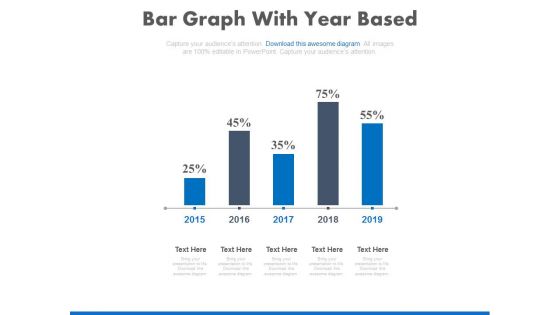
This PowerPoint template contains diagram of bar graph with yearly percentage ratios. You may download this slide to display statistical analysis. You can easily customize this template to make it more unique as per your need.
Four Colored Text Boxes With Icons Powerpoint Slides
This PowerPoint template has been designed with graphics of four text boxes. Download this PPT slide to display percentage data display. Use this professional template to build an exclusive presentation.
Four Steps For Financial Data Analysis Powerpoint Slides
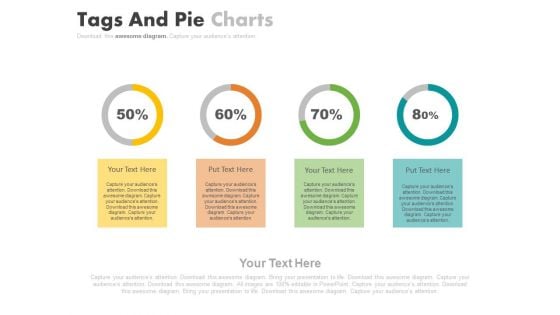
This PowerPoint contains four circles with percentage values. Download this diagram slide to display financial data analysis. This template is editable, You can edit text, color, shade and style of this diagram as per you need.
Ecuador Map With States Economic Analysis Powerpoint Slides
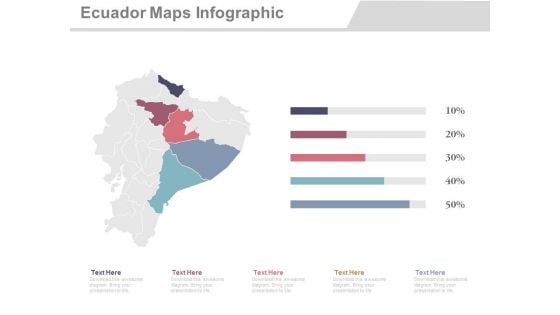
This PowerPoint template displays graphics of Ecuador map with different locations and percentage values. This Map template can be used in business presentations to depict economic analysis. This slide can also be used by school students for educational projects.
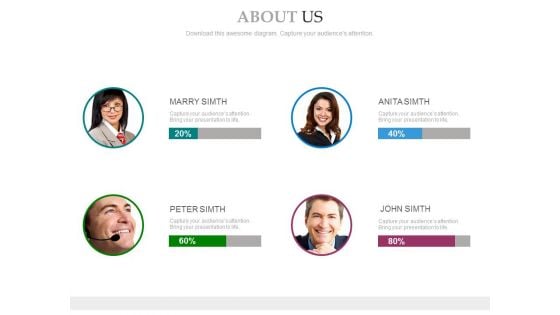
Business Partners About Us Slide Powerpoint Slides
The PowerPoint template has been designed with business men and percentage ratio. Use this PPT slide for business and partnership related topics. Explain your strategy to co-ordinate business activities.
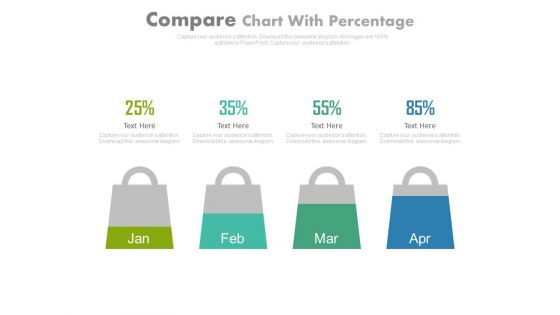
Four Months Sales Statistics Chart Powerpoint Slides
This PowerPoint template has been designed with four shopping bags with percentage values. Download this PPT slide to display four months sales statistics. Add this slide to your presentation and impress your superiors.

Three Text Tags Compare Chart Powerpoint Slides
This PowerPoint template has been designed with text tags and percentage data. You may download this PPT slide to display data comparison and analysis. Add this slide to your presentation and impress your superiors.
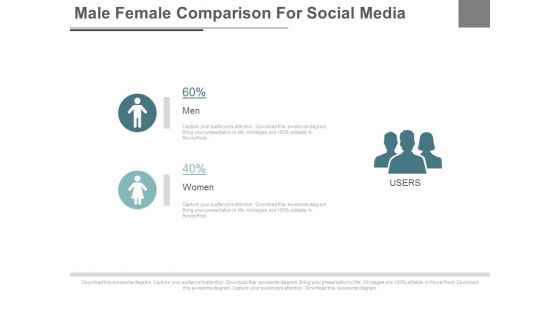
Male Female Social Media Users Powerpoint Slides
This PPT slide displays graphics of male female icons with percentage values. Use this PPT design to display male female ratios of social media users. This PowerPoint template can be customized as per requirements of business presentation.
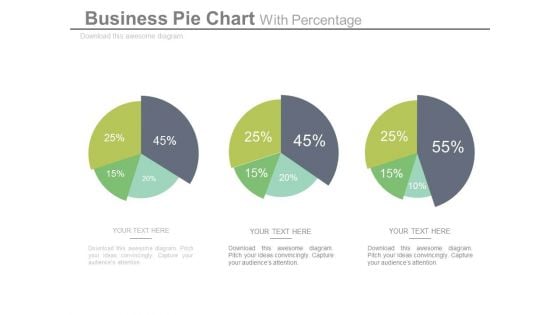
Pie Charts For Relative Comparison Study Powerpoint Slides
This power point template illustrates diagram of three pie charts with percentage values. This business slide can be used for relative comparison study. Present your views and ideas with this impressive slide.
Map Diagram With Four Locations Powerpoint Slides
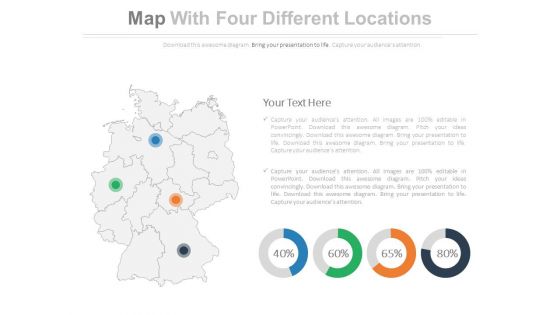
This PowerPoint template displays graphics of map diagram with four locations and percentage values. This Map template can be used in business presentations to depict economic analysis. This slide can also be used by school students for educational projects.
Financial Reporting Manager With Data Powerpoint Slides
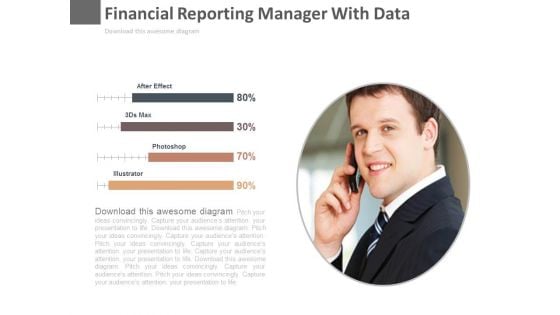
This PowerPoint template has been designed with graphics of finance manager and percentage data. This diagram is useful to exhibit financial management. This diagram slide can be used to make impressive presentations.

Skill Assessment Chart For Employee Performance Powerpoint Slides
Sliders with percentage values have been displayed in this business slide. This business diagram may be used as skill assessment chart. Download this PowerPoint template to build an exclusive presentation.
Column Chart For Financial Analysis Powerpoint Slides
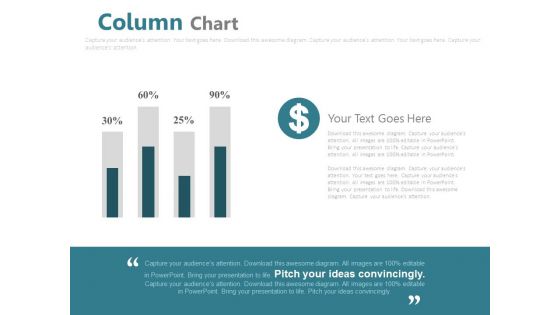
This PowerPoint template has been designed with graphics of column chart with percentage values. You may use this business slide design for topics like financial analysis and planning. This PPT slide is powerful tool to describe your ideas.
Two Teams Performance Analysis Chart Powerpoint Slides
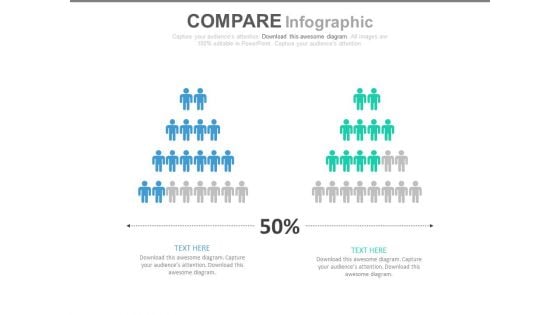
This PowerPoint template has been designed with icons of two teams with percentage values. Download this PPT slide to depict team?s performance analysis. Deliver amazing presentations to mesmerize your audience by using this PPT slide design.
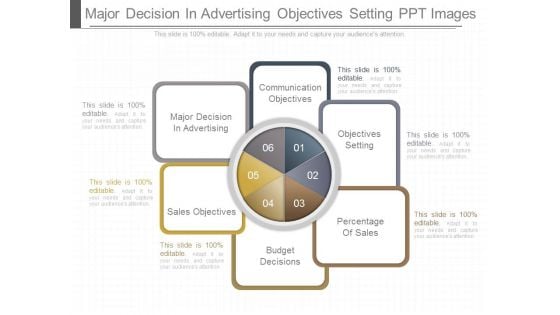
Major Decision In Advertising Objectives Setting Ppt Images
This is a major decision in advertising objectives setting ppt images. This is a six stage process. The stages in this process are communication objectives, objectives setting, percentage of sales, budget decisions, sales objectives, major decision in advertising.
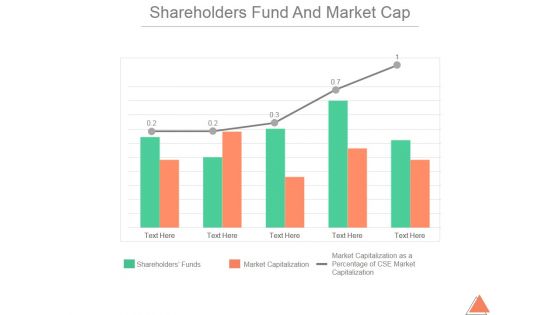
Shareholders Fund And Market Cap Ppt PowerPoint Presentation Guidelines
This is a shareholders fund and market cap ppt powerpoint presentation guidelines. This is a five stage process. The stages in this process are shareholders funds, market capitalization, market capitalization as a percentage of cse market capitalization.
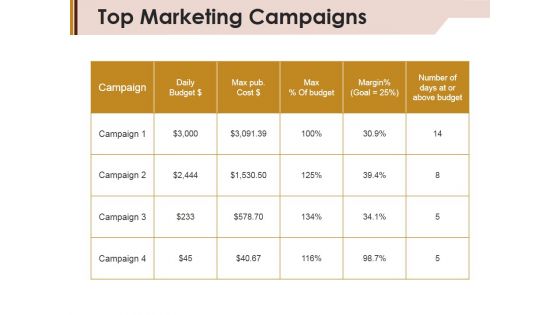
Top Marketing Campaigns Ppt PowerPoint Presentation Inspiration Structure
This is a top marketing campaigns ppt powerpoint presentation inspiration structure. This is a four stage process. The stages in this process are campaign, daily budget, margin, max percentage of budget.
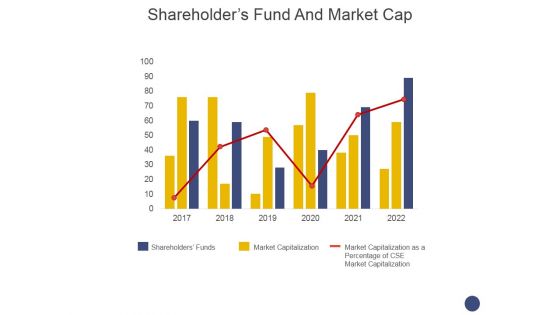
Shareholders Fund And Market Cap Ppt PowerPoint Presentation Show Background Image
This is a shareholders fund and market cap ppt powerpoint presentation show background image. This is a three stage process. The stages in this process are shareholders funds, market capitalization, market capitalization as a percentage of cse market capitalization.
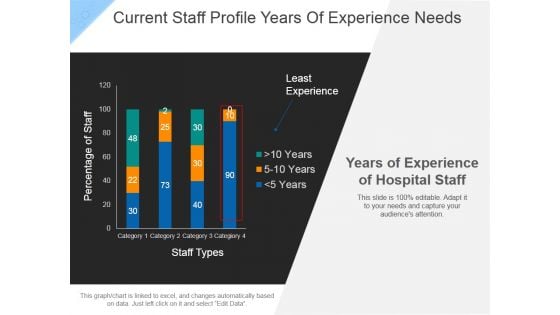
Current Staff Profile Years Of Experience Needs Ppt PowerPoint Presentation Portfolio Deck
This is a current staff profile years of experience needs ppt powerpoint presentation portfolio deck. This is a four stage process. The stages in this process are least experience, staff types, percentage of staff.
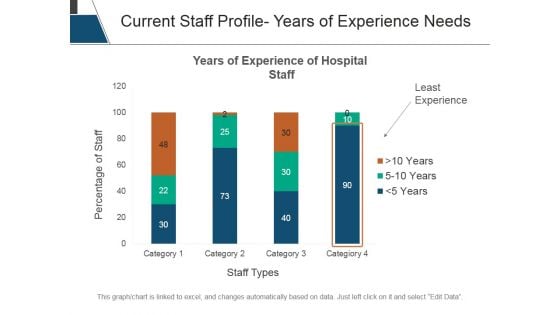
Current Staff Profile Years Of Experience Needs Ppt PowerPoint Presentation Model Structure
This is a current staff profile years of experience needs ppt powerpoint presentation model structure. This is a four stage process. The stages in this process are percentage of staff, staff types, least experience, years of experience of hospital.
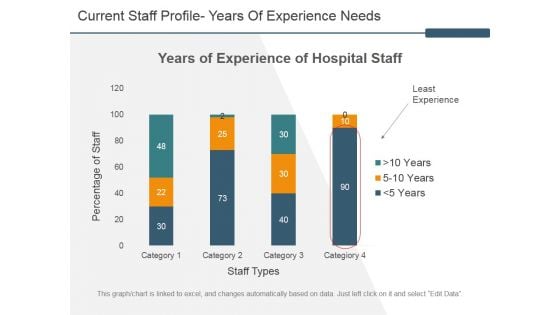
Current Staff Profile Years Of Experience Needs Ppt PowerPoint Presentation Layouts Influencers
This is a current staff profile years of experience needs ppt powerpoint presentation layouts influencers. This is a four stage process. The stages in this process are years of experience of hospital staff, percentage of staff, staff types, least experience.
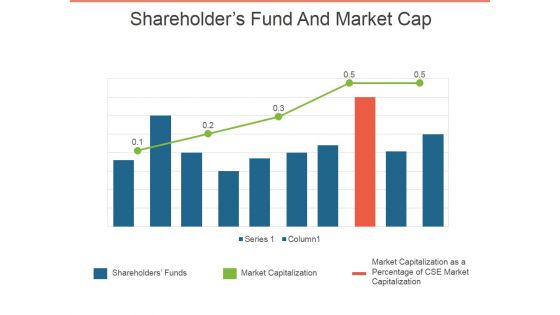
Shareholders Fund And Market Cap Ppt PowerPoint Presentation Layouts Aids
This is a shareholders fund and market cap ppt powerpoint presentation layouts aids. This is a five stage process. The stages in this process are shareholders funds, market capitalization, market capitalization as a percentage of cse market capitalization.

Current Staff Profile Years Of Experience Ppt PowerPoint Presentation Shapes
This is a current staff profile years of experience ppt powerpoint presentation shapes. This is a four stage process. The stages in this process are staff types, percentage of staff, least experience, years.
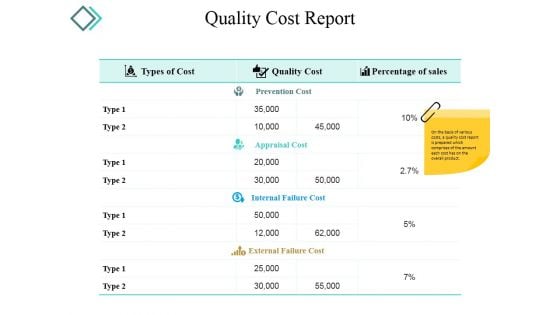
Quality Cost Report Template 2 Ppt PowerPoint Presentation Professional
This is a quality cost report template 2 ppt powerpoint presentation professional. This is a two stage process. The stages in this process are types of cost, quality cost, percentage of sales, prevention cost.
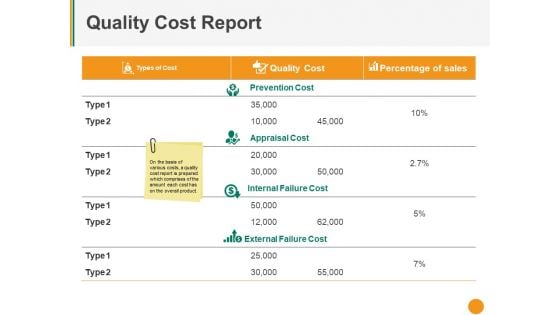
Quality Cost Report Ppt PowerPoint Presentation Model Portrait
This is a quality cost report ppt powerpoint presentation model portrait. This is a three stage process. The stages in this process are types of cost, quality cost, percentage of sales, prevention cost, appraisal cost.
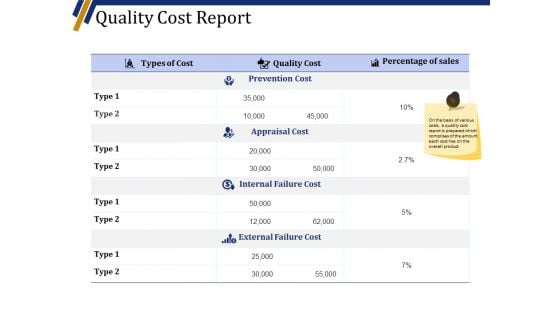
Quality Cost Report Ppt PowerPoint Presentation Portfolio Show
This is a quality cost report ppt powerpoint presentation portfolio show. This is a four stage process. The stages in this process are types of cost, quality cost, percentage of sales, prevention cost, appraisal cost.
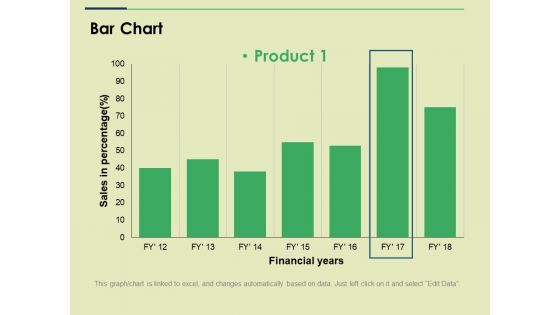
Bar Chart Ppt PowerPoint Presentation File Slide
This is a bar chart ppt powerpoint presentation file slide. This is a one stage process. The stages in this process are sales in percentage financial years, business, marketing, strategy, graph.
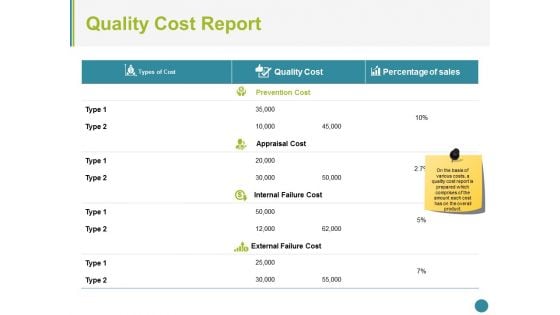
Quality Cost Report Ppt PowerPoint Presentation Tips
This is a quality cost report ppt powerpoint presentation tips. This is a two stage process. The stages in this process are types of cost, quality cost, percentage of sales.
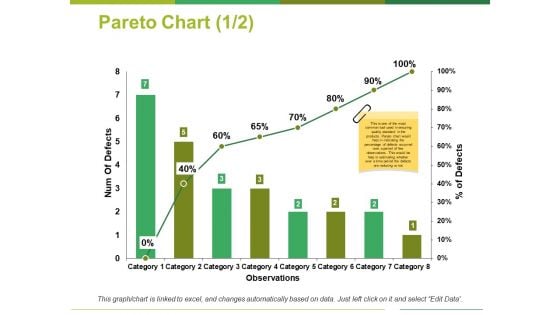
Pareto Chart Template 1 Ppt PowerPoint Presentation Outline Show
This is a pareto chart template 1 ppt powerpoint presentation outline show. This is a eight stage process. The stages in this process are num of defects, percentage of defects, observations, category.
Operational Performance Metrics Days Ppt PowerPoint Presentation Icon Maker
This is a operational performance metrics days ppt powerpoint presentation icon maker. This is a four stage process. The stages in this process are customer support tickets, lob efficiency measure, process downtime level, percentage of product defects.
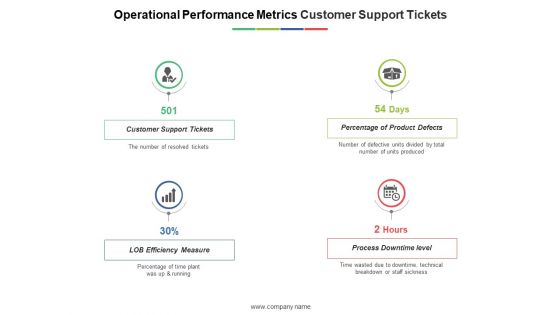
Operational Performance Metrics Customer Support Tickets Ppt PowerPoint Presentation Outline Graphics Design
This is a operational performance metrics customer support tickets ppt powerpoint presentation outline graphics design. This is a four stage process. The stages in this process are customer support tickets, percentage of product defects, lob efficiency measure, process downtime level.
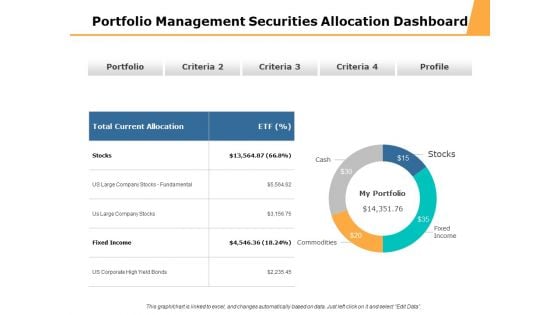
Portfolio Management Securities Allocation Dashboard Ppt PowerPoint Presentation Professional Design Ideas
This is a portfolio management securities allocation dashboard ppt powerpoint presentation professional design ideas. This is a four stage process. The stages in this process are percentage product, business, management, marketing.

Portfolio Summary Management Dashboard Ppt PowerPoint Presentation File Design Templates
This is a portfolio summary management dashboard ppt powerpoint presentation file design templates. This is a five stage process. The stages in this process are percentage product, business, management, marketing.
Human Hand With Percent Sign Ppt PowerPoint Presentation Icon Clipart Images
This is a human hand with percent sign ppt powerpoint presentation icon clipart images. This is a three stage process. The stages in this process are percentage icon, dividend icon, portion icon.
Leveraging Logistics Automation Dashboard For Tracking Impact Of Procurement Ideas Pdf
This slide covers the dashboard for analysing procurement performance after automation. It include KPIs such as on time delivery, percentage of returns, compliance index percentage, procurement ROI, cost saving, budget spent on training, etc. Slidegeeks is here to make your presentations a breeze with Leveraging Logistics Automation Dashboard For Tracking Impact Of Procurement Ideas Pdf With our easy to use and customizable templates, you can focus on delivering your ideas rather than worrying about formatting. With a variety of designs to choose from, you are sure to find one that suits your needs. And with animations and unique photos, illustrations, and fonts, you can make your presentation pop. So whether you are giving a sales pitch or presenting to the board, make sure to check out Slidegeeks first. This slide covers the dashboard for analysing procurement performance after automation. It include KPIs such as on time delivery, percentage of returns, compliance index percentage, procurement ROI, cost saving, budget spent on training, etc.
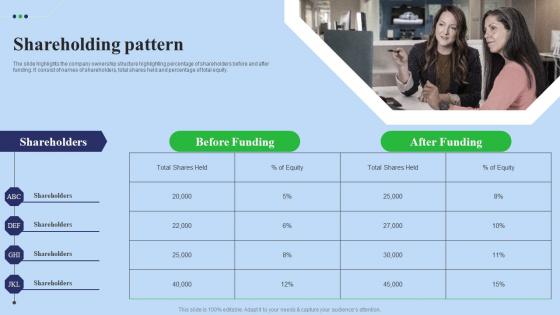
Shareholding Pattern Fundraising Pitch Deck For Digital Software Company Professional Pdf
The slide highlights the company ownership structure highlighting percentage of shareholders before and after funding. It consist of names of shareholders, total shares held and percentage of total equity. Make sure to capture your audiences attention in your business displays with our gratis customizable Shareholding Pattern Fundraising Pitch Deck For Digital Software Company Professional Pdf. These are great for business strategies, office conferences, capital raising or task suggestions. If you desire to acquire more customers for your tech business and ensure they stay satisfied, create your own sales presentation with these plain slides. The slide highlights the company ownership structure highlighting percentage of shareholders before and after funding. It consist of names of shareholders, total shares held and percentage of total equity.

Statistics Highlighting Robotic Process Automation With AI Adoption By Telecom Company Template Pdf
Following slide showcases yearly intelligent automation adoption rate of telecommunication industry for proving 5G services to customers. It includes key elements such as no automation percentage and RPA and AI adoption percentage. Showcasing this set of slides titled Statistics Highlighting Robotic Process Automation With AI Adoption By Telecom Company Template Pdf. The topics addressed in these templates are No Automation, RPA AI Adoption, Key Insights. All the content presented in this PPT design is completely editable. Download it and make adjustments in color, background, font etc. as per your unique business setting. Following slide showcases yearly intelligent automation adoption rate of telecommunication industry for proving 5G services to customers. It includes key elements such as no automation percentage and RPA and AI adoption percentage.
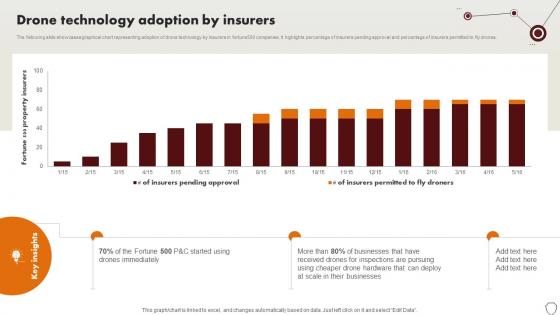
Technology Trends In Online Insurance Drone Technology Adoption By Insurers
The following slide showcases graphical chart representing adoption of drone technology by insurers in fortune500 companies. It highlights percentage of insurers pending approval and percentage of insurers permitted to fly drones. Welcome to our selection of the Technology Trends In Online Insurance Drone Technology Adoption By Insurers. These are designed to help you showcase your creativity and bring your sphere to life. Planning and Innovation are essential for any business that is just starting out. This collection contains the designs that you need for your everyday presentations. All of our PowerPoints are 100Percent editable, so you can customize them to suit your needs. This multi-purpose template can be used in various situations. Grab these presentation templates today. The following slide showcases graphical chart representing adoption of drone technology by insurers in fortune500 companies. It highlights percentage of insurers pending approval and percentage of insurers permitted to fly drones.
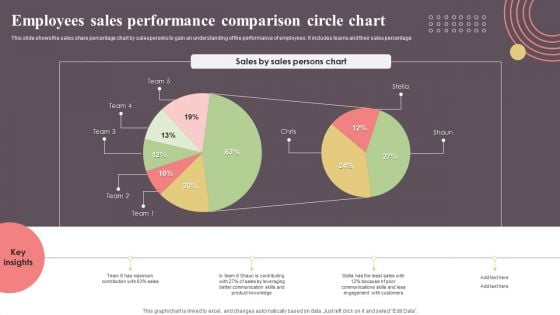
Employees Sales Performance Comparison Circle Chart Topics PDF
This slide shows the sales share percentage chart by salespersons to gain an understanding of the performance of employees. It includes teams and their sales percentage. Pitch your topic with ease and precision using this Employees Sales Performance Comparison Circle Chart Topics PDF. This layout presents information on Employees Sales Performance, Comparison Circle Chart. It is also available for immediate download and adjustment. So, changes can be made in the color, design, graphics or any other component to create a unique layout.
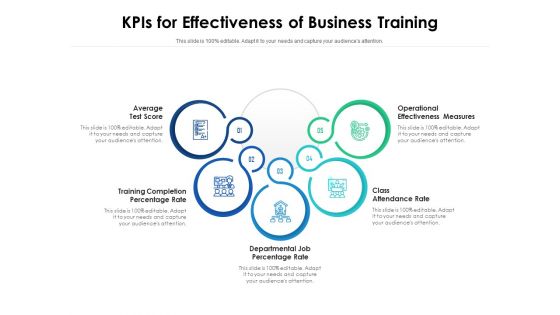
Kpis For Effectiveness Of Business Training Ppt PowerPoint Presentation Ideas Summary PDF
Persuade your audience using this kpis for effectiveness of business training ppt powerpoint presentation ideas summary pdf. This PPT design covers five stages, thus making it a great tool to use. It also caters to a variety of topics including average test score, training completion percentage rate, departmental job percentage rate, class attendance rate, operational effectiveness measures. Download this PPT design now to present a convincing pitch that not only emphasizes the topic but also showcases your presentation skills.
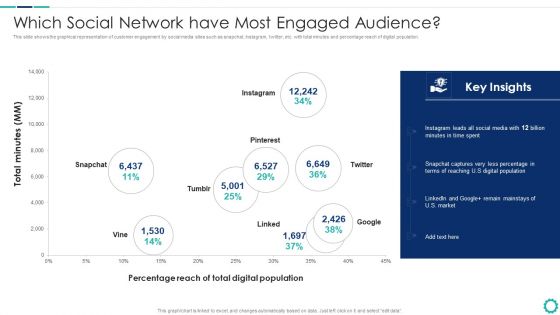
Creating Successful Strategies To Enhance Customer Experience Which Social Network Mockup PDF
This slide shows the graphical representation of customer engagement by social media sites such as snapchat, Instagram, twitter, etc. with total minutes and percentage reach of digital population.Deliver and pitch your topic in the best possible manner with this Creating Successful Strategies To Enhance Customer Experience Which Social Network Mockup PDF Use them to share invaluable insights on Digital Population, Percentage Reach, Digital Population and impress your audience. This template can be altered and modified as per your expectations. So, grab it now.
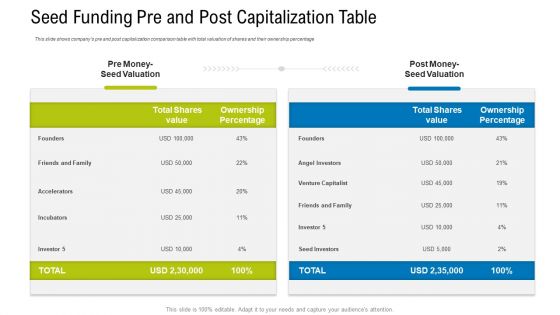
Seed Funding Pre And Post Capitalization Table Ppt Show Templates PDF
This slide shows companys pre and post capitalization comparison table with total valuation of shares and their ownership percentage.Deliver an awe-inspiring pitch with this creative seed funding pre and post capitalization table ppt show templates pdf. bundle. Topics like total shares value, ownership percentage can be discussed with this completely editable template. It is available for immediate download depending on the needs and requirements of the user.
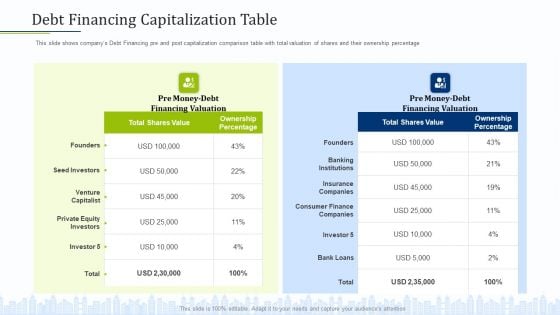
Pitch Deck To Draw External Capital From Commercial Banking Institution Debt Financing Capitalization Table Rules PDF
This slide shows companys Debt Financing pre and post capitalization comparison table with total valuation of shares and their ownership percentage Deliver and pitch your topic in the best possible manner with this pitch deck to draw external capital from commercial banking institution debt financing capitalization table rules pdf. Use them to share invaluable insights on total shares value, ownership percentage, private equity investors and impress your audience. This template can be altered and modified as per your expectations. So, grab it now.


 Continue with Email

 Home
Home


