Percentage Growth
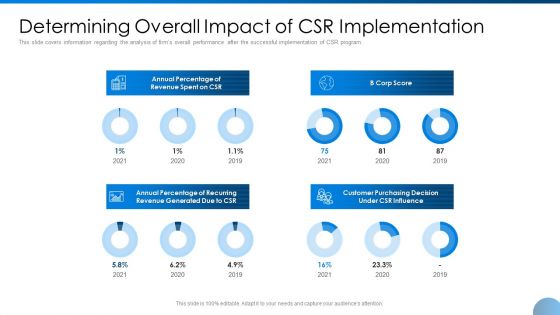
Determining Overall Impact Of CSR Implementation Ppt Pictures Model PDF
This slide covers information regarding the analysis of firms overall performance after the successful implementation of CSR program. Deliver and pitch your topic in the best possible manner with this determining overall impact of csr implementation ppt pictures model pdf. Use them to share invaluable insights on annual percentage of revenue spent on csr, annual percentage of recurring revenue generated due to csr, customer purchasing decision under csr influence, corp score and impress your audience. This template can be altered and modified as per your expectations. So, grab it now.
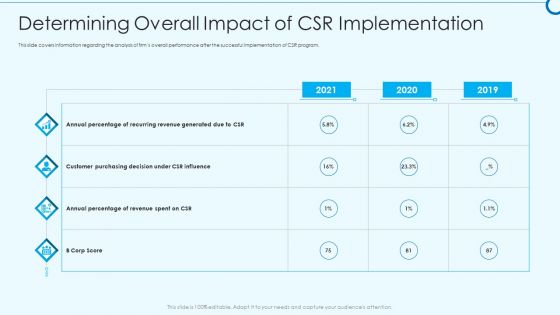
Developing Viable Working Surrounding Determining Overall Impact Of CSR Implementation Demonstration PDF
This slide covers information regarding the analysis of firms overall performance after the successful implementation of CSR program. Deliver an awe inspiring pitch with this creative developing viable working surrounding determining overall impact of csr implementation demonstration pdf bundle. Topics like annual percentage of revenue spent on csr, customer purchasing decision under csr influence, annual percentage of recurring revenue generated due to csrcan be discussed with this completely editable template. It is available for immediate download depending on the needs and requirements of the user.
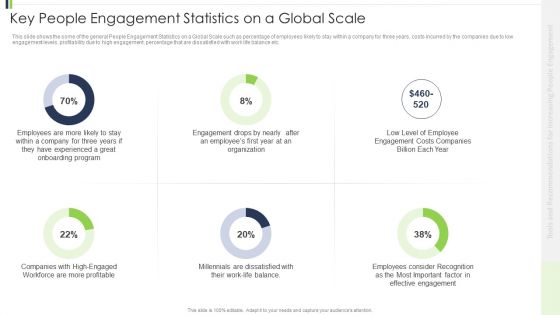
Key People Engagement Statistics On A Global Scale Slides PDF
This slide shows the some of the general People Engagement Statistics on a Global Scale such as percentage of employees likely to stay within a company for three years, costs incurred by the companies due to low engagement levels, profitability due to high engagement, percentage that are dissatisfied with work life balance etc. Deliver an awe inspiring pitch with this creative key people engagement statistics on a global scale slides pdf bundle. Topics like onboarding program, engagement drops by nearly, engagement costs companies billion each can be discussed with this completely editable template. It is available for immediate download depending on the needs and requirements of the user.
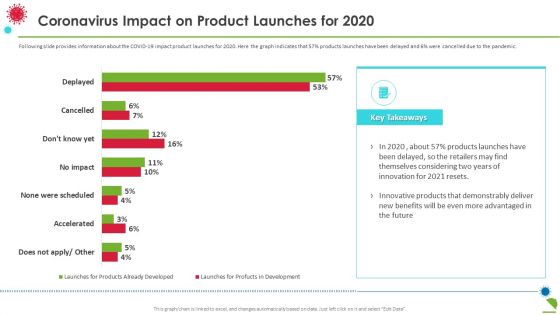
Coronavirus Impact On Product Launches For 2020 Information PDF
Following slide provides information about the COVID 19 impact product launches for 2020. Here the graph indicates that 57 percentage products launches have been delayed and 6 percentage were cancelled due to the pandemic. Deliver and pitch your topic in the best possible manner with this coronavirus impact on product launches for 2020 information pdf. Use them to share invaluable insights on coronavirus impact on product launches for 2020 and impress your audience. This template can be altered and modified as per your expectations. So, grab it now.
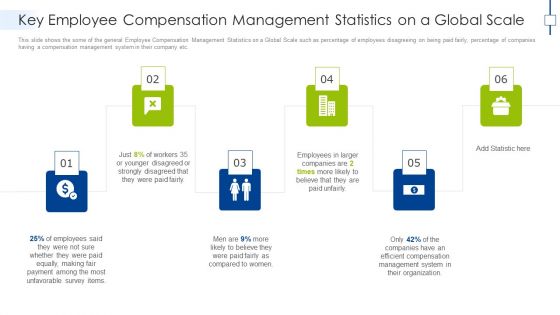
Key Employee Compensation Management Statistics On A Global Scale Graphics PDF
This slide shows the some of the general Employee Compensation Management Statistics on a Global Scale such as percentage of employees disagreeing on being paid fairly, percentage of companies having a compensation management system in their company etc. This is a key employee compensation management statistics on a global scale graphics pdf template with various stages. Focus and dispense information on six stages using this creative set, that comes with editable features. It contains large content boxes to add your information on topics like organization, management, efficient. You can also showcase facts, figures, and other relevant content using this PPT layout. Grab it now.
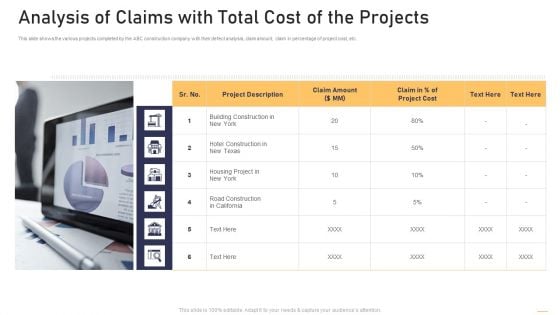
Surge In Construction Faults Lawsuits Case Competition Analysis Of Claims With Total Cost Of The Projects Elements PDF
This slide shows the various projects completed by the ABC construction company with their defect analysis, claim amount, claim in percentage of project cost, etc. This is a surge in construction faults lawsuits case competition analysis of claims with total cost of the projects elements pdf template with various stages. Focus and dispense information on six stages using this creative set, that comes with editable features. It contains large content boxes to add your information on topics like defect analysis, claim amount, claim in percentage of project cost. You can also showcase facts, figures, and other relevant content using this PPT layout. Grab it now.
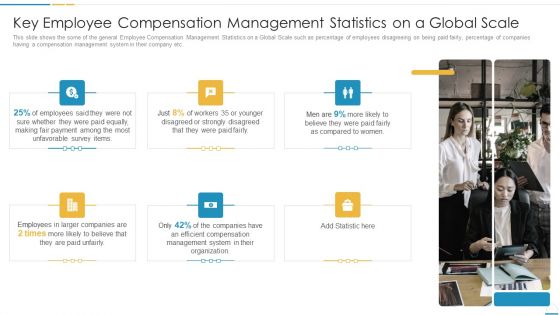
Key Employee Compensation Management Statistics On A Global Scale Designs PDF
This slide shows the some of the general Employee Compensation Management Statistics on a Global Scale such as percentage of employees disagreeing on being paid fairly, percentage of companies having a compensation management system in their company etc. This is a key employee compensation management statistics on a global scale designs pdf template with various stages. Focus and dispense information on six stages using this creative set, that comes with editable features. It contains large content boxes to add your information on topics like payment, management system, organization. You can also showcase facts, figures, and other relevant content using this PPT layout. Grab it now.
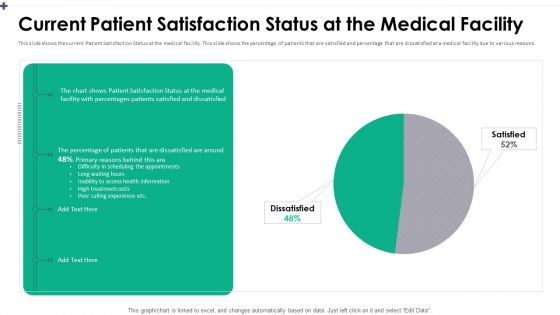
Current Patient Satisfaction Status At The Medical Facility Pictures PDF
This slide shows the current Patient Satisfaction Status at the medical facility. This slide shows the percentage of patients that are satisfied and percentage that are dissatisfied at a medical facility due to various reasons.Deliver an awe inspiring pitch with this creative current patient satisfaction status at the medical facility pictures pdf bundle. Topics like long waiting hours, inability to access, poor calling experience can be discussed with this completely editable template. It is available for immediate download depending on the needs and requirements of the user.
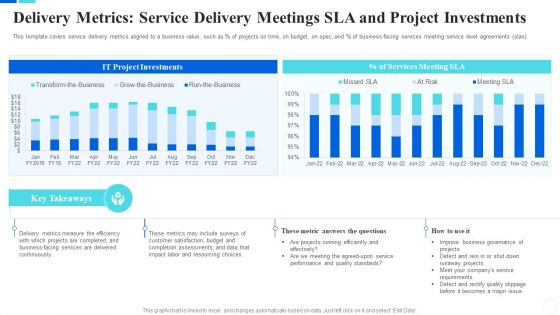
Communicate Company Value To Your Stakeholders Delivery Metrics Service Structure PDF
This template covers service delivery metrics aligned to a business value, such as percentage of projects on time, on budget, on spec, and percentage of business facing services meeting service level agreements slas. Deliver and pitch your topic in the best possible manner with this communicate company value to your stakeholders delivery metrics service structure pdf. Use them to share invaluable insights on project investments, services, metrics, budget, measure and impress your audience. This template can be altered and modified as per your expectations. So, grab it now.
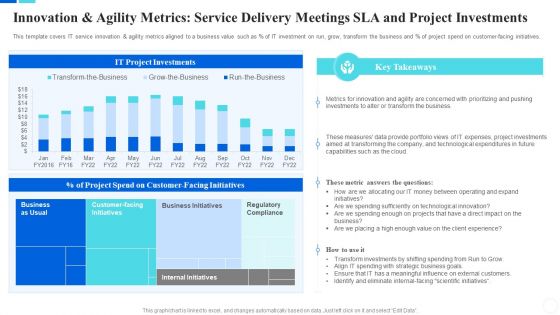
Communicate Company Value To Your Stakeholders Innovation And Agility Metrics Microsoft PDF
This template covers IT service innovation and agility metrics aligned to a business value such as percentage of IT investment on run, grow, transform the business and percentage of project spend on customer facing initiatives. Deliver an awe inspiring pitch with this creative communicate company value to your stakeholders innovation and agility metrics microsoft pdf bundle. Topics like metric, project investments, metrics, business goals can be discussed with this completely editable template. It is available for immediate download depending on the needs and requirements of the user.
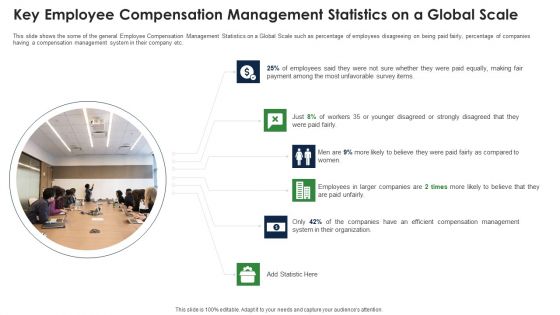
Key Employee Compensation Management Statistics On A Global Scale Topics PDF
This slide shows the some of the general Employee Compensation Management Statistics on a Global Scale such as percentage of employees disagreeing on being paid fairly, percentage of companies having a compensation management system in their company etc. This is a key employee compensation management statistics on a global scale topics pdf template with various stages. Focus and dispense information on six stages using this creative set, that comes with editable features. It contains large content boxes to add your information on topics like employees, organization, efficient, compensation, management, statistic. You can also showcase facts, figures, and other relevant content using this PPT layout. Grab it now.
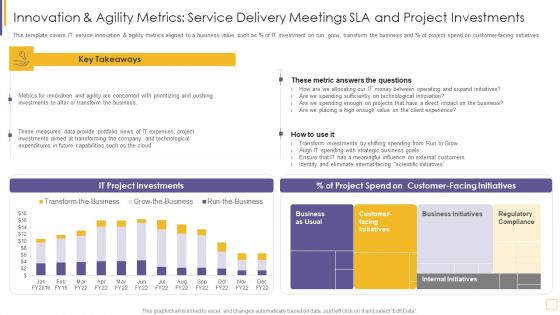
Guidelines For Exhibiting Business Value Of Information And Technology Innovation And Agility Metrics Diagrams PDF
This template covers IT service innovation and agility metrics aligned to a business value such as percentage of IT investment on run, grow, transform the business and percentage of project spend on customer facing initiatives. Deliver an awe inspiring pitch with this creative guidelines for exhibiting business value of information and technology innovation and agility metrics diagrams pdf bundle. Topics like measures, investments, expenses, technological, capabilities can be discussed with this completely editable template. It is available for immediate download depending on the needs and requirements of the user.
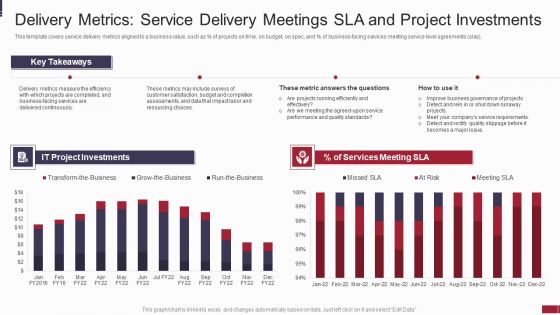
IT Value Story Significant To Corporate Leadership Delivery Metrics Service Delivery Graphics PDF
This template covers service delivery metrics aligned to a business value, such as percentage of projects on time, on budget, on spec, and percentage of business facing services meeting service level agreements slas. Deliver and pitch your topic in the best possible manner with this it value story significant to corporate leadership delivery metrics service delivery graphics pdf. Use them to share invaluable insights on measure, metrics, resourcing, service and impress your audience. This template can be altered and modified as per your expectations. So, grab it now.
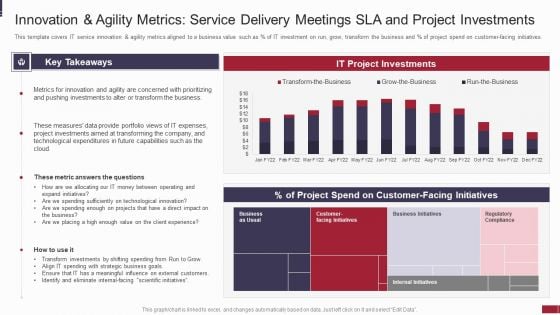
IT Value Story Significant To Corporate Leadership Innovation And Agility Metrics Service Topics PDF
This template covers IT service innovation and agility metrics aligned to a business value such as percentage of IT investment on run, grow, transform the business and percentage of project spend on customer facing initiatives. Deliver an awe inspiring pitch with this creative it value story significant to corporate leadership innovation and agility metrics service topics pdf bundle. Topics like investments, innovation, expenses, measures, technological can be discussed with this completely editable template. It is available for immediate download depending on the needs and requirements of the user.

Customer Mesh Computing IT Problems Faced By The Company Demonstration PDF
This slide describes the problems faced by the company that include the percentage of total spreadsheets, percentage of excel sheets that contains errors and number of managers who dont know about high risk spreadsheets. This is a customer mesh computing it problems faced by the company demonstration pdf template with various stages. Focus and dispense information on three stages using this creative set, that comes with editable features. It contains large content boxes to add your information on topics like problems faced by the company. You can also showcase facts, figures, and other relevant content using this PPT layout. Grab it now.
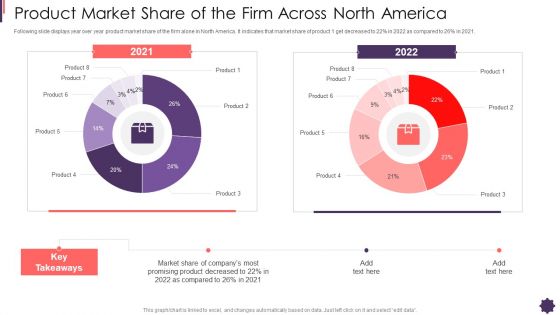
Product Market Share Of The Firm Across North America Brand Techniques Structure Microsoft PDF
Following slide displays year over year product market share of the firm alone in North America. It indicates that market share of product 1 get decreased to 22 percentage in 2022 as compared to 26 percentage in 2021. Deliver an awe inspiring pitch with this creative product market share of the firm across north america brand techniques structure microsoft pdf bundle. Topics like product market share of the firm across north america can be discussed with this completely editable template. It is available for immediate download depending on the needs and requirements of the user.

Retail Trading Platform Deploy Potential Attention Grabbing Offers For Users Ideas PDF
This slide provides information regarding deployment of potential attention grabbing offers for users in terms of percentage off, buy one get one, customized promo codes, in stock availability and quick and free shipping. Presenting retail trading platform deploy potential attention grabbing offers for users ideas pdf to provide visual cues and insights. Share and navigate important information on five stages that need your due attention. This template can be used to pitch topics like percentage off, customized promo codes, stock availability, quick and free shipping. In addtion, this PPT design contains high resolution images, graphics, etc, that are easily editable and available for immediate download.
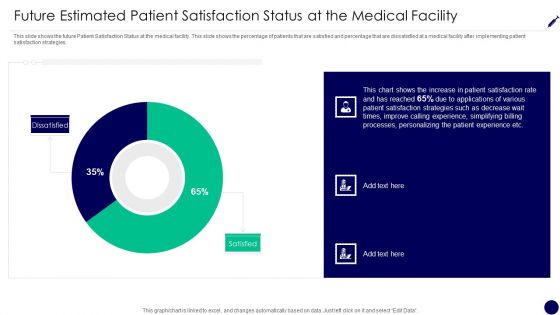
Consumer Retention Techniques Future Estimated Patient Satisfaction Status At The Medical Introduction PDF
This slide shows the future Patient Satisfaction Status at the medical facility. This slide shows the percentage of patients that are satisfied and percentage that are dissatisfied at a medical facility after implementing patient satisfaction strategies. Deliver and pitch your topic in the best possible manner with this consumer retention techniques future estimated patient satisfaction status at the medical introduction pdf. Use them to share invaluable insights on patient satisfaction rate, patient satisfaction strategies, patient experience and impress your audience. This template can be altered and modified as per your expectations. So, grab it now.

Consumer Retention Techniques Key Patient Satisfaction Statistics On A Global Scale Information PDF
This slide shows the some of the general Patient Satisfaction Statistics on a Global Scale such as percentage of patients that value customer service, patients not willing to hold call, percentage of patients who want appointment reminder etc. Deliver an awe inspiring pitch with this creative consumer retention techniques key patient satisfaction statistics on a global scale information pdf bundle. Topics like healthcare institution, customer service, hospital itself can be discussed with this completely editable template. It is available for immediate download depending on the needs and requirements of the user.
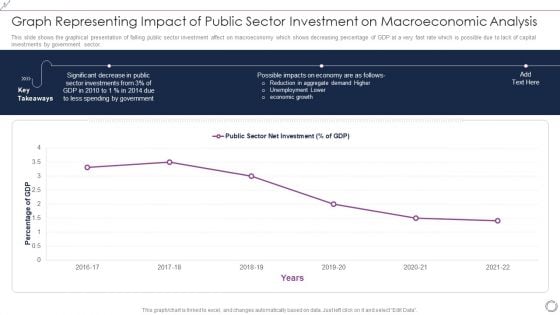
Graph Representing Impact Of Public Sector Investment On Macroeconomic Analysis Themes PDF
This slide shows the graphical presentation of falling public sector investment affect on macroeconomy which shows decreasing percentage of GDP at a very fast rate which is possible due to lack of capital investments by government sector. Showcasing this set of slides titled Graph Representing Impact Of Public Sector Investment On Macroeconomic Analysis Themes PDF. The topics addressed in these templates are Percentage GDP, 2016 to 2022, Public Sector Net Investment. All the content presented in this PPT design is completely editable. Download it and make adjustments in color, background, font etc. as per your unique business setting.

Startup Company Valuation Methodologies Need Of Startup Valuation For A Business Pictures PDF
This slide shows the need related to the startup valuation which includes exchange of cash for a percentage share, overall valuation, etc.Presenting Startup Company Valuation Methodologies Need Of Startup Valuation For A Business Pictures PDF to provide visual cues and insights. Share and navigate important information on four stages that need your due attention. This template can be used to pitch topics like Exchanges Cash For A Percentage, Startup To An Outside Investor, Investment Happens To Decide In addtion, this PPT design contains high resolution images, graphics, etc, that are easily editable and available for immediate download.
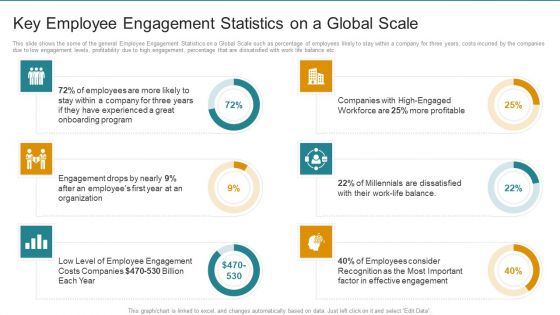
Key Employee Engagement Statistics On A Global Scale Ideas PDF
This slide shows the some of the general Employee Engagement Statistics on a Global Scale such as percentage of employees likely to stay within a company for three years, costs incurred by the companies due to low engagement levels, profitability due to high engagement, percentage that are dissatisfied with work life balance etc. Deliver an awe inspiring pitch with this creative Key Employee Engagement Statistics On A Global Scale Ideas PDF bundle. Topics like Work Life Balance, Effective Engagement, Employee Engagement can be discussed with this completely editable template. It is available for immediate download depending on the needs and requirements of the user.
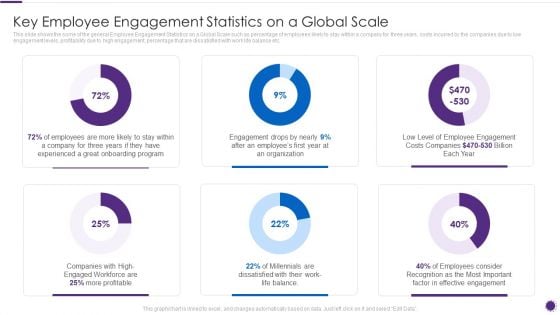
Complete Guide For Total Employee Involvement Strategic Approach Key Employee Engagement Topics PDF
This slide shows the some of the general Employee Engagement Statistics on a Global Scale such as percentage of employees likely to stay within a company for three years, costs incurred by the companies due to low engagement levels, profitability due to high engagement, percentage that are dissatisfied with work life balance etc. Deliver an awe inspiring pitch with this creative Complete Guide For Total Employee Involvement Strategic Approach Key Employee Engagement Topics PDF bundle. Topics like Engagement Drops, Employee Engagement, Employees Consider can be discussed with this completely editable template. It is available for immediate download depending on the needs and requirements of the user.
Automating Supply Chain Dashboard For Tracking Impact Of Procurement Process Automation Themes PDF
This slide covers the dashboard for analysing procurement performance after automation. It include KPIs such as on-time delivery, percentage of returns, compliance index percentage, procurement ROI, cost-saving, budget spent on training, etc. Deliver an awe inspiring pitch with this creative Automating Supply Chain Dashboard For Tracking Impact Of Procurement Process Automation Themes PDF bundle. Topics like Procurement ROI, Cost Saving, Perform Procurement can be discussed with this completely editable template. It is available for immediate download depending on the needs and requirements of the user.
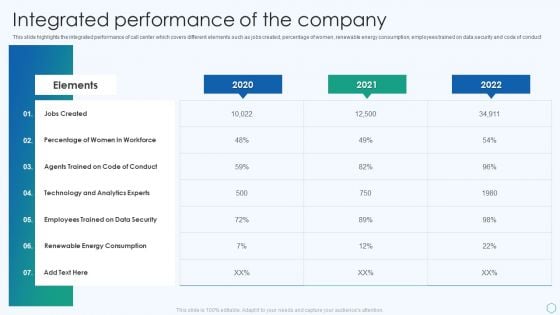
Inbound And Outbound Services Business Profile Integrated Performance Of The Company Brochure PDF
This slide highlights the integrated performance of call center which covers different elements such as jobs created, percentage of women, renewable energy consumption, employees trained on data security and code of conduct.Deliver an awe inspiring pitch with this creative Inbound And Outbound Services Business Profile Integrated Performance Of The Company Brochure PDF bundle. Topics like Percentage Of Women, Agents Trained, Technology And Analytics can be discussed with this completely editable template. It is available for immediate download depending on the needs and requirements of the user.
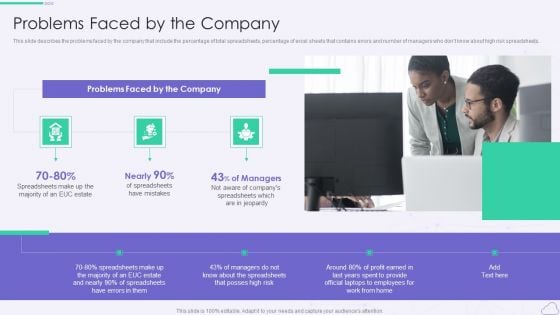
VID Problems Faced By The Company Professional PDF
This slide describes the problems faced by the company that include the percentage of total spreadsheets, percentage of excel sheets that contains errors and number of managers who dont know about high risk spreadsheets.Presenting VID Problems Faced By The Company Professional PDF to provide visual cues and insights. Share and navigate important information on one stage that need your due attention. This template can be used to pitch topics like Problems Faced, Spreadsheets Make, Jeopardy. In addtion, this PPT design contains high resolution images, graphics, etc, that are easily editable and available for immediate download.
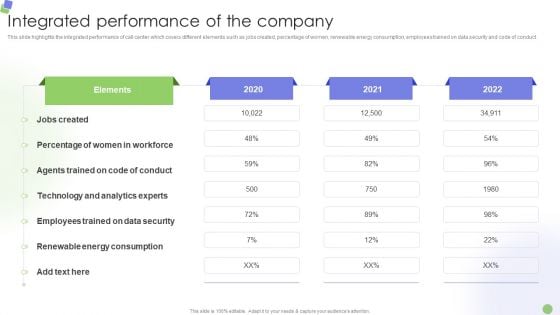
Knowledge Process Outsourcing Company Profile Integrated Performance Of The Company Clipart PDF
This slide highlights the integrated performance of call center which covers different elements such as jobs created, percentage of women, renewable energy consumption, employees trained on data security and code of conduct.Deliver an awe inspiring pitch with this creative Knowledge Process Outsourcing Company Profile Integrated Performance Of The Company Clipart PDF bundle. Topics like Percentage Of Women, Agents Trained, Technology And Analytics can be discussed with this completely editable template. It is available for immediate download depending on the needs and requirements of the user.
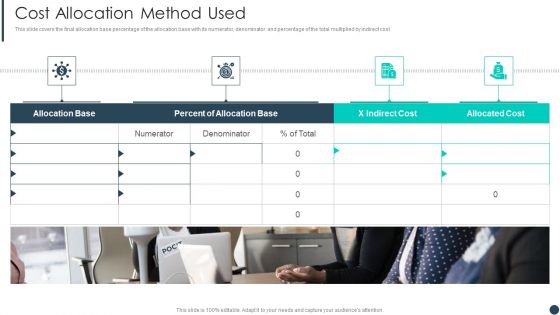
Cost Allotment Technique Cost Allocation Method Used Infographics PDF
This slide covers the final allocation base percentage of the allocation base with its numerator, denominator and percentage of the total multiplied by indirect cost.Presenting Cost Allotment Technique Cost Allocation Method Used Infographics PDF to provide visual cues and insights. Share and navigate important information on one stage that need your due attention. This template can be used to pitch topics like Allocation Base, Allocated Cost, Allocation Base. In addtion, this PPT design contains high resolution images, graphics, etc, that are easily editable and available for immediate download.
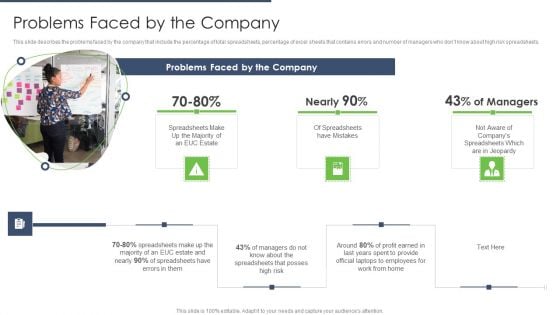
End User Computing Problems Faced By The Company Template PDF
This slide describes the problems faced by the company that include the percentage of total spreadsheets, percentage of excel sheets that contains errors and number of managers who dont know about high risk spreadsheets.Presenting End User Computing Problems Faced By The Company Template PDF to provide visual cues and insights. Share and navigate important information on one stage that need your due attention. This template can be used to pitch topics like Official Laptops, Spreadsheets Posses, Problems Faced. In addtion, this PPT design contains high resolution images, graphics, etc, that are easily editable and available for immediate download.
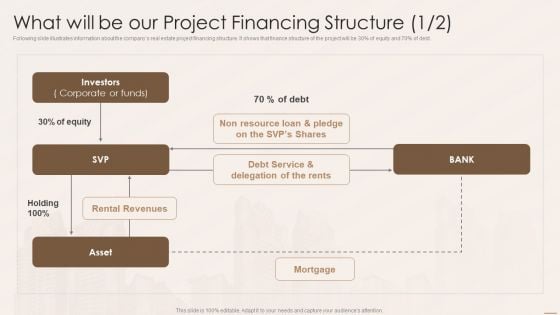
Real Estate Developers Funding Alternatives What Will Be Our Project Financing Structure Rules PDF
Following slide illustrates information about the companys real estate project financing structure. It shows that finance structure of the project will be 30 percentage of equity and 70 percentage of debt. Deliver and pitch your topic in the best possible manner with this Real Estate Developers Funding Alternatives What Will Be Our Project Financing Structure Rules PDF. Use them to share invaluable insights on Investors, Debt Service, Resource Loan and impress your audience. This template can be altered and modified as per your expectations. So, grab it now.
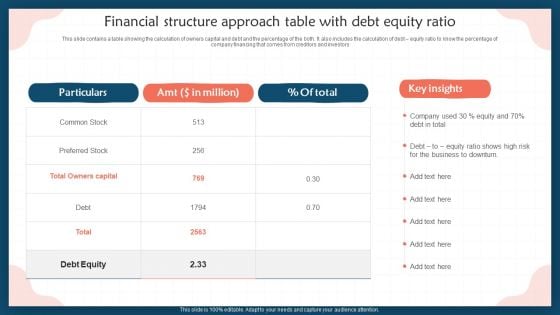
Financial Structure Approach Table With Debt Equity Ratio Professional PDF
This slide contains a table showing the calculation of owners capital and debt and the percentage of the both. It also includes the calculation of debt equity ratio to know the percentage of company financing that comes from creditors and investors. Showcasing this set of slides titled Financial Structure Approach Table With Debt Equity Ratio Professional PDF. The topics addressed in these templates are Preferred Stock, Debt, Debt Equity. All the content presented in this PPT design is completely editable. Download it and make adjustments in color, background, font etc. as per your unique business setting.
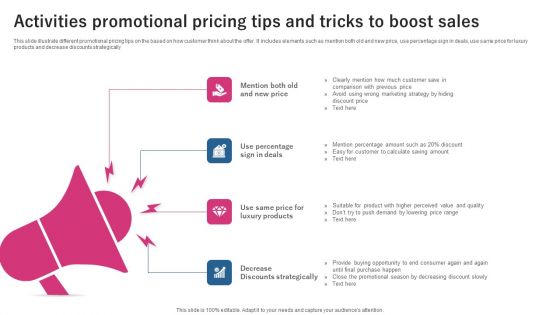
Activities Promotional Pricing Tips And Tricks To Boost Sales Ppt Gallery Example File PDF
This slide illustrate different promotional pricing tips on the based on how customer think about the offer. It includes elements such as mention both old and new price, use percentage sign in deals, use same price for luxury products and decrease discounts strategically. Presenting Activities Promotional Pricing Tips And Tricks To Boost Sales Ppt Gallery Example File PDF to dispense important information. This template comprises four stages. It also presents valuable insights into the topics including Mention Both Old, New Price, Use Percentage, Sign Deals. This is a completely customizable PowerPoint theme that can be put to use immediately. So, download it and address the topic impactfully.
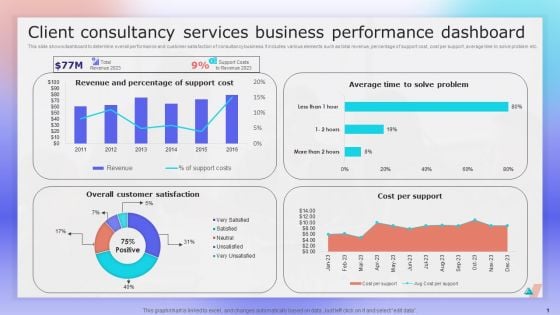
Client Consultancy Services Business Performance Dashboard Ppt File Layout PDF
This slide shows dashboard to determine overall performance and customer satisfaction of consultancy business. It includes various elements such as total revenue, percentage of support cost, cost per support, average time to solve problem etc. Showcasing this set of slides titled Client Consultancy Services Business Performance Dashboard Ppt File Layout PDF. The topics addressed in these templates are Revenue And Percentage, Support Cost, Cost Per Support. All the content presented in this PPT design is completely editable. Download it and make adjustments in color, background, font etc. as per your unique business setting.
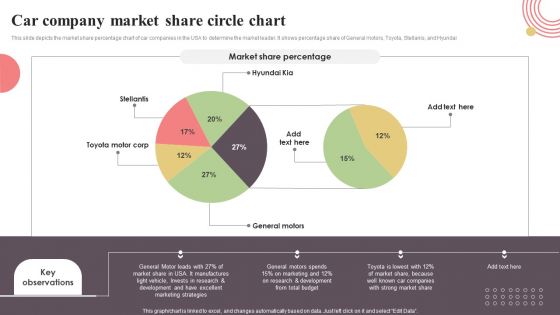
Car Company Market Share Circle Chart Slides PDF
This slide depicts the market share percentage chart of car companies in the USA to determine the market leader. It shows percentage share of General motors, Toyota, Stellanis, and Hyundai. Showcasing this set of slides titled Car Company Market Share Circle Chart Slides PDF. The topics addressed in these templates are Car Company Market, Share Circle Chart. All the content presented in this PPT design is completely editable. Download it and make adjustments in color, background, font etc. as per your unique business setting.
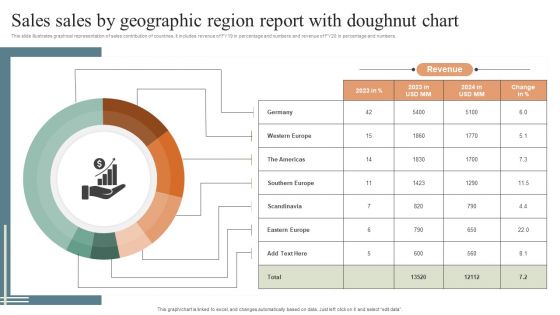
Sales Sales By Geographic Region Report With Doughnut Chart Themes PDF
This slide illustrates graphical representation of sales contribution of countries. It includes revenue of FY19 in percentage and numbers and revenue of FY20 in percentage and numbers. Showcasing this set of slides titled Sales Sales By Geographic Region Report With Doughnut Chart Themes PDF. The topics addressed in these templates are Revenue, Doughnut Chart, Geographic Region Report. All the content presented in this PPT design is completely editable. Download it and make adjustments in color, background, font etc. as per your unique business setting.
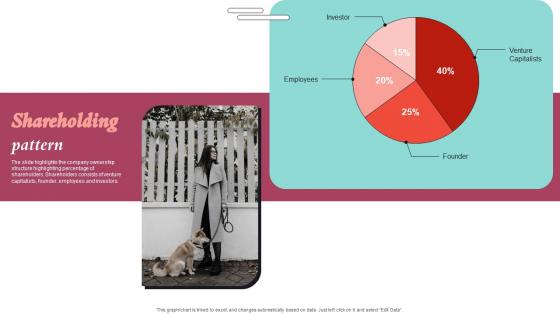
Shareholding Pattern Pet Care Company Investor Funding Elevator Pitch Deck Infographics Pdf
The slide highlights the company ownership structure highlighting percentage of shareholders. Shareholders consists of venture capitalists, founder, employees and investors. Make sure to capture your audiences attention in your business displays with our gratis customizable Shareholding Pattern Pet Care Company Investor Funding Elevator Pitch Deck Infographics Pdf. These are great for business strategies, office conferences, capital raising or task suggestions. If you desire to acquire more customers for your tech business and ensure they stay satisfied, create your own sales presentation with these plain slides. The slide highlights the company ownership structure highlighting percentage of shareholders. Shareholders consists of venture capitalists, founder, employees and investors.
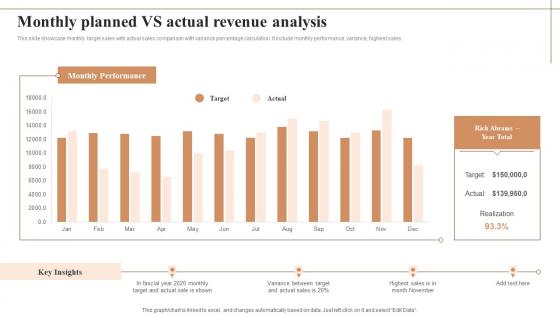
Monthly Planned Vs Actual Revenue Analysis Professional Pdf
This slide showcase monthly target sales with actual sales comparison with variance percentage calculation. It include monthly performance, variance, highest sales. Showcasing this set of slides titled Monthly Planned Vs Actual Revenue Analysis Professional Pdf The topics addressed in these templates are Monthly Planned, Actual Revenue Analysis All the content presented in this PPT design is completely editable. Download it and make adjustments in color, background, font etc. as per your unique business setting. This slide showcase monthly target sales with actual sales comparison with variance percentage calculation. It include monthly performance, variance, highest sales.
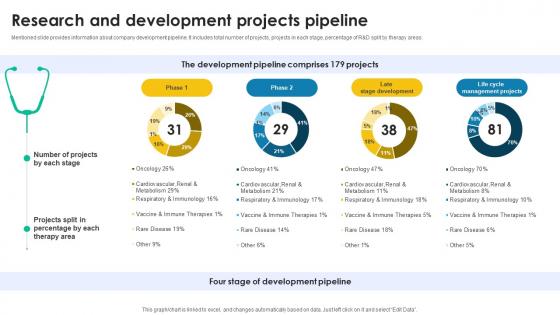
Research And Development Projects Pipeline Medical Research And Development Company Profile CP SS V
Mentioned slide provides information about company development pipeline. It includes total number of projects, projects in each stage, percentage of RandD split by therapy areas. Find a pre-designed and impeccable Research And Development Projects Pipeline Medical Research And Development Company Profile CP SS V. The templates can ace your presentation without additional effort. You can download these easy-to-edit presentation templates to make your presentation stand out from others. So, what are you waiting for Download the template from Slidegeeks today and give a unique touch to your presentation. Mentioned slide provides information about company development pipeline. It includes total number of projects, projects in each stage, percentage of RandD split by therapy areas.
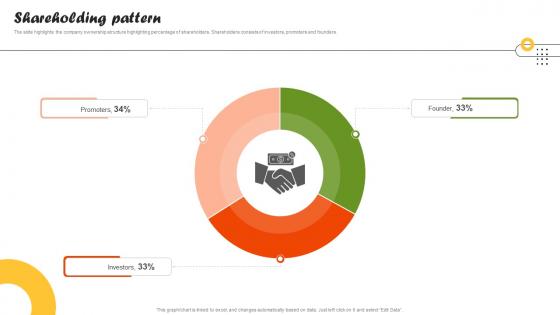
Shareholding Pattern On Demand Food Delivery Platform Investor Funding Elevator Pitch Deck
The slide highlights the company ownership structure highlighting percentage of shareholders. Shareholders consists of investors, promoters and founders. Find a pre-designed and impeccable Shareholding Pattern On Demand Food Delivery Platform Investor Funding Elevator Pitch Deck. The templates can ace your presentation without additional effort. You can download these easy-to-edit presentation templates to make your presentation stand out from others. So, what are you waiting for Download the template from Slidegeeks today and give a unique touch to your presentation. The slide highlights the company ownership structure highlighting percentage of shareholders. Shareholders consists of investors, promoters and founders.

Top Shareholders Enterprise Software Solution Providing Company Profile CP SS V
Following slide provides information about company top shareholders. It includes shareholders names, numbers of shares held, and percentage of ordinary shares held.Make sure to capture your audiences attention in your business displays with our gratis customizable Top Shareholders Enterprise Software Solution Providing Company Profile CP SS V. These are great for business strategies, office conferences, capital raising or task suggestions. If you desire to acquire more customers for your tech business and ensure they stay satisfied, create your own sales presentation with these plain slides. Following slide provides information about company top shareholders. It includes shareholders names, numbers of shares held, and percentage of ordinary shares held.

Balance Portfolio Funding Allocation Graph Investment Fund PPT Presentation
Mentioned slide provides information about balance options for funding allocation.It includes funding allocation graph, various investment avenues, percentage of funding allocation, and asset classes. There are so many reasons you need a Balance Portfolio Funding Allocation Graph Investment Fund PPT Presentation. The first reason is you can not spend time making everything from scratch, Thus, Slidegeeks has made presentation templates for you too. You can easily download these templates from our website easily. Mentioned slide provides information about balance options for funding allocation.It includes funding allocation graph, various investment avenues, percentage of funding allocation, and asset classes.
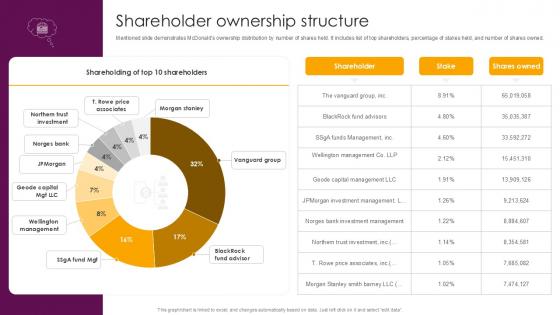
Shareholder Ownership Structure Food And Beverages Company Profile Ppt Example CP SS V
Mentioned slide demonstrates McDonalds ownership distribution by number of shares held. It includes list of top shareholders, percentage of stakes held, and number of shares owned. There are so many reasons you need a Shareholder Ownership Structure Food And Beverages Company Profile Ppt Example CP SS V The first reason is you can not spend time making everything from scratch, Thus, Slidegeeks has made presentation templates for you too. You can easily download these templates from our website easily. Mentioned slide demonstrates McDonalds ownership distribution by number of shares held. It includes list of top shareholders, percentage of stakes held, and number of shares owned.
Scatter Chart Ppt PowerPoint Presentation Icon Elements
This is a scatter chart ppt powerpoint presentation icon elements. This is a nine stage process. The stages in this process are dollar in billions, sales in percentage, business, success.
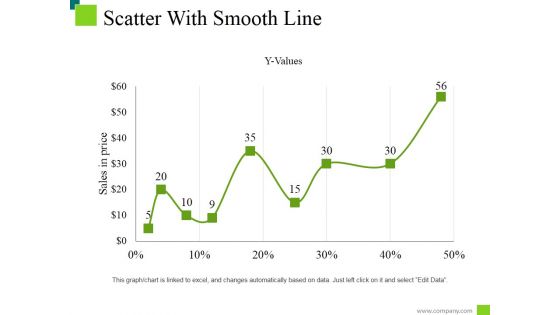
Scatter With Smooth Line Ppt PowerPoint Presentation Professional Display
This is a scatter with smooth line ppt powerpoint presentation professional display. This is a nine stage process. The stages in this process are sale price, business, marketing, percentage, finance.
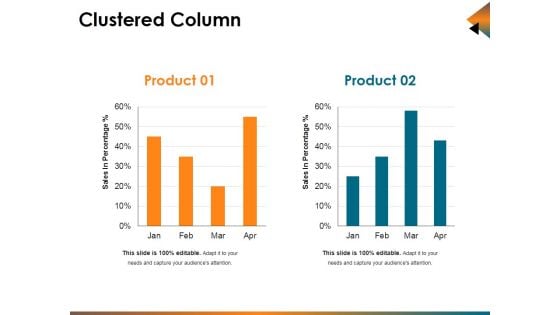
Clustered Column Ppt PowerPoint Presentation Infographic Template Background Designs
This is a clustered column ppt powerpoint presentation infographic template background designs. This is a two stage process. The stages in this process are sales in percentage, bar, business, marketing, planning.
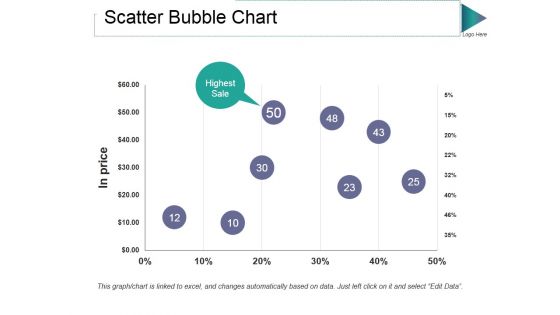
Scatter Bubble Chart Ppt PowerPoint Presentation Gallery Guidelines
This is a scatter bubble chart ppt powerpoint presentation gallery guidelines. This is a one stage process. The stages in this process are in price, highest sale, percentage, finance, business.
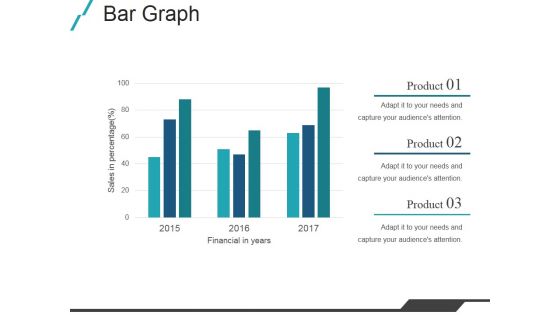
Bar Graph Ppt PowerPoint Presentation Slides Deck
This is a bar graph ppt powerpoint presentation slides deck. This is a three stage process. The stages in this process are financial in years, product, sales in percentage.
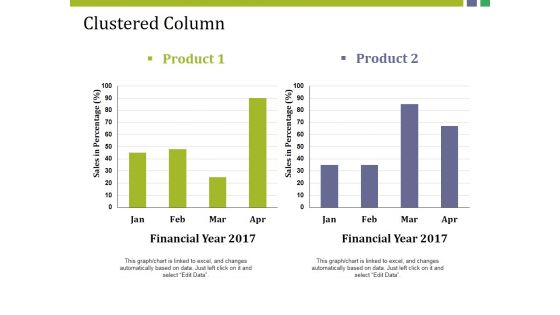
Clustered Column Ppt PowerPoint Presentation Gallery Structure
This is a clustered column ppt powerpoint presentation gallery structure. This is a two stage process. The stages in this process are product, sales in percentage, financial year, bar graph, finance.
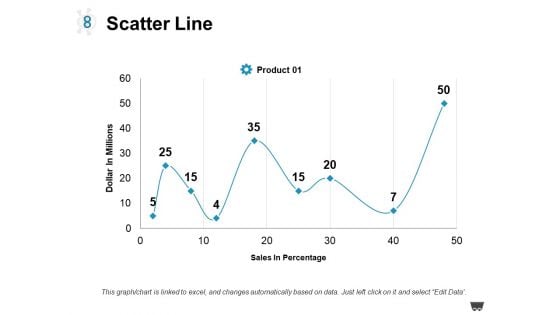
Scatter Line Ppt PowerPoint Presentation Styles Graphics Pictures
This is a scatter line ppt powerpoint presentation styles graphics pictures. This is a one stage process. The stages in this process are product, dollar in millions, sales in percentage.
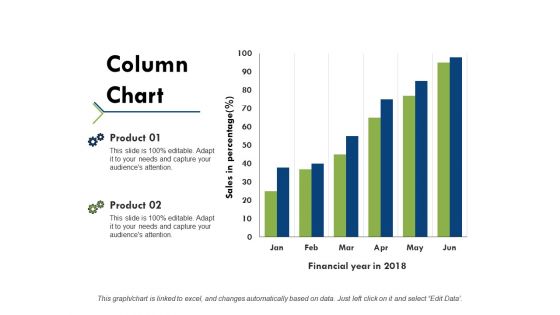
Column Chart Ppt PowerPoint Presentation Portfolio Example Topics
This is a column chart ppt powerpoint presentation portfolio example topics. This is a two stage process. The stages in this process are product, financial year, sales in percentage, column chart.
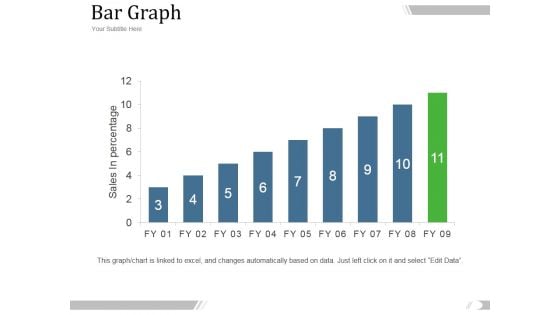
Bar Graph Ppt PowerPoint Presentation Introduction
This is a bar graph ppt powerpoint presentation introduction. This is a eleven stage process. The stages in this process are management, marketing, business, fy, graph, sales in percentage.
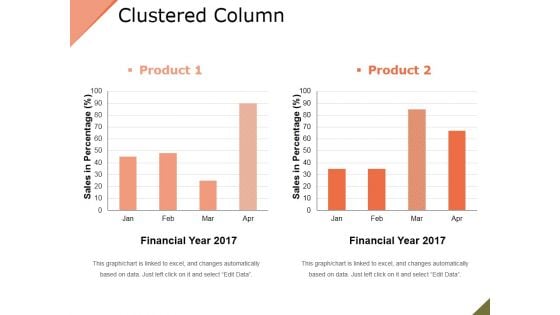
Clustered Column Ppt PowerPoint Presentation File Slide
This is a clustered column ppt powerpoint presentation file slide. This is a two stage process. The stages in this process are product, financial year, sales in percentage, bar graph.
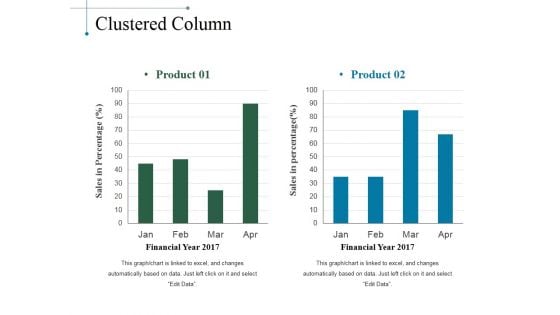
Clustered Column Ppt PowerPoint Presentation Slides Smartart
This is a clustered column ppt powerpoint presentation slides smartart. This is a two stage process. The stages in this process are product, sales in percentage, financial year, bar graph.
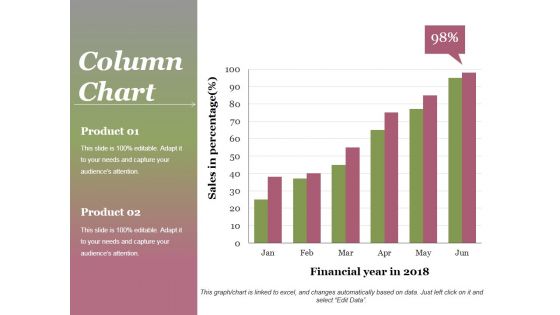
Column Chart Ppt PowerPoint Presentation Gallery Background
This is a column chart ppt powerpoint presentation gallery background. This is a two stage process. The stages in this process are product, sales in percentage, financial year, graph, success.
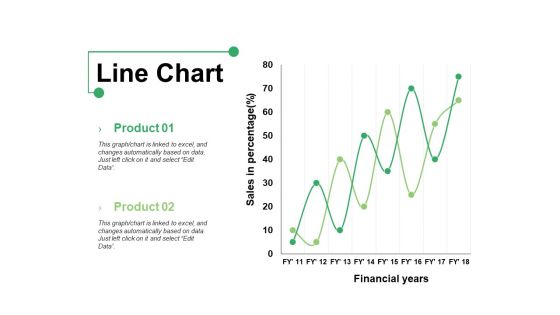
Line Chart Ppt PowerPoint Presentation Show Graphics Example
This is a line chart ppt powerpoint presentation show graphics example. This is a two stage process. The stages in this process are product, line chart, financial years, sales in percentage.
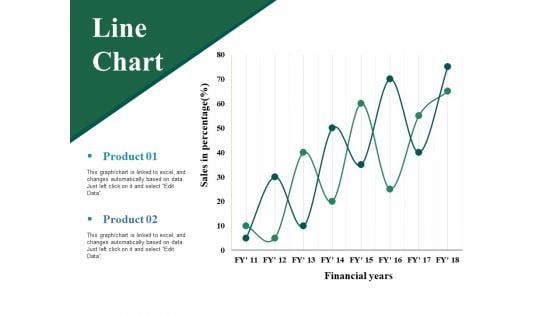
Line Chart Ppt PowerPoint Presentation Professional Grid
This is a line chart ppt powerpoint presentation professional grid. This is a two stage process. The stages in this process are sales in percentage, financial years, product, line chart.
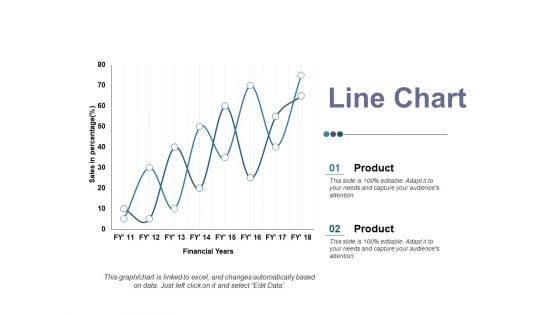
Line Chart Ppt PowerPoint Presentation Ideas Elements
This is a line chart ppt powerpoint presentation ideas elements. This is a two stage process. The stages in this process are product, sales in percentage, financial year, business, line chart.
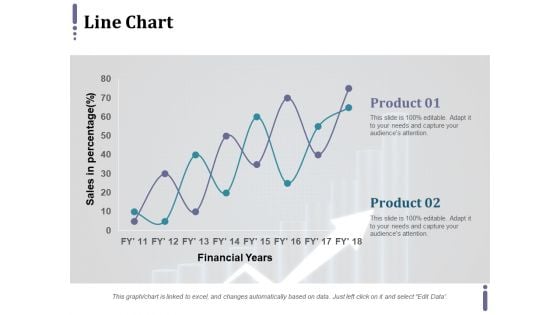
Line Chart Ppt PowerPoint Presentation Infographic Template Master Slide
This is a line chart ppt powerpoint presentation infographic template master slide. This is a two stage process. The stages in this process are product, financial years, sales in percentage.

Clustered Column Ppt PowerPoint Presentation Infographic Template Backgrounds
This is a clustered column ppt powerpoint presentation infographic template backgrounds. This is a two stage process. The stages in this process are sales in percentage, financial year, product.
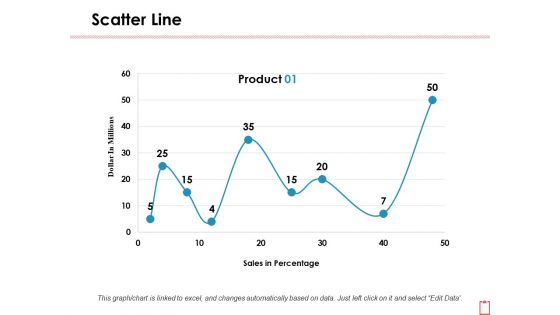
Scatter Line Ppt PowerPoint Presentation Infographics Background Images
This is a scatter line ppt powerpoint presentation infographics background images. This is a one stage process. The stages in this process are dollar in millions, product, sales in percentage.


 Continue with Email

 Home
Home


