Percentage
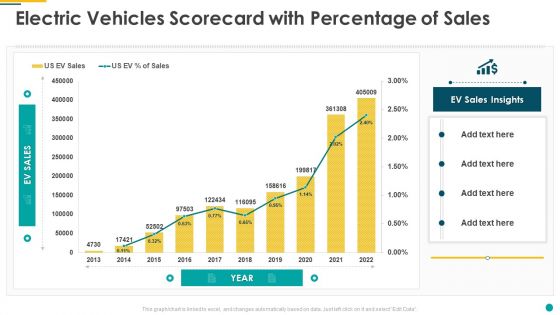
Electric Vehicles Scorecard With Percentage Of Sales Mockup PDF
Deliver and pitch your topic in the best possible manner with this electric vehicles scorecard with percentage of sales mockup pdf. Use them to share invaluable insights on electric vehicles scorecard with percentage of sales and impress your audience. This template can be altered and modified as per your expectations. So, grab it now.

Staffing Dashboard Showing Employees Salary Percentage Information PDF
Showcasing this set of slides titled Staffing Dashboard Showing Employees Salary Percentage Information PDF The topics addressed in these templates are Staffing Dashboard, Showing Employees, Salary Percentage All the content presented in this PPT design is completely editable. Download it and make adjustments in color, background, font etc. as per your unique business setting.
Survey Results Format Icon With Percentage Ppt Outline Icon PDF
Presenting Survey Results Format Icon With Percentage Ppt Outline Icon PDF to dispense important information. This template comprises three stages. It also presents valuable insights into the topics including Survey Results, Format Icon, Percentage. This is a completely customizable PowerPoint theme that can be put to use immediately. So, download it and address the topic impactfully.

Directors Discussing About Targeted Enterprise Profit Percentage Sample PDF
Presenting Directors Discussing About Targeted Enterprise Profit Percentage Sample PDF to dispense important information. This template comprises Three stages. It also presents valuable insights into the topics including Directors Discussing About Targeted, Enterprise Profit Percentage. This is a completely customizable PowerPoint theme that can be put to use immediately. So, download it and address the topic impactfully.
Customer Satisfaction Survey Outcome Percentage Icon Topics PDF
Showcasing this set of slides titled Customer Satisfaction Survey Outcome Percentage Icon Topics PDF. The topics addressed in these templates are Customer Satisfaction, Survey Outcome, Percentage Icon. All the content presented in this PPT design is completely editable. Download it and make adjustments in color, background, font etc. as per your unique business setting.
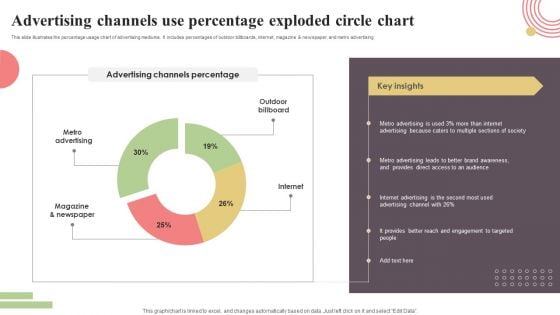
Advertising Channels Use Percentage Exploded Circle Chart Sample PDF
This slide illustrates the percentage usage chart of advertising mediums. It includes percentages of outdoor billboards, internet, magazine and newspaper, and metro advertising. Showcasing this set of slides titled Advertising Channels Use Percentage Exploded Circle Chart Sample PDF. The topics addressed in these templates are Metro Advertising, Magazine And Newspaper, Internet, Outdoor, Billboard. All the content presented in this PPT design is completely editable. Download it and make adjustments in color, background, font etc. as per your unique business setting.
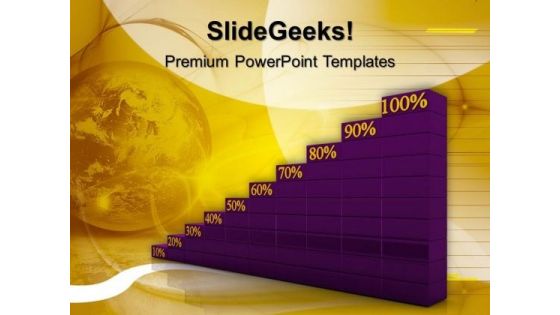
Percentage Graph Progress Business PowerPoint Templates And PowerPoint Themes 1012
Percentage Graph Progress Business PowerPoint Templates And PowerPoint Themes 1012-Using This Beautiful PowerPoint Template you will be able to illustrate the Growth, Progress, development, advancement, improvement, evolution, headway, steps forward, movement, evolvement etc. Our template will help pinpoint their viability. Refine them all as you take them through the numerous filtering stages of the funnel of your quality control process.-Percentage Graph Progress Business PowerPoint Templates And PowerPoint Themes 1012-This PowerPoint template can be used for presentations relating to-Graph Percent Going Up, Success, Business, Finance, Marketing, Money Your address will be the feature. Our Percentage Graph Progress Business PowerPoint Templates And PowerPoint Themes 1012 will ensure the cheers.
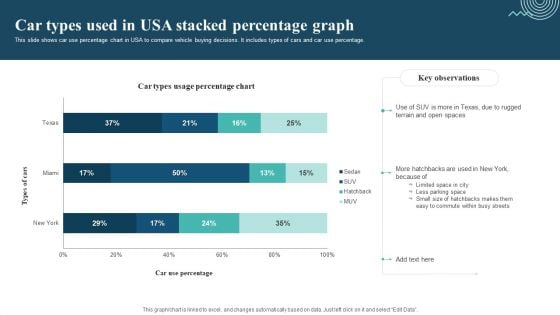
Car Types Used In Usa Stacked Percentage Graph Sample PDF
This slide shows car use percentage chart in USA to compare vehicle buying decisions. It includes types of cars and car use percentage. Pitch your topic with ease and precision using this Car Types Used In Usa Stacked Percentage Graph Sample PDF. This layout presents information on Limited Space In City, Less Parking Space, Easy To Commute. It is also available for immediate download and adjustment. So, changes can be made in the color, design, graphics or any other component to create a unique layout.
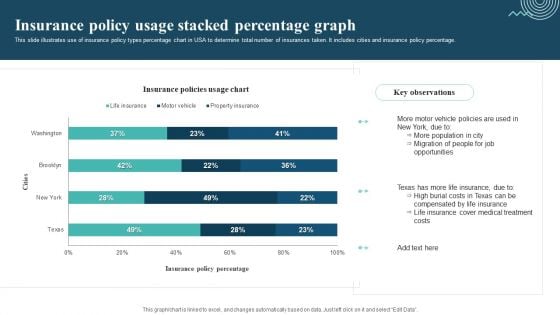
Insurance Policy Usage Stacked Percentage Graph Template PDF
This slide illustrates use of insurance policy types percentage chart in USA to determine total number of insurances taken. It includes cities and insurance policy percentage. Pitch your topic with ease and precision using this Insurance Policy Usage Stacked Percentage Graph Template PDF. This layout presents information on Motor Vehicle Policies, More Population, Migration Of People. It is also available for immediate download and adjustment. So, changes can be made in the color, design, graphics or any other component to create a unique layout.
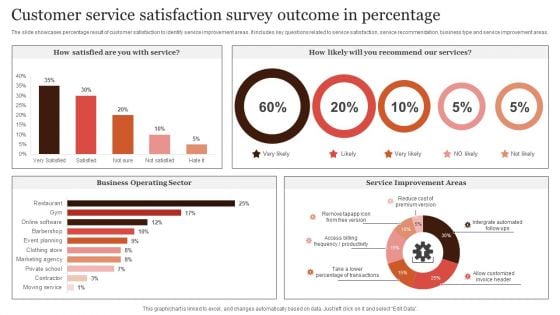
Customer Service Satisfaction Survey Outcome In Percentage Microsoft PDF
The slide showcases percentage result of customer satisfaction to identify service improvement areas. It includes key questions related to service satisfaction, service recommendation, business type and service improvement areas. Pitch your topic with ease and precision using this Customer Service Satisfaction Survey Outcome In Percentage Microsoft PDF. This layout presents information on Customer Service, Satisfaction Survey, Outcome In Percentage. It is also available for immediate download and adjustment. So, changes can be made in the color, design, graphics or any other component to create a unique layout.
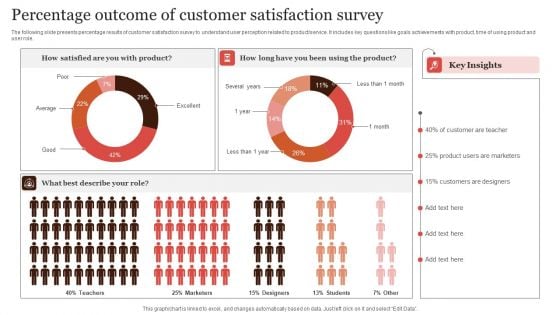
Percentage Outcome Of Customer Satisfaction Survey Infographics PDF
The following slide presents percentage results of customer satisfaction survey to understand user perception related to product or service. It includes key questions like goals achievements with product, time of using product and user role. Pitch your topic with ease and precision using this Percentage Outcome Of Customer Satisfaction Survey Infographics PDF. This layout presents information on Percentage Outcome, Customer Satisfaction Survey. It is also available for immediate download and adjustment. So, changes can be made in the color, design, graphics or any other component to create a unique layout.
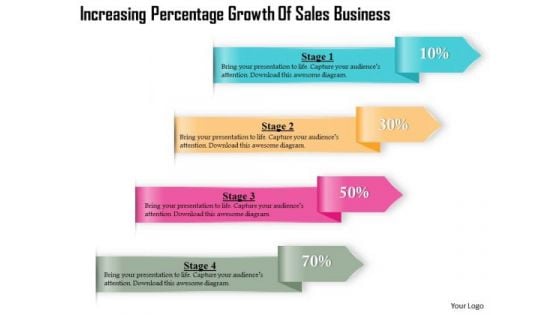
Consulting Slides Increasing Percentage Growth Of Sales Business Presentation
This diagram is designed with graphics of text boxes showing percentage growth. Use this diagram in presentations to display growth in sales or profit. This diagram is editable and can be easily adjusted.
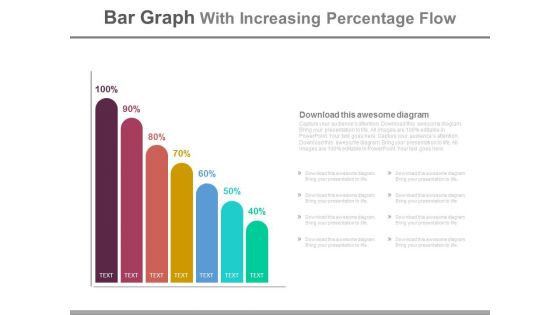
Bar Graph With Increasing Percentage Flow Powerpoint Slides
This PowerPoint slide has been designed with bar graph and increasing percentage values. This diagram slide may be used to display profit growth. Prove the viability of your ideas with this professional slide.
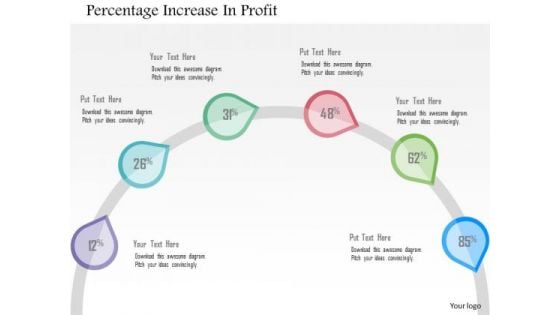
Business Diagram Percentage Increase In Profit Presentation Template
This business slide has been designed with semi circle line displaying percentage increase in business profit. Download this diagram for business and finance related topics. Deliver amazing presentations to mesmerize your audience.
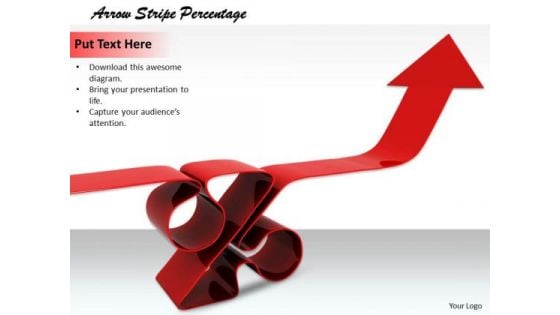
Stock Photo Red Growth Arrow With Percentage Symbol PowerPoint Slide
This image has been designed with red growth arrow with percentage symbol. This Image clearly relates to concept of financial growth. Use our image to drive the point to your audience and constantly attract their attention.
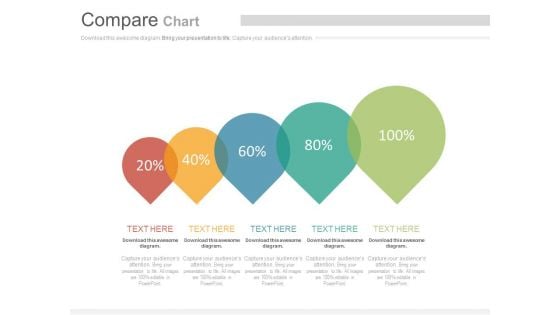
Balloons Steps With Percentage Growth Values Powerpoint Slides
This PowerPoint template contains graphics of balloons steps with percentage growth values. You may download this slide to display strategy steps for financial growth. You can easily customize this template to make it more unique as per your need.
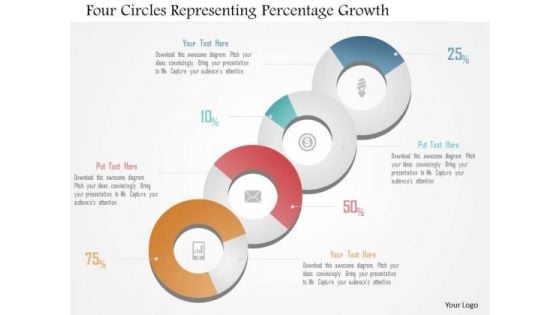
Business Diagram Four Circles Representing Percentage Growth Presentation Template
Our above slide displays four circles representing percentage growth. It helps to depict workflow or a process. This diagram offers a way for your audience to visually conceptualize the process.
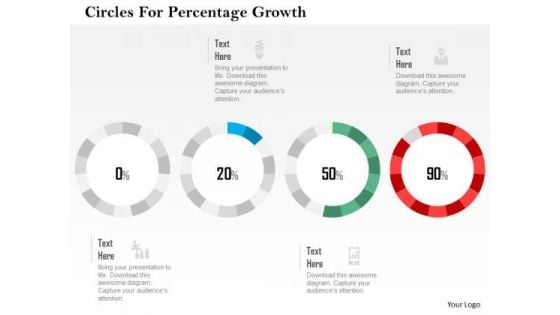
Business Diagram Circles For Percentage Growth Presentation Template
This business slide has been designed with graphics of circles. You may download this diagram to display percentage growth data. This template is innovatively designed to highlight your worthy views
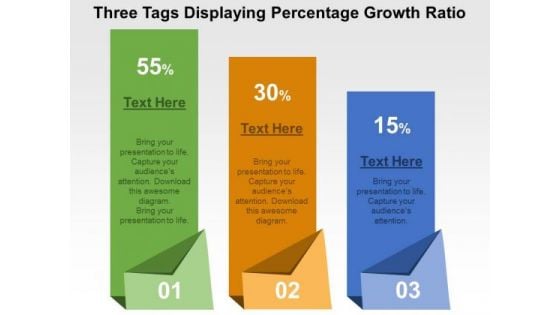
Three Tags Displaying Percentage Growth Ratio PowerPoint Template
Create dynamic presentations with our professional template containing three tags. This diagram is useful to display business percentage growth ratio. Download this template to leave permanent impression on your audience.
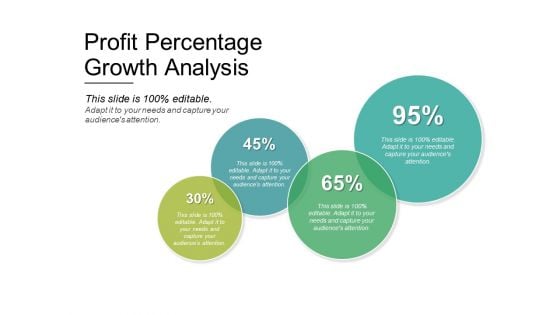
Profit Percentage Growth Analysis Ppt PowerPoint Presentation Layouts Graphics Tutorials
This is a profit percentage growth analysis ppt powerpoint presentation layouts graphics tutorials. This is a four stage process. The stages in this process are comparison chart, comparison table, comparison matrix.
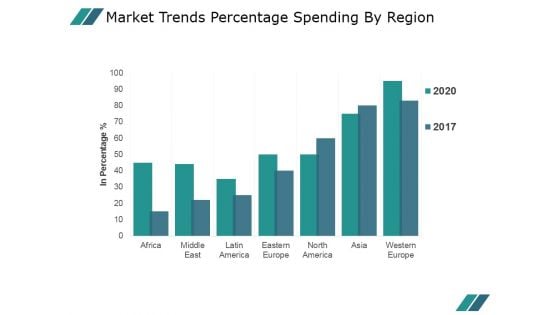
Market Trends Percentage Spending By Region Ppt PowerPoint Presentation Picture
This is a market trends percentage spending by region ppt powerpoint presentation picture. This is a seven stage process. The stages in this process are business, marketing, growth, planning, management.
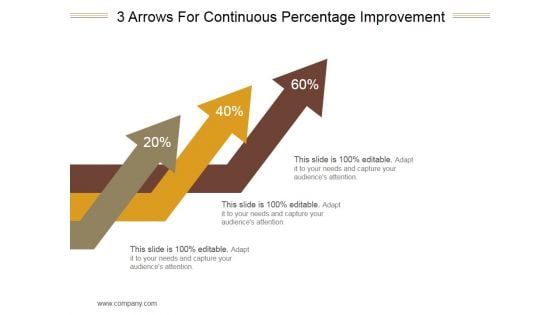
3 Arrows For Continuous Percentage Improvement Ppt PowerPoint Presentation Images
This is a 3 arrows for continuous percentage improvement ppt powerpoint presentation images. This is a three stage process. The stages in this process are arrows, marketing, strategy, management, business.
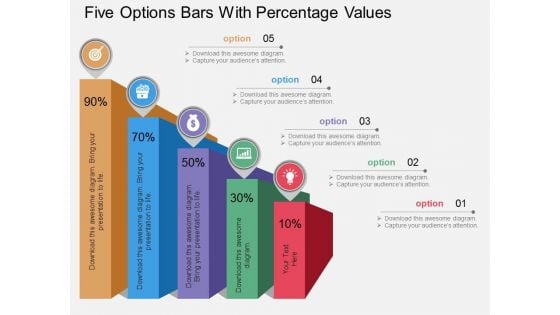
Five Options Bars With Percentage Values Powerpoint Template
Our professionally designed business diagram is as an effective tool for communicating ideas and planning. It contains five options bars with percentage values. Convey your views with this diagram slide. It will amplify the strength of your logic.
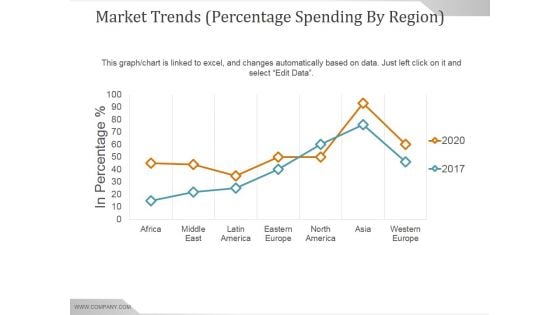
Market Trends Percentage Spending By Region Ppt PowerPoint Presentation Sample
This is a market trends percentage spending by region ppt powerpoint presentation sample. This is a seven stage process. The stages in this process are africa, middle east, latin america, eastern europe, north america, asia, western europe.

3D Men Icon With Percentage Values Powerpoint Templates
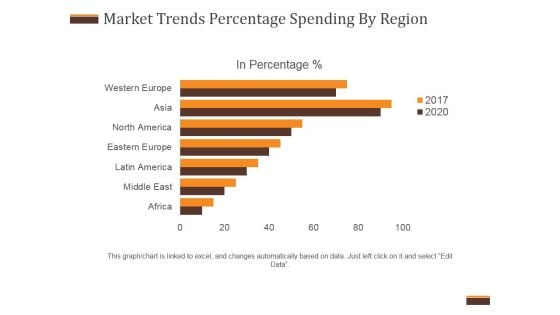
Market Trends Percentage Spending By Region Ppt PowerPoint Presentation Diagrams
This is a market trends percentage spending by region ppt powerpoint presentation diagrams. This is a seven stage process. The stages in this process are business, marketing, management, planning, finance.
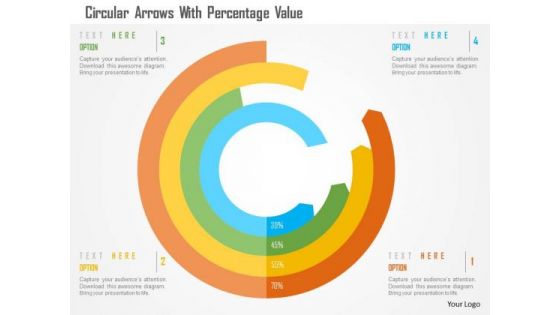
Business Diagram Circular Arrows With Percentage Value Presentation Template
This business slide has been designed with circular arrows. You may download this diagram to display percentage growth data. This template is innovatively designed to highlight your worthy views
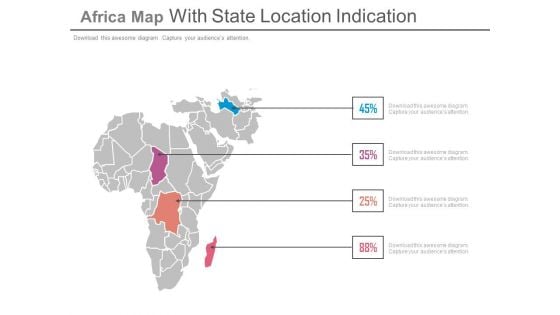
State Location On Africa Map With Percentage Data Powerpoint Slides
This PowerPoint template displays state location on Africa map with percentage data. This Map template can be used for annual growth report. This slide can also be used by school students for educational projects.
Map Of Czech With Percentage Data And Icons Powerpoint Slides
This PowerPoint template displays map of Czech with percentage data and icons. This Map template can be used for annual growth report. This slide can also be used by school students for educational projects.
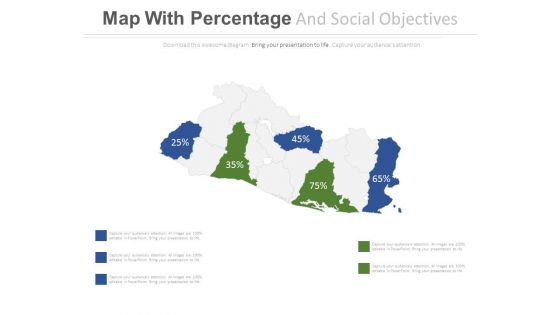
Map With Highlighted Areas And Percentage Values Powerpoint Slides
This PowerPoint template displays map diagram with highlighted areas and percentage values. You may use this PPT slide to exhibit area wise financial growth. Download this PowerPoint map diagram to build impressive presentations.
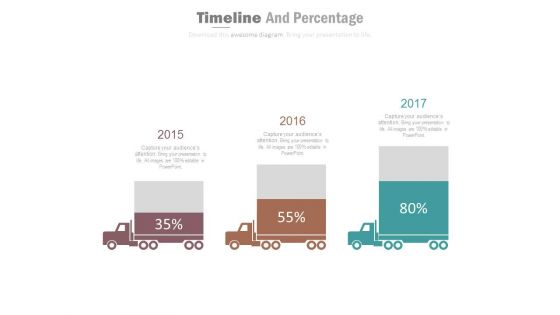
Three Trucks Timeline Diagram With Percentage Value Powerpoint Slides
This PowerPoint timeline template has been designed with three trucks with percentage values. This timeline template may be used to display three years growth planning. Download this PowerPoint timeline template to make impressive presentations.
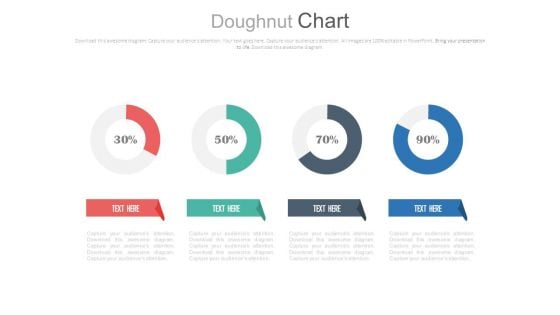
Four Circle Chart With Percentage Ratios Powerpoint Slides
This PowerPoint template has been designed with graphics of four circles and percentage ratios. You may use this dashboard slide design for topics like profit growth and financial planning. This PPT slide is powerful tool to describe your ideas.
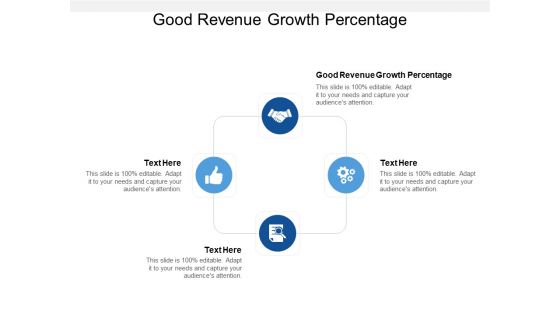
Good Revenue Growth Percentage Ppt PowerPoint Presentation Professional Microsoft Cpb
Presenting this set of slides with name good revenue growth percentage ppt powerpoint presentation professional microsoft cpb. This is an editable Powerpoint four stages graphic that deals with topics like good revenue growth percentage to help convey your message better graphically. This product is a premium product available for immediate download and is 100 percent editable in Powerpoint. Download this now and use it in your presentations to impress your audience.
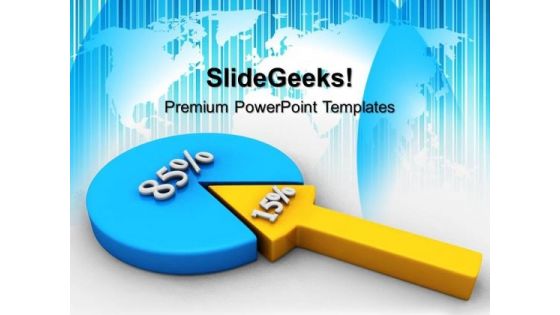
Percentage Pie Graph Marketing PowerPoint Templates And PowerPoint Themes 0412
Microsoft Powerpoint Templates and Background with percent proportion pie chart Enthuse your audience with your ideas. Our Percentage Pie Graph Marketing PowerPoint Templates And PowerPoint Themes 0412 will generate keenness.
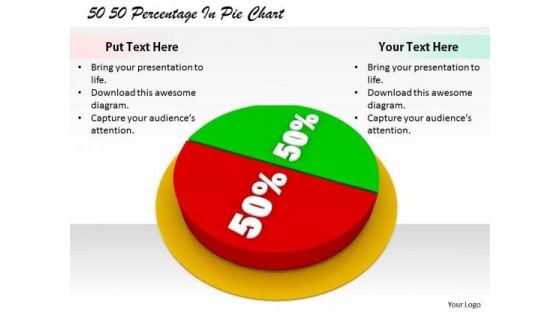
Stock Photo Corporate Business Strategy 50 Percentage Pie Chart Images
Extract admiration from the audience. Create a forceful impact with our stock photo corporate business strategy 50 percentage pie chart images. Force doors open with our finance. The audience will decide to let your thoughts enter.
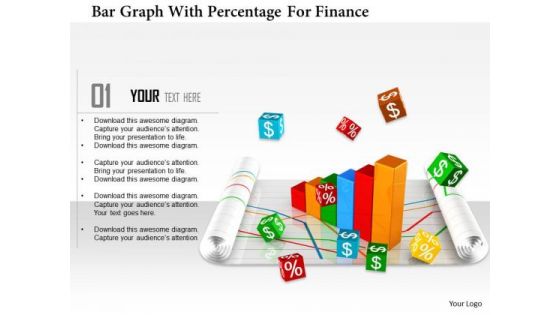
Stock Photo Bar Graph With Percentage For Finance PowerPoint Slide
This Power Point template has been designed with graphic of bar graph and percentage value. This image slide contains the concept of finance and accounting. Use this editable diagram for your business and finance related presentations.

Stock Photo Hundred Percentage Inside Lock Safety PowerPoint Slide
Concept of financial safety has been displayed in this image slide with suitable graphics. This slide has been designed with graphic of hundred percentage value and lock. Use this professional slide to make build innovative presentation on safety related topics.
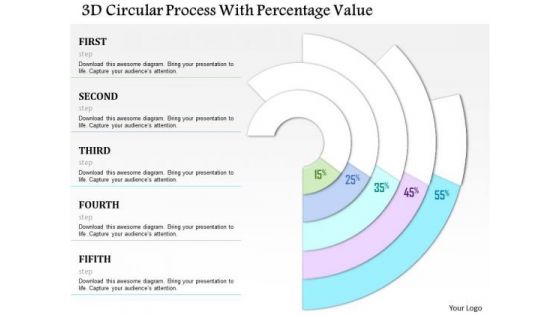
Business Diagram 3d Circular Process With Percentage Value Presentation Template
This power point template has been designed with graphic of 3d circular process and percentage value. This PPT contains the concept of business and marketing process flow. Use this PPT for your business and marketing presentations.
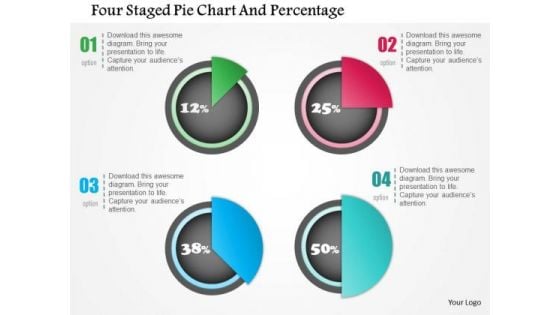
Business Diagram Four Staged Pie Chart And Percentage Presentation Template
Four staged pie chart and percentage values has been used to design this power point template. This PPT contains the concept of financial result analysis. Use this PPT for business and marketing related presentations.
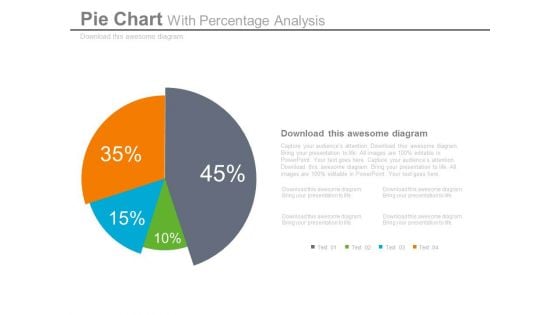
Pie Chart Dashboard Style For Percentage Analysis Powerpoint Slides
This dashboard PPT template contains graphics of pie chart. This dashboard PowerPoint template helps to display percentage analysis in a visual manner. Download this PPT slide for quick decision-making.
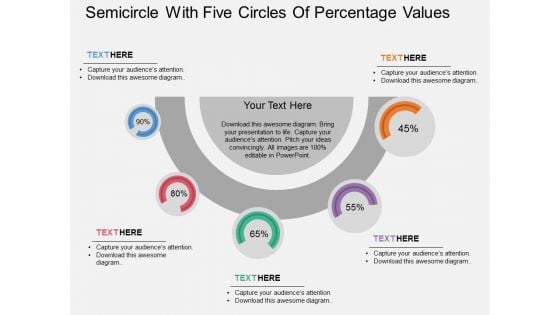
Semicircle With Five Circles Of Percentage Values Powerpoint Template
This PowerPoint template has been designed with graphics of semicircle with five percentage values. This business design can be used for financial ratio analysis. Capture the attention of your audience with this slide.
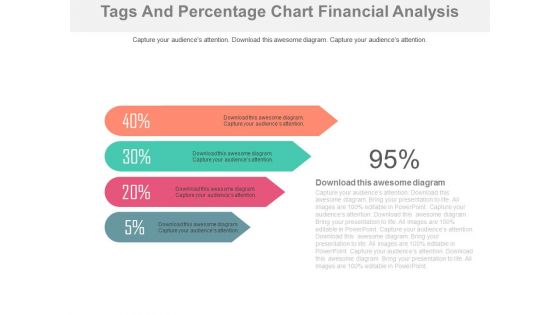
Four Percentage Tags For Financial Analysis Powerpoint Slides
This PowerPoint template contains design of four percentage tags. You may download this PPT slide to display financial analysis. You can easily customize this template to make it more unique as per your need.
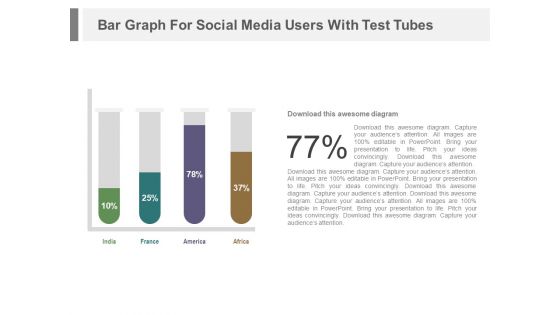
Test Tubes With Financial Data In Percentage Ratio Powerpoint Slides
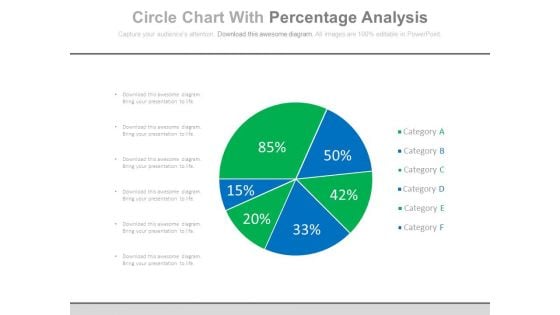
Percentage Chart For Good Marketing Strategy Powerpoint Slides
This PowerPoint template has been designed with pie chart and percentage values. The PowerPoint template has a high quality design. You can download this PowerPoint slide to make good marketing strategy and business plans.
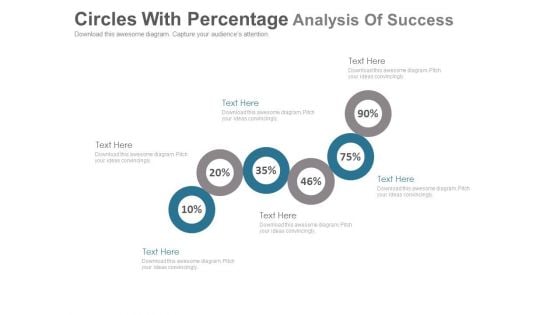
Six Circles For Percentage Value Analysis Powerpoint Slides
This PowerPoint template has been designed with six circles and percentage values. This PPT slide can be used to display financial ratio analysis. You can download finance PowerPoint template to prepare awesome presentations.
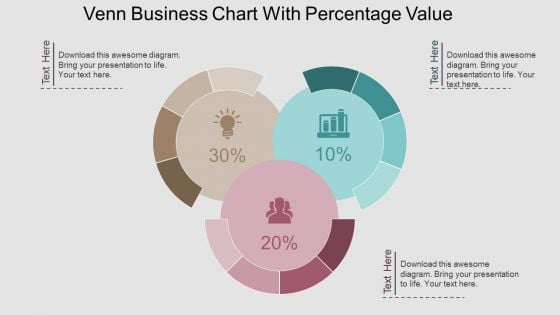
Venn Business Chart With Percentage Value Powerpoint Template
This PPT slide contains Venn business chart with percentage values. This PPT diagram is suitable to present data comparison and analysis. Enlighten others on the process with this innovative PowerPoint template.
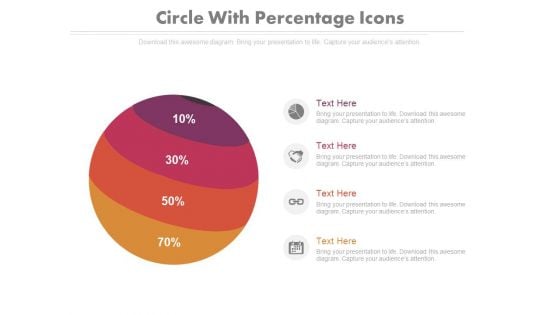
Four Parts Circle Chart With Percentage Ratio Powerpoint Slides
This PowerPoint template contains four parts circle chart with percentage ratio. You may download this PPT slide design to display your ideas in visual manner. You can easily customize this template to make it more unique as per your need.
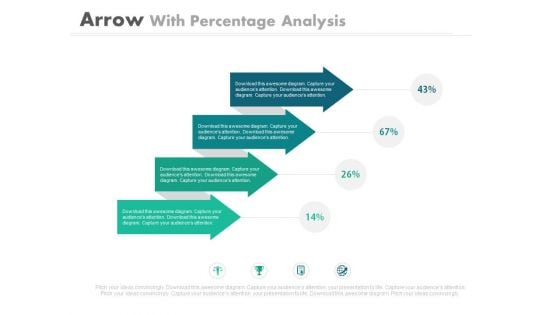
Four Arrows For Percentage Ratio Analysis Powerpoint Slides
This PowerPoint template has been designed with graphics of four arrows with icons. This professional template is suitable to display percentage ratio analysis. Use this diagram slide to build an exclusive presentation.

Four Circles With Percentage Data Display Powerpoint Slides
This PowerPoint template has been designed with graphics of four circles. Download this PPT slide to display percentage data display. Use this professional template to build an exclusive presentation.
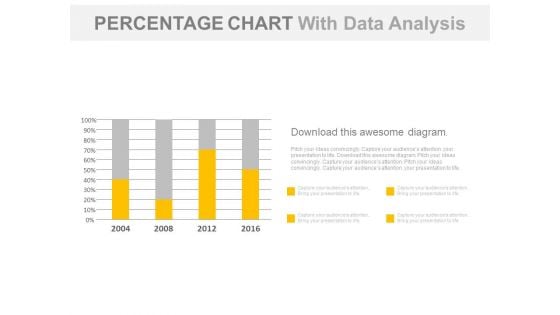
Year Based Chart With Percentage Data Analysis Powerpoint Slides
Our above business slide contains year based statistical chart. This PowerPoint template can be used to display percentage data analysis. Capture the attention of your audience with this slide.
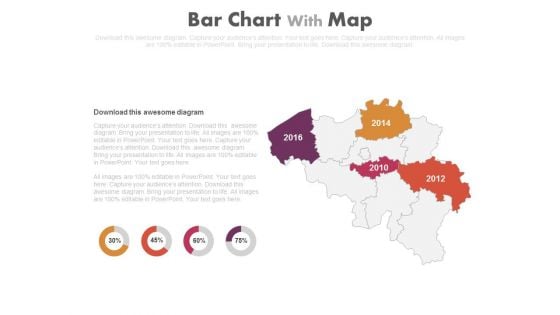
Map With Years And Percentage Charts Powerpoint Slides
This PowerPoint template displays map with years and percentage values. Our professionally designed map diagram is as an effective tool to display economic progress survey of particular areas. Above slide provide ideal backdrop to make business presentations.
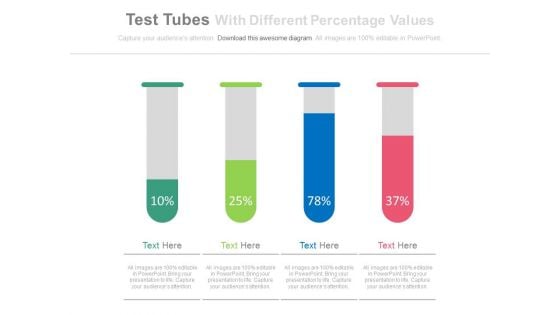
Test Tubes With Percentage Data For Comparison Powerpoint Slides
This PowerPoint template has been designed with test tubes and percentage data. You may download this PPT slide to display data comparison and analysis. Add this slide to your presentation and impress your superiors.
Three Text Boxes With Percentage Values And Icons Powerpoint Slides
This PowerPoint template has been designed with text boxes and percentage data. You may download this PPT slide to display data comparison and analysis. Add this slide to your presentation and impress your superiors.
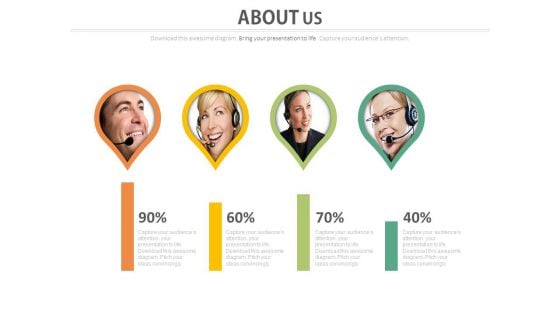
About Us Design With Percentage Values Powerpoint Slides
This PowerPoint template has been designed with about us design with percentage values. Download this PPT slide display companies facts and figures. You can easily customize this template to make it more unique as per your need.
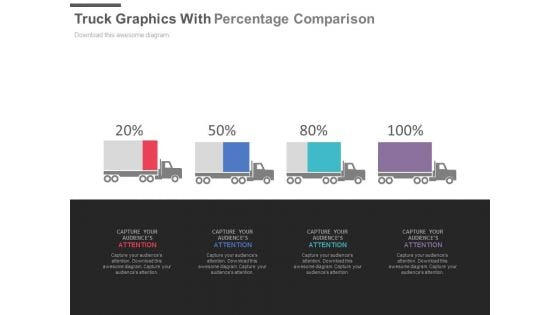
Four Trucks With Percentage Values For Comparison Powerpoint Slides
This PPT slide displays graphics of four trucks with percentage values. Use this PPT design to display logistics compare chart. This PowerPoint template can be customized as per requirements of business presentation.
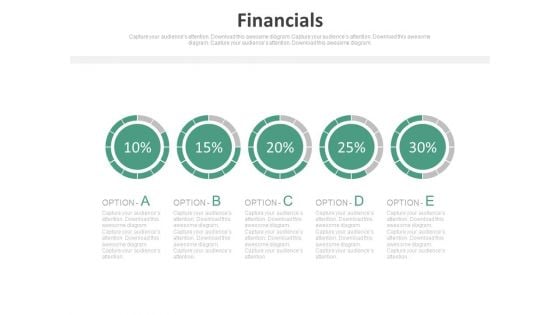
Pie Charts For Percentage Value Analysis Powerpoint Slides
Our above PPT slide displays graphics of Pie charts. This PowerPoint template may be used to display percentage value analysis. Download this template to leave permanent impression on your audience.
Text Tags And Icons With Percentage Values Powerpoint Slides
This PowerPoint template has been designed with graphics of text tags, icons and percentage values. Download this business diagram to outline business plan. Present your views and ideas with this impressive design.
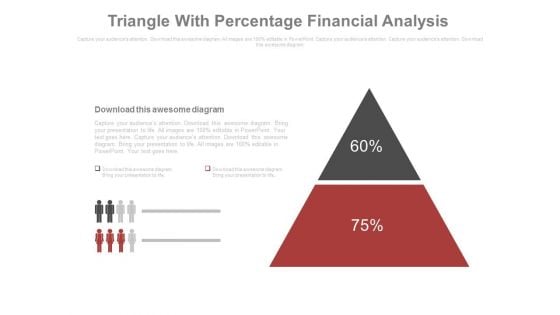
Triangle With Two Segments And Percentage Values Powerpoint Slides
This PowerPoint template contains graphics of triangle with two segments and percentage values. You may use this PPT slide for financial planning. The color coding of this template is specifically designed to highlight you points.

Five Yearly Sequential Timeline With Percentage Values Powerpoint Slides
This PowerPoint timeline slide design can be used to display timeline operations. It contains sequential timeline diagram with percentage values. This timeline template can be used in presentations where you need to display time planning and analysis.
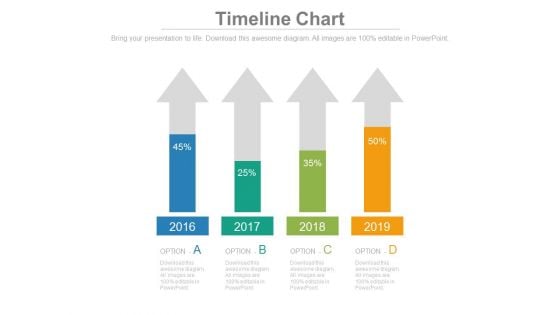
Four Arrows With Percentage Data Analysis Powerpoint Slides
This timeline template can be used for multiple purposes including financial planning, new milestones and tasks. It contains four upward arrows with percentage values. Download this PowerPoint timeline template to make impressive presentations.


 Continue with Email

 Home
Home


