Performance Dashboard
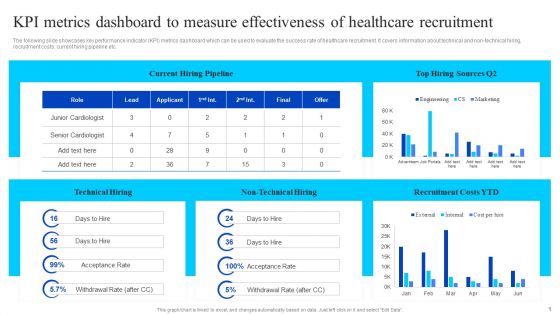
KPI Metrics Dashboard To Measure Effectiveness Of Healthcare Recruitment Microsoft PDF
The following slide showcases key performance indicator KPI metrics dashboard which can be used to evaluate the success rate of healthcare recruitment. It covers information about technical and non-technical hiring, recruitment costs, current hiring pipeline etc. Whether you have daily or monthly meetings, a brilliant presentation is necessary. KPI Metrics Dashboard To Measure Effectiveness Of Healthcare Recruitment Microsoft PDF can be your best option for delivering a presentation. Represent everything in detail using KPI Metrics Dashboard To Measure Effectiveness Of Healthcare Recruitment Microsoft PDF and make yourself stand out in meetings. The template is versatile and follows a structure that will cater to your requirements. All the templates prepared by Slidegeeks are easy to download and edit. Our research experts have taken care of the corporate themes as well. So, give it a try and see the results.
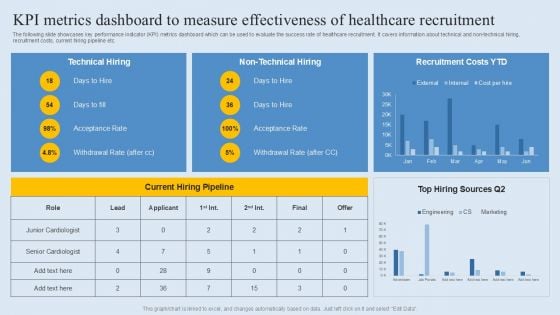
KPI Metrics Dashboard To Measure Effectiveness Of Healthcare Recruitment Demonstration PDF
Executing And Monitoring Project Using Project Management Dashboard For Tracking PM SS V
This slide showcases dashboard for tracing project performance. This template focuses on changing the status of each task and graphs automatically tracking overall status. It covers aspects related to task priority, budget, etc. Slidegeeks has constructed Executing And Monitoring Project Using Project Management Dashboard For Tracking PM SS V after conducting extensive research and examination. These presentation templates are constantly being generated and modified based on user preferences and critiques from editors. Here, you will find the most attractive templates for a range of purposes while taking into account ratings and remarks from users regarding the content. This is an excellent jumping-off point to explore our content and will give new users an insight into our top-notch PowerPoint Templates. This slide showcases dashboard for tracing project performance. This template focuses on changing the status of each task and graphs automatically tracking overall status. It covers aspects related to task priority, budget, etc.
Implementing Fixed Asset Management Fixed Asset Management Dashboard For Tracking Summary PDF
This slide represents fixed asset management dashboard for tracking equipment performance. It includes work management, downtime, work orders etc. Deliver and pitch your topic in the best possible manner with this Implementing Fixed Asset Management Fixed Asset Management Dashboard For Tracking Summary PDF. Use them to share invaluable insights on Data Sets, Asset Details, Labour Analysis, Purchasing Spend and impress your audience. This template can be altered and modified as per your expectations. So, grab it now.
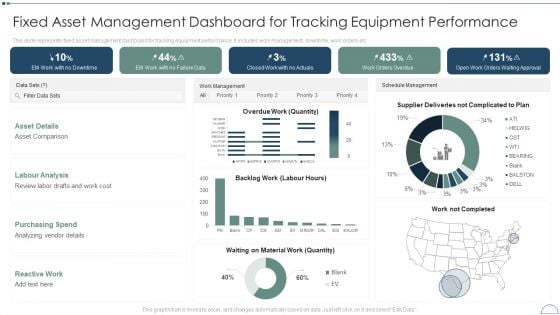
Fixed Asset Management Framework Implementation Fixed Asset Management Dashboard Demonstration PDF
This slide represents fixed asset management dashboard for tracking equipment performance. It includes work management, downtime, work orders etc.Deliver an awe inspiring pitch with this creative Fixed Asset Management Framework Implementation Fixed Asset Management Dashboard Demonstration PDF bundle. Topics like Labour Analysis, Purchasing Spend, Asset Details can be discussed with this completely editable template. It is available for immediate download depending on the needs and requirements of the user.
Fixed Asset Management Dashboard For Implementing Fixed Asset Tracking Solution Topics PDF
This slide represents fixed asset management dashboard for tracking equipment performance. It includes work management, downtime, work orders etc.Deliver an awe inspiring pitch with this creative Fixed Asset Management Dashboard For Implementing Fixed Asset Tracking Solution Topics PDF bundle. Topics like Asset Comparison, Review Labor, Purchasing Spend can be discussed with this completely editable template. It is available for immediate download depending on the needs and requirements of the user.

KPI Dashboard To Track Sales And Operations Process Of Manufacturing Enterprise Brochure PDF
This slide depicts a dashboard to track the key performance metrics in sales and operations process of a manufacturing enterprise to analyze deviations in the actual and planned output. The key performing indicators are percentage deviation, dollar deviation, inventory in hand etc.Pitch your topic with ease and precision using this KPI Dashboard To Track Sales And Operations Process Of Manufacturing Enterprise Brochure PDF. This layout presents information on Planned Output, Yearly Growth, Inventory Hand. It is also available for immediate download and adjustment. So, changes can be made in the color, design, graphics or any other component to create a unique layout.

Automating Key Activities Of HR Manager Dashboard Showing Employee Measurement Metrics Clipart PDF
This slide shows the dashboard that depicts the metrics for measuring employee performance which includes talent satisfaction, talent turnover rate, rating, etc.Deliver and pitch your topic in the best possible manner with this Automating Key Activities Of HR Manager Dashboard Showing Employee Measurement Metrics Clipart PDF Use them to share invaluable insights on Talent Management, Talent Satisfaction, Talent Turnover and impress your audience. This template can be altered and modified as per your expectations. So, grab it now.
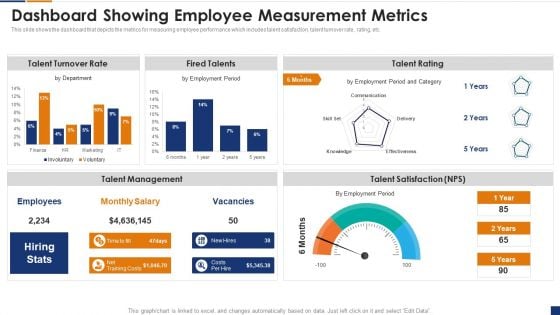
Human Resource Digital Transformation Dashboard Showing Employee Measurement Metrics Demonstration PDF
This slide shows the dashboard that depicts the metrics for measuring employee performance which includes talent satisfaction, talent turnover rate, rating, etc. Deliver and pitch your topic in the best possible manner with this Human Resource Digital Transformation Dashboard Showing Employee Measurement Metrics Demonstration PDF. Use them to share invaluable insights on Fired Talents, Talent Rating, Talent Turnover Rate, Talent Management and impress your audience. This template can be altered and modified as per your expectations. So, grab it now.
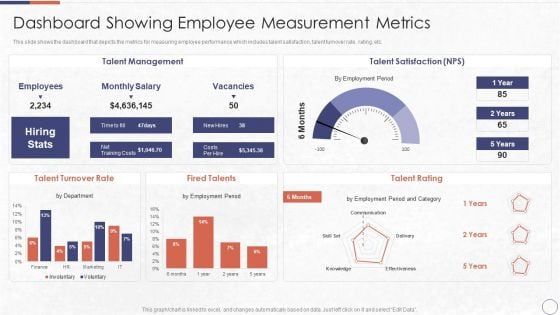
RPA In HR Operations Dashboard Showing Employee Measurement Metrics Slides PDF
This slide shows the dashboard that depicts the metrics for measuring employee performance which includes talent satisfaction, talent turnover rate, rating, etc.Deliver an awe inspiring pitch with this creative RPA In HR Operations Dashboard Showing Employee Measurement Metrics Slides PDF bundle. Topics like Talent Management, Talent Satisfaction, Talent Turnover can be discussed with this completely editable template. It is available for immediate download depending on the needs and requirements of the user.

Developing HR Process Flow Dashboard Showing Employee Measurement Metrics Template PDF
This slide shows the dashboard that depicts the metrics for measuring employee performance which includes talent satisfaction, talent turnover rate, rating, etc.Deliver and pitch your topic in the best possible manner with this Developing HR Process Flow Dashboard Showing Employee Measurement Metrics Template PDF. Use them to share invaluable insights on Talent Satisfaction, Talent Management, Talent Turnover and impress your audience. This template can be altered and modified as per your expectations. So, grab it now.
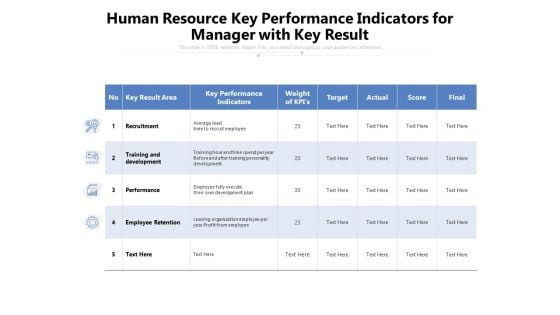
Human Resource Key Performance Indicators For Manager With Key Result Ppt PowerPoint Presentation File Graphics Tutorials PDF
Pitch your topic with ease and precision using this human resource key performance indicators for manager with key result ppt powerpoint presentation file graphics tutorials pdf. This layout presents information on training, development, performance. It is also available for immediate download and adjustment. So, changes can be made in the color, design, graphics or any other component to create a unique layout.
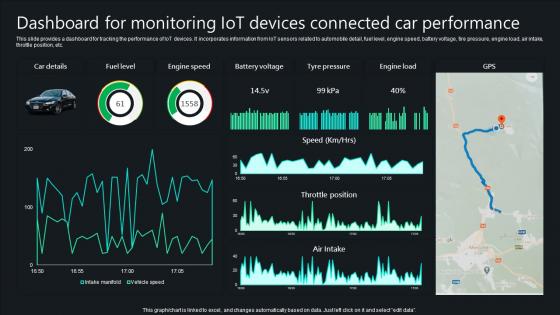
Unlocking Potential IoTs Application Dashboard For Monitoring IoT Devices Connected Car IoT SS V
This slide provides a dashboard for tracking the performance of IoT devices. It incorporates information from IoT sensors related to automobile detail, fuel level, engine speed, battery voltage, tire pressure, engine load, air intake, throttle position, etc. Crafting an eye-catching presentation has never been more straightforward. Let your presentation shine with this tasteful yet straightforward Unlocking Potential IoTs Application Dashboard For Monitoring IoT Devices Connected Car IoT SS V template. It offers a minimalistic and classy look that is great for making a statement. The colors have been employed intelligently to add a bit of playfulness while still remaining professional. Construct the ideal Unlocking Potential IoTs Application Dashboard For Monitoring IoT Devices Connected Car IoT SS V that effortlessly grabs the attention of your audience Begin now and be certain to wow your customers This slide provides a dashboard for tracking the performance of IoT devices. It incorporates information from IoT sensors related to automobile detail, fuel level, engine speed, battery voltage, tire pressure, engine load, air intake, throttle position, etc.
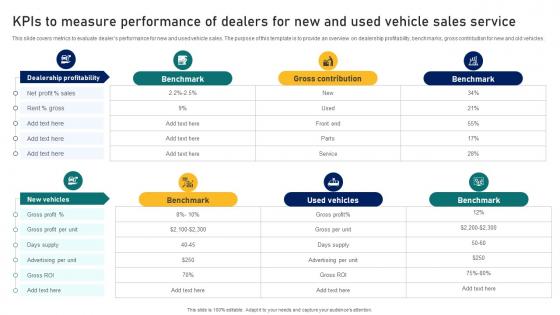
Guide To Building A Successful Dealer Kpis To Measure Performance Of Dealers For New Strategy SS V
This slide covers metrics to evaluate dealers performance for new and used vehicle sales. The purpose of this template is to provide an overview on dealership profitability, benchmarks, gross contribution for new and old vehicles. From laying roadmaps to briefing everything in detail, our templates are perfect for you. You can set the stage with your presentation slides. All you have to do is download these easy-to-edit and customizable templates. Guide To Building A Successful Dealer Kpis To Measure Performance Of Dealers For New Strategy SS V will help you deliver an outstanding performance that everyone would remember and praise you for. Do download this presentation today. This slide covers metrics to evaluate dealers performance for new and used vehicle sales. The purpose of this template is to provide an overview on dealership profitability, benchmarks, gross contribution for new and old vehicles.
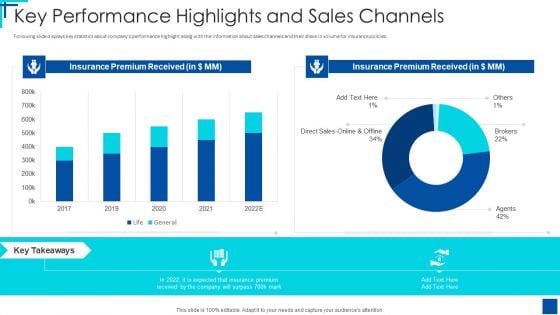
Series C Round Fundraising Pitch Deck Key Performance Highlights And Sales Channels Ppt Infographic Template Portrait PDF
Following slide displays key statistics about companys performance highlight along with the information about sales channels and their share in volume for insurance policies. Deliver an awe inspiring pitch with this creative series c round fundraising pitch deck key performance highlights and sales channels ppt infographic template portrait pdf bundle. Topics like key performance highlights and sales channels can be discussed with this completely editable template. It is available for immediate download depending on the needs and requirements of the user.
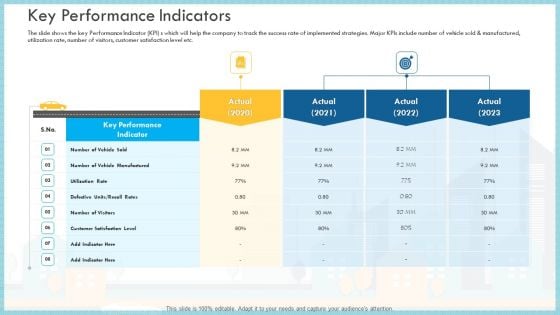
Loss Of Income And Financials Decline In An Automobile Organization Case Study Key Performance Indicators Brochure PDF
The slide shows the key Performance Indicator KPI s which will help the company to track the success rate of implemented strategies. Major KPIs include number of vehicle sold and manufactured, utilization rate, number of visitors, customer satisfaction level etc.Deliver an awe inspiring pitch with this creative loss of income and financials decline in an automobile organization case study key performance indicators brochure pdf bundle. Topics like key performance indicator, utilization rate, customer satisfaction level can be discussed with this completely editable template. It is available for immediate download depending on the needs and requirements of the user
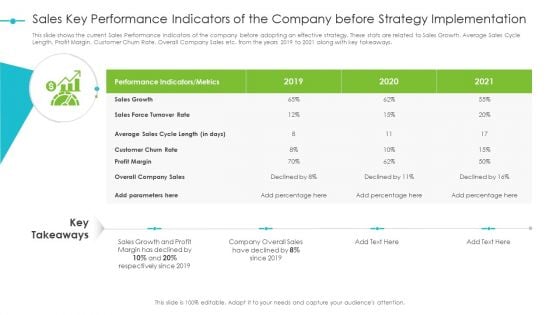
Tools For Improving Sales Plan Effectiveness Sales Key Performance Indicators Of The Company Before Strategy Implementation Topics PDF
This slide shows the current Sales Performance Indicators of the company before adopting an effective strategy. These stats are related to Sales Growth, Average Sales Cycle Length, Profit Margin, Customer Churn Rate, Overall Company Sales etc. from the years 2019 to 2021 along with key takeaways. Deliver and pitch your topic in the best possible manner with this tools for improving sales plan effectiveness sales key performance indicators of the company before strategy implementation topics pdf. Use them to share invaluable insights on sales, growth, profit margin, performance and impress your audience. This template can be altered and modified as per your expectations. So, grab it now.
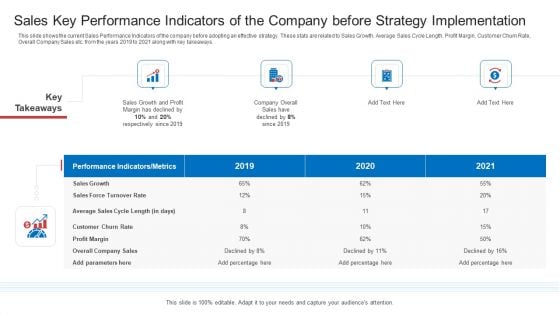
Strategic Plan To Increase Sales Volume And Revenue Sales Key Performance Indicators Of The Company Before Strategy Implementation Download PDF
This slide shows the current Sales Performance Indicators of the company before adopting an effective strategy. These stats are related to Sales Growth, Average Sales Cycle Length, Profit Margin, Customer Churn Rate, Overall Company Sales etc. from the years 2019 to 2021 along with key takeaways. Deliver and pitch your topic in the best possible manner with this strategic plan to increase sales volume and revenue sales key performance indicators of the company before strategy implementation download pdf. Use them to share invaluable insights on sales, growth, profit margin, performance and impress your audience. This template can be altered and modified as per your expectations. So, grab it now.
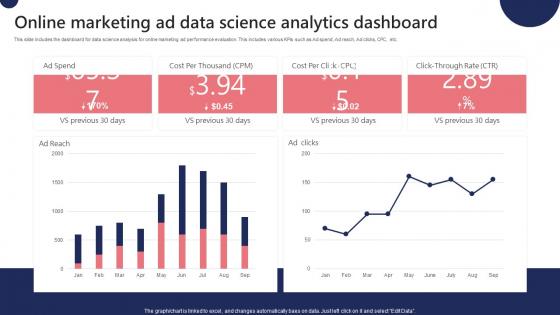
Online Marketing Ad Data Science Analytics Dashboard Ppt File Portfolio Pdf
This slide includes the dashboard for data science analysis for online marketing ad performance evaluation. This includes various KPIs such as Ad spend, Ad reach, Ad clicks, CPC, etc. Showcasing this set of slides titled Online Marketing Ad Data Science Analytics Dashboard Ppt File Portfolio Pdf. The topics addressed in these templates are Data Transformation, Data Visualization, Cross Channel Analytics. All the content presented in this PPT design is completely editable. Download it and make adjustments in color, background, font etc. as per your unique business setting. This slide includes the dashboard for data science analysis for online marketing ad performance evaluation. This includes various KPIs such as Ad spend, Ad reach, Ad clicks, CPC, etc.
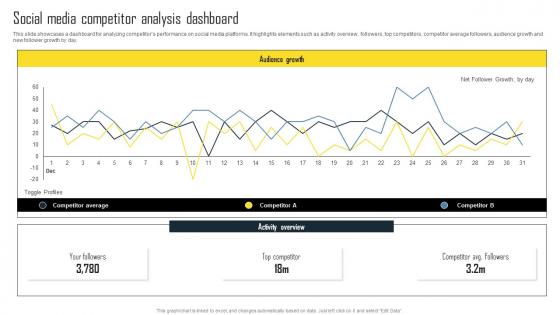
Social Media Competitor Analysis Dashboard Efficient Plan For Conducting Competitor Microsoft Pdf
This slide showcases a dashboard for analyzing competitors performance on social media platforms. It highlights elements such as activity overview, followers, top competitors, competitor average followers, audience growth and new follower growth by day. Are you in need of a template that can accommodate all of your creative concepts This one is crafted professionally and can be altered to fit any style. Use it with Google Slides or PowerPoint. Include striking photographs, symbols, depictions, and other visuals. Fill, move around, or remove text boxes as desired. Test out color palettes and font mixtures. Edit and save your work, or work with colleagues. Download Social Media Competitor Analysis Dashboard Efficient Plan For Conducting Competitor Microsoft Pdf and observe how to make your presentation outstanding. Give an impeccable presentation to your group and make your presentation unforgettable. This slide showcases a dashboard for analyzing competitors performance on social media platforms. It highlights elements such as activity overview, followers, top competitors, competitor average followers, audience growth and new follower growth by day.

Case Competition Reduction In Existing Customer Of Telecommunication Company Key Performance Indicators Ppt Layouts Graphics Pictures PDF
This is a case competition reduction in existing customer of telecommunication company key performance indicators ppt layouts graphics pictures pdf template with various stages. Focus and dispense information on seven stages using this creative set, that comes with editable features. It contains large content boxes to add your information on topics like key performance indicator, subscribers, technology users, average revenue, customer satisfaction level . You can also showcase facts, figures, and other relevant content using this PPT layout. Grab it now.
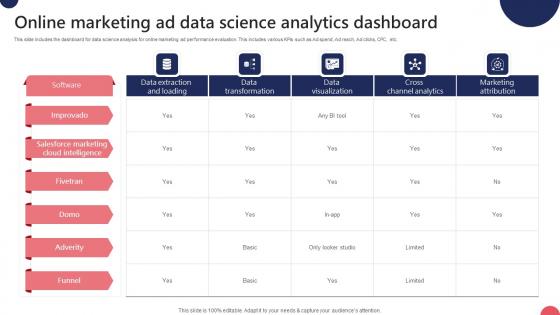
Online Marketing Ad Data Science Analytics Dashboard Ppt Inspiration Guidelines Pdf
This slide includes the dashboard for data science analysis for online marketing ad performance evaluation. This includes various KPIs such as Ad spend, Ad reach, Ad clicks, CPC, etc. Pitch your topic with ease and precision using this Online Marketing Ad Data Science Analytics Dashboard Ppt Inspiration Guidelines Pdf. This layout presents information on Ad Spend, Cost Per Thousand, Cost Per Click. It is also available for immediate download and adjustment. So, changes can be made in the color, design, graphics or any other component to create a unique layout. This slide includes the dashboard for data science analysis for online marketing ad performance evaluation. This includes various KPIs such as Ad spend, Ad reach, Ad clicks, CPC, etc.

Iot And Digital Twin To Reduce Costs Post Covid Key Performance Indicators In Oil And Gas Industry Infographics PDF
This slide focuses on the key performance indicators in oil and gas industry which includes loss of primary containment, oil spills, greenhouse gas emissions, etc. Deliver an awe inspiring pitch with this creative iot and digital twin to reduce costs post covid key performance indicators in oil and gas industry infographics pdf bundle. Topics like reported recordable injury frequency, loss of primary containment, oil spills, diversity and inclusion, group priorities engagement can be discussed with this completely editable template. It is available for immediate download depending on the needs and requirements of the user.
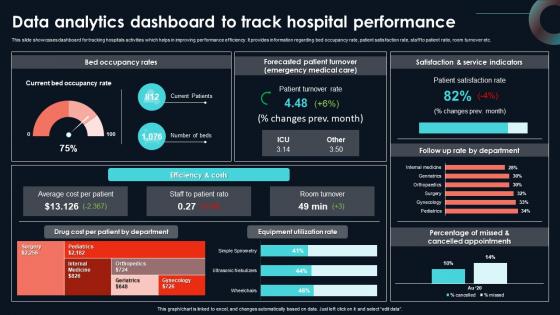
Data Analytics Dashboard To Track Hospital Developing Strategic Insights Using Big Data Analytics SS V
This slide showcases dashboard for tracking hospitals activities which helps in improving performance efficiency. It provides information regarding bed occupancy rate, patient satisfaction rate, staff to patient ratio, room turnover etc. The best PPT templates are a great way to save time, energy, and resources. Slidegeeks have 100 percent editable powerpoint slides making them incredibly versatile. With these quality presentation templates, you can create a captivating and memorable presentation by combining visually appealing slides and effectively communicating your message. Download Data Analytics Dashboard To Track Hospital Developing Strategic Insights Using Big Data Analytics SS V from Slidegeeks and deliver a wonderful presentation. This slide showcases dashboard for tracking hospitals activities which helps in improving performance efficiency. It provides information regarding bed occupancy rate, patient satisfaction rate, staff to patient ratio, room turnover etc.
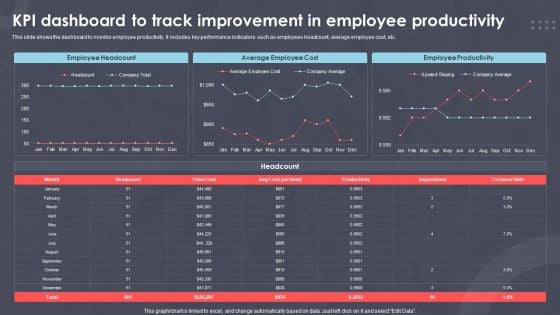
Kpi Dashboard To Track Improvement In Employee Productivity Ppt PowerPoint Presentation Outline Samples PDF
This slide shows the dashboard to monitor employee productivity. It includes key performance indicators such as employees headcount, average employee cost, etc.Showcasing this set of slides titled XXXXXXXXX. The topics addressed in these templates are Employee Headcount, Average Employee, Employee Productivity. All the content presented in this PPT design is completely editable. Download it and make adjustments in color, background, font etc. as per your unique business setting.
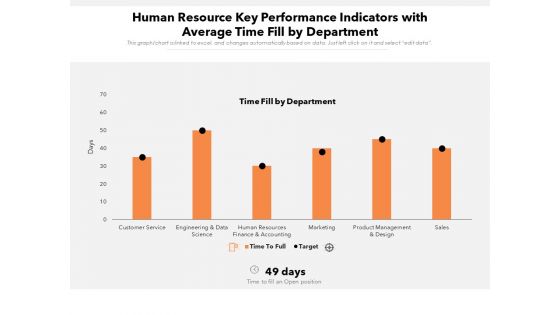
Human Resource Key Performance Indicators With Average Time Fill By Department Ppt PowerPoint Presentation Gallery Example Introduction PDF
Showcasing this set of slides titled human resource key performance indicators with average time fill by department ppt powerpoint presentation gallery example introduction pdf. The topics addressed in these templates are sales, service, finance. All the content presented in this PPT design is completely editable. Download it and make adjustments in color, background, font etc. as per your unique business setting.
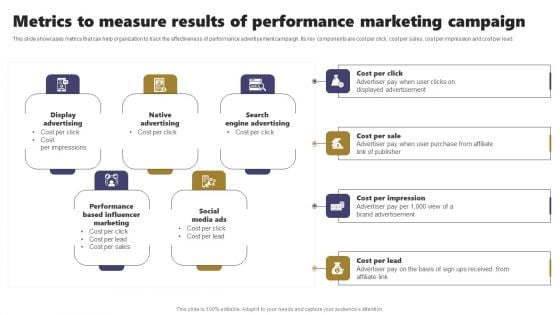
Acquiring Clients Through Search Engine And Native Ads Metrics To Measure Results Of Performance Marketing Structure PDF
This slide showcases metrics that can help organization to track the effectiveness of performance advertisement campaign. Its key components are cost per click, cost per sales, cost per impression and cost per lead. Formulating a presentation can take up a lot of effort and time, so the content and message should always be the primary focus. The visuals of the PowerPoint can enhance the presenters message, so our Acquiring Clients Through Search Engine And Native Ads Metrics To Measure Results Of Performance Marketing Structure PDF was created to help save time. Instead of worrying about the design, the presenter can concentrate on the message while our designers work on creating the ideal templates for whatever situation is needed. Slidegeeks has experts for everything from amazing designs to valuable content, we have put everything into Acquiring Clients Through Search Engine And Native Ads Metrics To Measure Results Of Performance Marketing Structure PDF
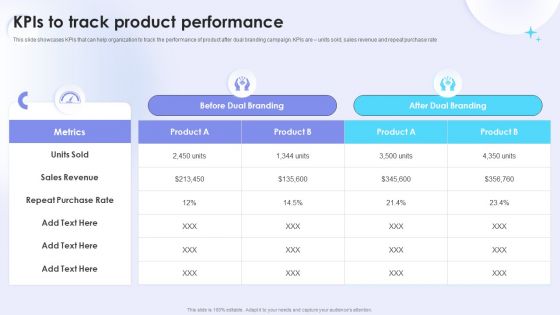
Dual Branding Campaign To Boost Sales Of Product Or Services Kpis To Track Product Performance Introduction PDF
This slide showcases KPIs that can help organization to track the performance of product after dual branding campaign. KPIs are units sold, sales revenue and repeat purchase rate. Boost your pitch with our creative Dual Branding Campaign To Boost Sales Of Product Or Services Kpis To Track Product Performance Introduction PDF. Deliver an awe inspiring pitch that will mesmerize everyone. Using these presentation templates you will surely catch everyones attention. You can browse the ppts collection on our website. We have researchers who are experts at creating the right content for the templates. So you do not have to invest time in any additional work. Just grab the template now and use them.
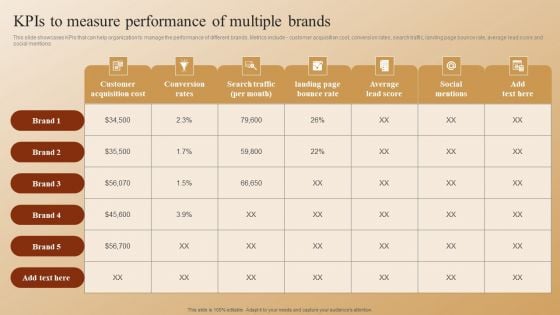
Establishing A Brand Identity For Organizations With Several Brands Kpis To Measure Performance Of Multiple Brands Demonstration PDF
This slide showcases KPIs that can help organization to manage the performance of different brands. Metrics include - customer acquisition cost, conversion rates, search traffic, landing page bounce rate, average lead score and social mentions. Presenting this PowerPoint presentation, titled Establishing A Brand Identity For Organizations With Several Brands Kpis To Measure Performance Of Multiple Brands Demonstration PDF, with topics curated by our researchers after extensive research. This editable presentation is available for immediate download and provides attractive features when used. Download now and captivate your audience. Presenting this Establishing A Brand Identity For Organizations With Several Brands Kpis To Measure Performance Of Multiple Brands Demonstration PDF. Our researchers have carefully researched and created these slides with all aspects taken into consideration. This is a completely customizable Establishing A Brand Identity For Organizations With Several Brands Kpis To Measure Performance Of Multiple Brands Demonstration PDF that is available for immediate downloading. Download now and make an impact on your audience. Highlight the attractive features available with our PPTs.
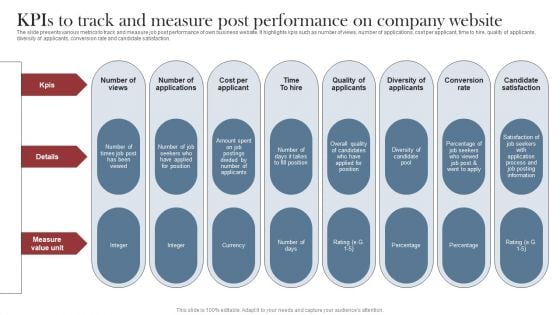
Recruitment Marketing Strategies For NPO Business Kpis To Track And Measure Post Performance Company Website Structure PDF
The slide presents various metrics to track and measure job post performance of own business website. It highlights kpis such as number of views, number of applications, cost per applicant, time to hire, quality of applicants, diversity of applicants, conversion rate and candidate satisfaction. Presenting this PowerPoint presentation, titled Recruitment Marketing Strategies For NPO Business Kpis To Track And Measure Post Performance Company Website Structure PDF, with topics curated by our researchers after extensive research. This editable presentation is available for immediate download and provides attractive features when used. Download now and captivate your audience. Presenting this Recruitment Marketing Strategies For NPO Business Kpis To Track And Measure Post Performance Company Website Structure PDF. Our researchers have carefully researched and created these slides with all aspects taken into consideration. This is a completely customizable Recruitment Marketing Strategies For NPO Business Kpis To Track And Measure Post Performance Company Website Structure PDF that is available for immediate downloading. Download now and make an impact on your audience. Highlight the attractive features available with our PPTs.
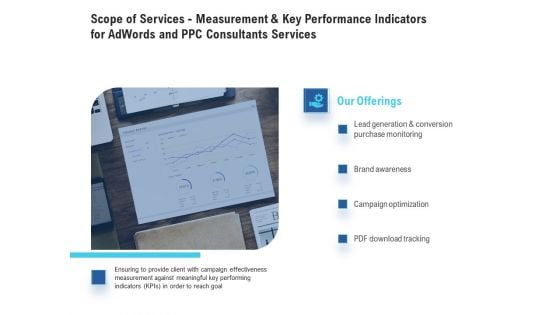
Scope Of Services - Measurement And Key Performance Indicators For Adwords And PPC Consultants Services Brochure PDF
Presenting this set of slides with name scope of services - measurement and key performance indicators for adwords and ppc consultants services brochure pdf. This is a four stage process. The stages in this process are lead generation and conversion purchase monitoring, brand awareness, campaign optimization, pdf download tracking. This is a completely editable PowerPoint presentation and is available for immediate download. Download now and impress your audience.
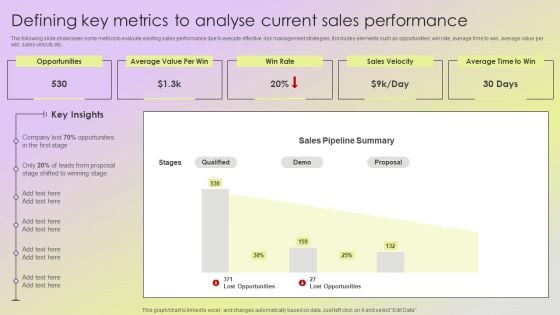
Mitigating Sales Risks With Strategic Action Planning Defining Key Metrics To Analyse Current Sales Performance Slides PDF
The following slide showcases some metrics to evaluate existing sales performance due to execute effective risk management strategies. It includes elements such as opportunities, win rate, average time to win, average value per win, sales velocity etc. This modern and well arranged Mitigating Sales Risks With Strategic Action Planning Defining Key Metrics To Analyse Current Sales Performance Slides PDF provides lots of creative possibilities. It is very simple to customize and edit with the Powerpoint Software. Just drag and drop your pictures into the shapes. All facets of this template can be edited with Powerpoint no extra software is necessary. Add your own material, put your images in the places assigned for them, adjust the colors, and then you can show your slides to the world, with an animated slide included.
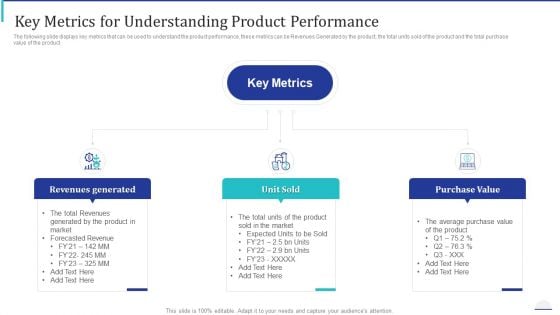
How Make Impactful Product Marketing Message Build Product Differentiation Key Metrics For Understanding Product Performance Rules PDF
The following slide displays key metrics that can be used to understand the product performance, these metrics can be Revenues Generated by the product, the total units sold of the product and the total purchase value of the product. This is a how make impactful product marketing message build product differentiation key metrics for understanding product performance rules pdf template with various stages. Focus and dispense information on three stages using this creative set, that comes with editable features. It contains large content boxes to add your information on topics like revenues generated, unit sold, purchase value. You can also showcase facts, figures, and other relevant content using this PPT layout. Grab it now.
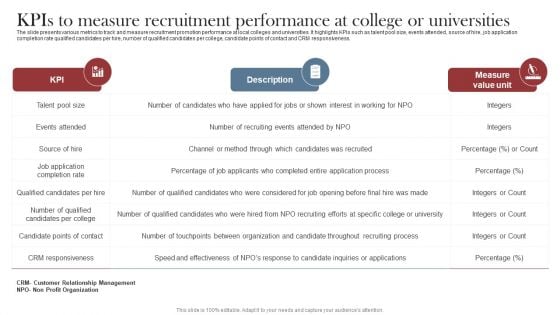
Recruitment Marketing Strategies For NPO Business Kpis To Measure Recruitment Performance At College Or Universities Clipart PDF
The slide presents various metrics to track and measure recruitment promotion performance at local colleges and universities. It highlights KPIs such as talent pool size, events attended, source of hire, job application completion rate qualified candidates per hire, number of qualified candidates per college, candidate points of contact and CRM responsiveness. Retrieve professionally designed Recruitment Marketing Strategies For NPO Business Kpis To Measure Recruitment Performance At College Or Universities Clipart PDF to effectively convey your message and captivate your listeners. Save time by selecting pre-made slideshows that are appropriate for various topics, from business to educational purposes. These themes come in many different styles, from creative to corporate, and all of them are easily adjustable and can be edited quickly. Access them as PowerPoint templates or as Google Slides themes. You do not have to go on a hunt for the perfect presentation because Slidegeeks got you covered from everywhere.
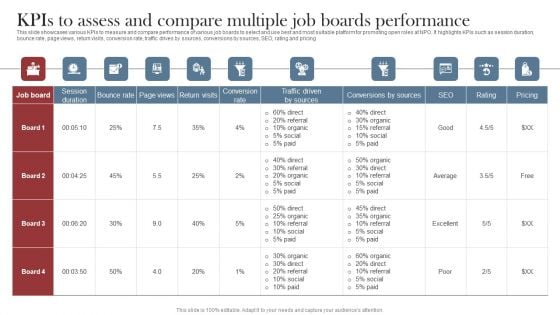
Recruitment Marketing Strategies For NPO Business Kpis To Assess And Compare Multiple Job Boards Performance Summary PDF
This slide showcases various KPIs to measure and compare performance of various job boards to select and use best and most suitable platform for promoting open roles at NPO. It highlights KPIs such as session duration, bounce rate, page views, return visits, conversion rate, traffic drives by sources, conversions by sources, SEO, rating and pricing Are you searching for a Recruitment Marketing Strategies For NPO Business Kpis To Assess And Compare Multiple Job Boards Performance Summary PDF that is uncluttered, straightforward, and original Its easy to edit, and you can change the colors to suit your personal or business branding. For a presentation that expresses how much effort you have put in, this template is ideal With all of its features, including tables, diagrams, statistics, and lists, its perfect for a business plan presentation. Make your ideas more appealing with these professional slides. Download Recruitment Marketing Strategies For NPO Business Kpis To Assess And Compare Multiple Job Boards Performance Summary PDF from Slidegeeks today.
Sales L2RM System Tracking Key Metrics Dashboard Ppt Professional Format Ideas PDF
This slide represents the dashboard for tracking the key performance indicators of sales lead to revenue management. It includes key metrics such as leads by campaign, ratings, lead generation rate, top accounts by revenue and top owners by number of accounts. Showcasing this set of slides titled Sales L2RM System Tracking Key Metrics Dashboard Ppt Professional Format Ideas PDF. The topics addressed in these templates are Leads By Campaign, Leads By Rating, Leads Generation Rate. All the content presented in this PPT design is completely editable. Download it and make adjustments in color, background, font etc. as per your unique business setting.
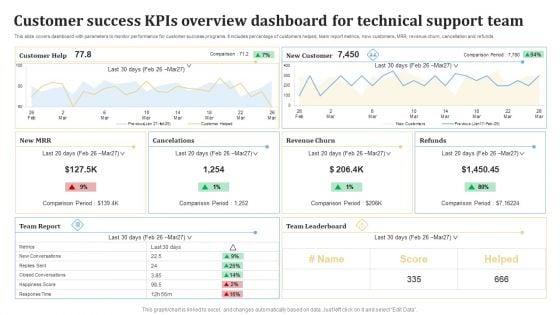
Customer Success KPIS Overview Dashboard For Technical Support Team Ppt PowerPoint Presentation Gallery Layouts PDF
This slide covers dashboard with parameters to monitor performance for customer success programs. It includes percentage of customers helped, team report metrics, new customers, MRR, revenue churn, cancellation and refunds. Showcasing this set of slides titled Customer Success KPIS Overview Dashboard For Technical Support Team Ppt PowerPoint Presentation Gallery Layouts PDF. The topics addressed in these templates are Customer, Cancelations, New Customer, Revenue Churn. All the content presented in this PPT design is completely editable. Download it and make adjustments in color, background, font etc. as per your unique business setting.
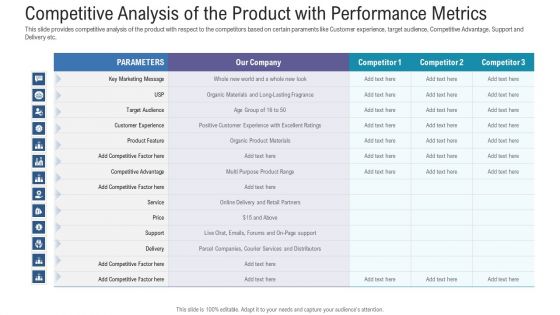
Pitch Deck For Fundraising From Angel Investors Competitive Analysis Of The Product With Performance Metrics Infographics PDF
This slide provides competitive analysis of the product with respect to the competitors based on certain paraments like Customer experience, target audience, Competitive Advantage, Support and Delivery etc. Deliver an awe inspiring pitch with this creative pitch deck for fundraising from angel investors competitive analysis of the product with performance metrics infographics pdf bundle. Topics like key marketing, product feature, competitor, organic product materials, service can be discussed with this completely editable template. It is available for immediate download depending on the needs and requirements of the user.
Illustrating Product Leadership Plan Incorporating Innovative Techniques Dashboard Depicting Sales Icons PDF
This slide focuses on dashboard that depicts sales product performance that includes top products in revenues, online verses offline purchases, incremental sales by campaign and cost of goods sold. Deliver an awe inspiring pitch with this creative illustrating product leadership plan incorporating innovative techniques dashboard depicting sales icons pdf bundle. Topics like incremental sales by campaign, top products in revenue, online vs offline purchases, cost of goods sold can be discussed with this completely editable template. It is available for immediate download depending on the needs and requirements of the user.
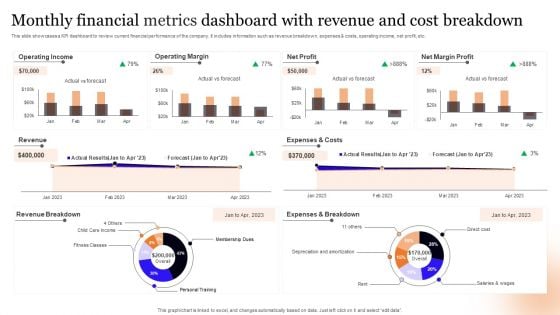
Monthly Financial Metrics Dashboard With Revenue And Cost Breakdown Information PDF
This slide showcases a KPI dashboard to review current financial performance of the company. It includes information such as revenue breakdown, expenses and costs, operating income, net profit, etc. Pitch your topic with ease and precision using this Monthly Financial Metrics Dashboard With Revenue And Cost Breakdown Information PDF. This layout presents information on Operating Income, Operating Margin, Net Profit. It is also available for immediate download and adjustment. So, changes can be made in the color, design, graphics or any other component to create a unique layout.
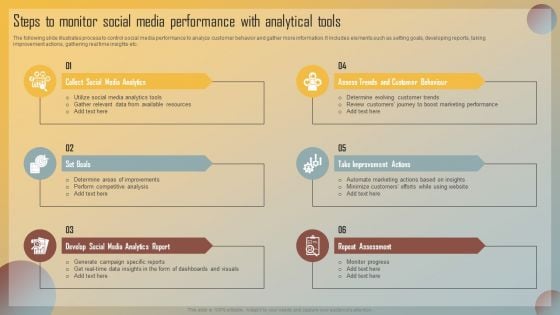
Guide For Marketing Analytics To Improve Decisions Steps To Monitor Social Media Performance With Analytical Tools Topics PDF
The following slide illustrates process to control social media performance to analyze customer behavior and gather more information. It includes elements such as setting goals, developing reports, taking improvement actions, gathering real time insights etc. Welcome to our selection of the Guide For Marketing Analytics To Improve Decisions Steps To Monitor Social Media Performance With Analytical Tools Topics PDF. These are designed to help you showcase your creativity and bring your sphere to life. Planning and Innovation are essential for any business that is just starting out. This collection contains the designs that you need for your everyday presentations. All of our PowerPoints are 100 percent editable, so you can customize them to suit your needs. This multi purpose template can be used in various situations. Grab these presentation templates today.
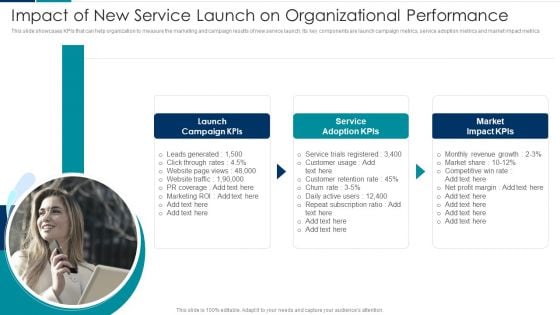
Managing New Service Roll Out And Marketing Procedure Impact Of New Service Launch On Organizational Performance Diagrams PDF
This slide showcases KPIs that can help organization to measure the marketing and campaign results of new service launch. Its key components are launch campaign metrics, service adoption metrics and market impact metrics. Presenting Managing New Service Roll Out And Marketing Procedure Impact Of New Service Launch On Organizational Performance Diagrams PDF to provide visual cues and insights. Share and navigate important information on three stages that need your due attention. This template can be used to pitch topics like Launch Campaign Kpis, Service Adoption Kpis, Market Impact Kpis. In addtion, this PPT design contains high resolution images, graphics, etc, that are easily editable and available for immediate download.
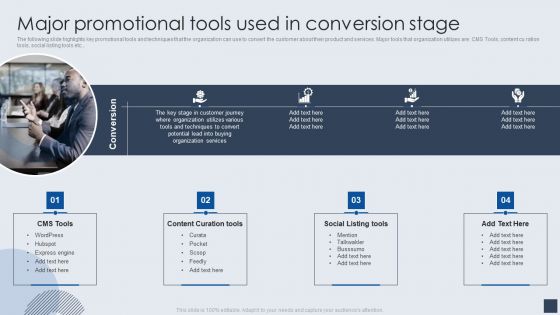
Implementing Marketing Mix Strategy To Enhance Overall Performance Major Promotional Tools Used In Conversion Stage Infographics PDF
The following slide highlights key promotional tools and techniques that the organization can use to convert the customer about their product and services. Major tools that organization utilizes are CMS Tools, content cu ration tools, social listing tools etc. Presenting Implementing Marketing Mix Strategy To Enhance Overall Performance Major Promotional Tools Used In Conversion Stage Infographics PDF to provide visual cues and insights. Share and navigate important information on four stages that need your due attention. This template can be used to pitch topics like Content Curation Tools, Social Listing Tools, CMS Tools. In addtion, this PPT design contains high resolution images, graphics, etc, that are easily editable and available for immediate download.
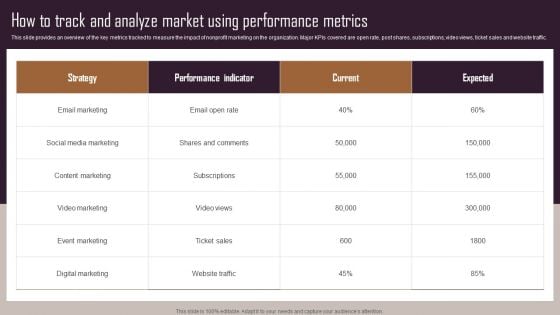
Effective NPO Promotional Strategies For Recruit Volunteers How To Track And Analyze Market Using Performance Designs PDF
This slide provides an overview of the key metrics tracked to measure the impact of nonprofit marketing on the organization. Major KPIs covered are open rate, post shares, subscriptions, video views, ticket sales and website traffic. The Effective NPO Promotional Strategies For Recruit Volunteers How To Track And Analyze Market Using Performance Designs PDF is a compilation of the most recent design trends as a series of slides. It is suitable for any subject or industry presentation, containing attractive visuals and photo spots for businesses to clearly express their messages. This template contains a variety of slides for the user to input data, such as structures to contrast two elements, bullet points, and slides for written information. Slidegeeks is prepared to create an impression.
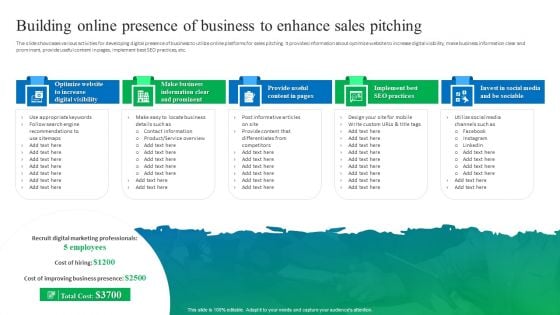
Process Enhancement Plan To Boost Sales Performance Building Online Presence Of Business To Enhance Sales Pitching Infographics PDF
The slide showcases various activities for developing digital presence of business to utilize online platforms for sales pitching. It provides information about optimize website to increase digital visibility, make business information clear and prominent, provide useful content in pages, implement best SEO practices, etc. This modern and well arranged Process Enhancement Plan To Boost Sales Performance Building Online Presence Of Business To Enhance Sales Pitching Infographics PDF provides lots of creative possibilities. It is very simple to customize and edit with the Powerpoint Software. Just drag and drop your pictures into the shapes. All facets of this template can be edited with Powerpoint no extra software is necessary. Add your own material, put your images in the places assigned for them, adjust the colors, and then you can show your slides to the world, with an animated slide included.
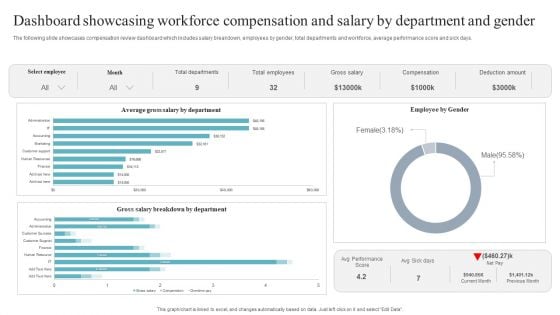
Dashboard Showcasing Workforce Compensation And Salary By Department And Gender Microsoft PDF
The following slide showcases compensation review dashboard which includes salary breakdown, employees by gender, total departments and workforce, average performance score and sick days. Showcasing this set of slides titled Dashboard Showcasing Workforce Compensation And Salary By Department And Gender Microsoft PDF. The topics addressed in these templates are Dashboard Showcasing, Workforce Compensation. All the content presented in this PPT design is completely editable. Download it and make adjustments in color, background, font etc. as per your unique business setting.
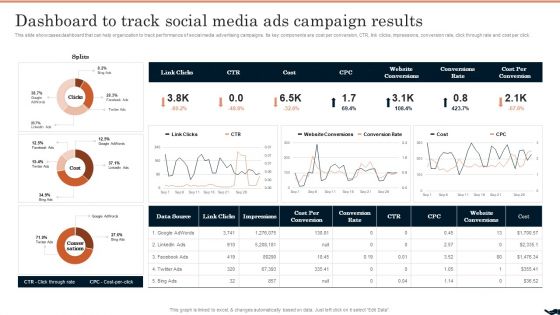
Generating Leads Through Dashboard To Track Social Media Ads Campaign Results Themes PDF
This slide showcases dashboard that can help organization to track performance of social media advertising campaigns. Its key components are cost per conversion, CTR, link clicks, impressions, conversion rate, click through rate and cost per click. From laying roadmaps to briefing everything in detail, our templates are perfect for you. You can set the stage with your presentation slides. All you have to do is download these easy-to-edit and customizable templates. Generating Leads Through Dashboard To Track Social Media Ads Campaign Results Themes PDF will help you deliver an outstanding performance that everyone would remember and praise you for. Do download this presentation today.
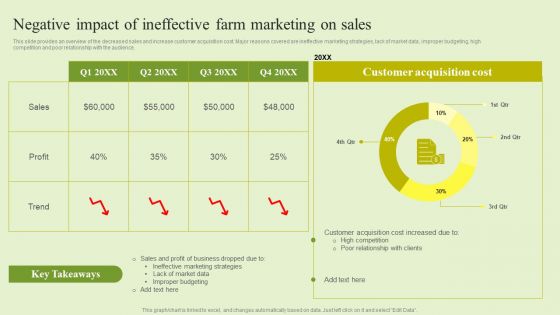
Agriculture Marketing Strategy To Improve Revenue Performance Negative Impact Of Ineffective Farm Marketing On Sales Clipart PDF
This slide provides an overview of the decreased sales and increase customer acquisition cost. Major reasons covered are ineffective marketing strategies, lack of market data, improper budgeting, high competition and poor relationship with the audience. Slidegeeks has constructed Agriculture Marketing Strategy To Improve Revenue Performance Negative Impact Of Ineffective Farm Marketing On Sales Clipart PDF after conducting extensive research and examination. These presentation templates are constantly being generated and modified based on user preferences and critiques from editors. Here, you will find the most attractive templates for a range of purposes while taking into account ratings and remarks from users regarding the content. This is an excellent jumping off point to explore our content and will give new users an insight into our top notch PowerPoint Templates.
Cashless Payment Strategies To Enhance Business Performance Impact Of Credit And Debit Payment On Business Icons PDF
Mentioned slide demonstrates impact of multiple card payment adoption on business growth. It includes key metrics such as business sales, customer satisfaction, convenience and expense tracking accuracy. This modern and well-arranged Cashless Payment Strategies To Enhance Business Performance Impact Of Credit And Debit Payment On Business Icons PDF provides lots of creative possibilities. It is very simple to customize and edit with the Powerpoint Software. Just drag and drop your pictures into the shapes. All facets of this template can be edited with Powerpoint, no extra software is necessary. Add your own material, put your images in the places assigned for them, adjust the colors, and then you can show your slides to the world, with an animated slide included.
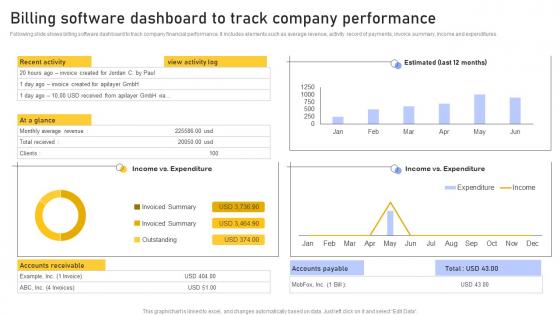
Billing Software Dashboard Enhancing Customer Service Operations Using CRM Technology Microsoft Pdf
Following slide shows billing software dashboard to track company financial performance. It includes elements such as average revenue, activity record of payments, invoice summary, income and expenditures. Create an editable Billing Software Dashboard Enhancing Customer Service Operations Using CRM Technology Microsoft Pdf that communicates your idea and engages your audience. Whether you are presenting a business or an educational presentation, pre designed presentation templates help save time. Billing Software Dashboard Enhancing Customer Service Operations Using CRM Technology Microsoft Pdf is highly customizable and very easy to edit, covering many different styles from creative to business presentations. Slidegeeks has creative team members who have crafted amazing templates. So, go and get them without any delay. Following slide shows billing software dashboard to track company financial performance. It includes elements such as average revenue, activity record of payments, invoice summary, income and expenditures.
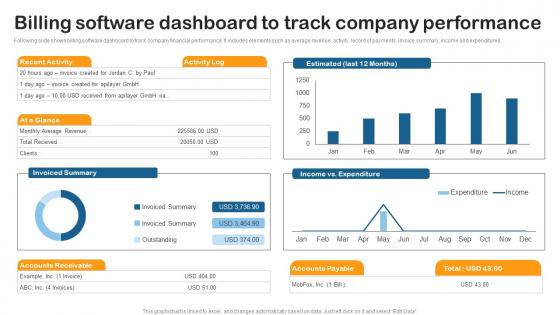
Billing Software Dashboard Track Building Utility Billing And Invoicing Management System Inspiration Pdf
Following slide shows billing software dashboard to track company financial performance. It includes elements such as average revenue, activity record of payments, invoice summary, income and expenditures. Create an editable Billing Software Dashboard Track Building Utility Billing And Invoicing Management System Inspiration Pdf that communicates your idea and engages your audience. Whether you are presenting a business or an educational presentation, pre designed presentation templates help save time. Billing Software Dashboard Track Building Utility Billing And Invoicing Management System Inspiration Pdf is highly customizable and very easy to edit, covering many different styles from creative to business presentations. Slidegeeks has creative team members who have crafted amazing templates. So, go and get them without any delay. Following slide shows billing software dashboard to track company financial performance. It includes elements such as average revenue, activity record of payments, invoice summary, income and expenditures.
Dashboard For Tracking Sales Team Sales Techniques For Achieving Guidelines Pdf
This slide covers the KPI dashboard for tracking sales rep performance. It includes metrics such as sales, target, percent of target, sales, and target for each salesperson. Find highly impressive Dashboard For Tracking Sales Team Sales Techniques For Achieving Guidelines Pdfon Slidegeeks to deliver a meaningful presentation. You can save an ample amount of time using these presentation templates. No need to worry to prepare everything from scratch because Slidegeeks experts have already done a huge research and work for you. You need to download Dashboard For Tracking Sales Team Sales Techniques For Achieving Guidelines Pdf for your upcoming presentation. All the presentation templates are 100 percent editable and you can change the color and personalize the content accordingly. Download now This slide covers the KPI dashboard for tracking sales rep performance. It includes metrics such as sales, target, percent of target, sales, and target for each salesperson.
Shipping And Logistics Tracking Dashboard With Shipments And Fleet Status Pictures PDF
This slide covers Key performance indicators to track the automation system of the company. This dashboard includes Logistics Efficiency Status, delivery time accuracy etc. Deliver an awe inspiring pitch with this creative Shipping And Logistics Tracking Dashboard With Shipments And Fleet Status Pictures PDF bundle. Topics like Profit, Costs, Revenue can be discussed with this completely editable template. It is available for immediate download depending on the needs and requirements of the user.
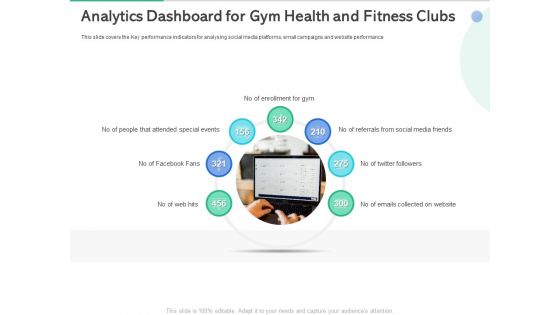
Market Overview Fitness Industry Analytics Dashboard For Gym Health And Fitness Clubs Guidelines PDF
This slide covers the Key performance indicators for analysing social media platforms, email campaigns and website performance. This is a market overview fitness industry analytics dashboard for gym health and fitness clubs guidelines pdf template with various stages. Focus and dispense information on seven stages using this creative set, that comes with editable features. It contains large content boxes to add your information on topics like attended special events, enrollment for gym, social media friends. You can also showcase facts, figures, and other relevant content using this PPT layout. Grab it now.
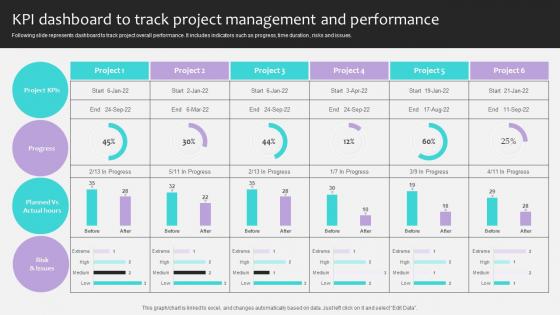
Project Stakeholders Management KPI Dashboard To Track Project Management Ppt Presentation
Following slide represents dashboard to track project overall performance. It includes indicators such as progress, time duration , risks and issues. Slidegeeks has constructed Project Stakeholders Management KPI Dashboard To Track Project Management Ppt Presentation after conducting extensive research and examination. These presentation templates are constantly being generated and modified based on user preferences and critiques from editors. Here, you will find the most attractive templates for a range of purposes while taking into account ratings and remarks from users regarding the content. This is an excellent jumping-off point to explore our content and will give new users an insight into our top-notch PowerPoint Templates. Following slide represents dashboard to track project overall performance. It includes indicators such as progress, time duration , risks and issues.
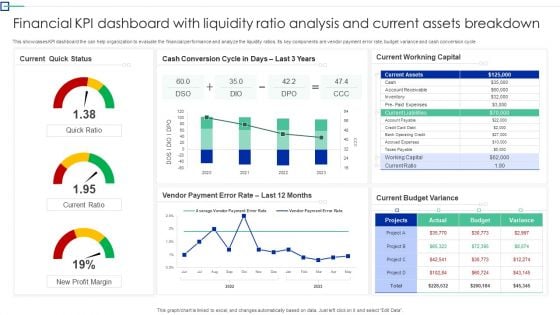
Financial KPI Dashboard With Liquidity Ratio Analysis And Current Assets Breakdown Ideas PDF
This showcases KPI dashboard the can help organization to evaluate the financial performance and analyze the liquidity ratios. Its key components are vendor payment error rate, budget variance and cash conversion cycle. Showcasing this set of slides titled. The topics addressed in these templates are Quick Status, Workning Capital, Budget Variance. All the content presented in this PPT design is completely editable. Download it and make adjustments in color, background, font etc. as per your unique business setting.
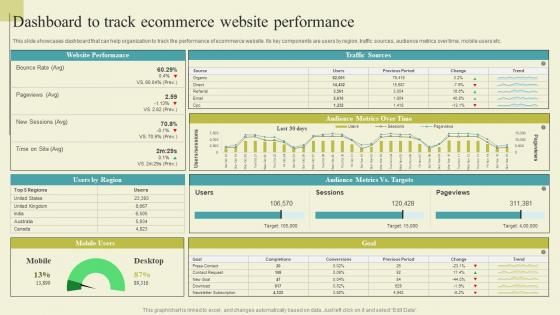
Successful Guide For Ecommerce Promotion Dashboard To Track Ecommerce Website Download Pdf
This slide showcases dashboard that can help organization to track the performance of ecommerce website. Its key components are users by region, traffic sources, audience metrics over time, mobile users etc. If you are looking for a format to display your unique thoughts, then the professionally designed Successful Guide For Ecommerce Promotion Dashboard To Track Ecommerce Website Download Pdf is the one for you. You can use it as a Google Slides template or a PowerPoint template. Incorporate impressive visuals, symbols, images, and other charts. Modify or reorganize the text boxes as you desire. Experiment with shade schemes and font pairings. Alter, share or cooperate with other people on your work. Download Successful Guide For Ecommerce Promotion Dashboard To Track Ecommerce Website Download Pdf and find out how to give a successful presentation. Present a perfect display to your team and make your presentation unforgettable. This slide showcases dashboard that can help organization to track the performance of ecommerce website. Its key components are users by region, traffic sources, audience metrics over time, mobile users etc.
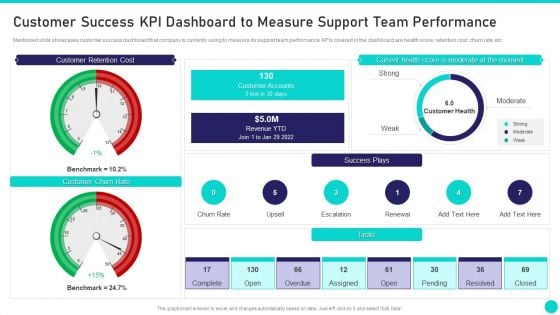
Client Achievements Playbook Customer Success KPI Dashboard To Measure Support Brochure PDF
Mentioned slide showcases customer success dashboard that company is currently using to measure its support team performance. KPIs covered in the dashboard are health score, retention cost, churn rate etc. Deliver an awe inspiring pitch with this creative client achievements playbook customer success kpi dashboard to measure support brochure pdf bundle. Topics like customer retention cost, current health score, customer churn rate, customer accounts, customer health can be discussed with this completely editable template. It is available for immediate download depending on the needs and requirements of the user.
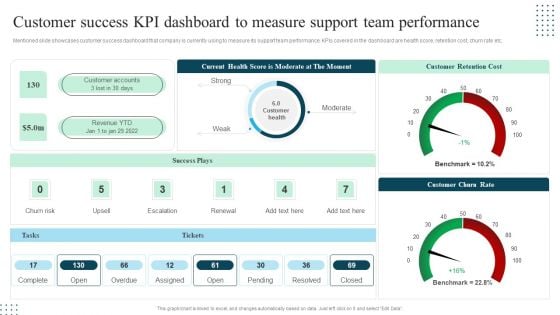
Client Success Playbook Customer Success KPI Dashboard To Measure Support Team Background PDF
Mentioned slide showcases customer success dashboard that company is currently using to measure its support team performance. KPIs covered in the dashboard are health score, retention cost, churn rate etc. Deliver an awe inspiring pitch with this creative Client Success Playbook Customer Success KPI Dashboard To Measure Support Team Background PDF bundle. Topics like Customer Retention Cost, Customer Churn Rate, Success Plays can be discussed with this completely editable template. It is available for immediate download depending on the needs and requirements of the user.
Plan To Enhance Manufacturing Dashboard To Monitor Production Plant Shift Icons PDF
This slide represents the dashboard to monitor production plant efficiency for the multiple shifts. The multiple kpis covered in dashboard are availability, performance of manufacturing plant machines. It also provides information regarding the total downtime along with good parts yield. Presenting this PowerPoint presentation, titled Plan To Enhance Manufacturing Dashboard To Monitor Production Plant Shift Icons PDF, with topics curated by our researchers after extensive research. This editable presentation is available for immediate download and provides attractive features when used. Download now and captivate your audience. Presenting this Plan To Enhance Manufacturing Dashboard To Monitor Production Plant Shift Icons PDF. Our researchers have carefully researched and created these slides with all aspects taken into consideration. This is a completely customizable Plan To Enhance Manufacturing Dashboard To Monitor Production Plant Shift Icons PDF that is available for immediate downloading. Download now and make an impact on your audience. Highlight the attractive features available with our PPTs.


 Continue with Email

 Home
Home


