Performance Dashboard
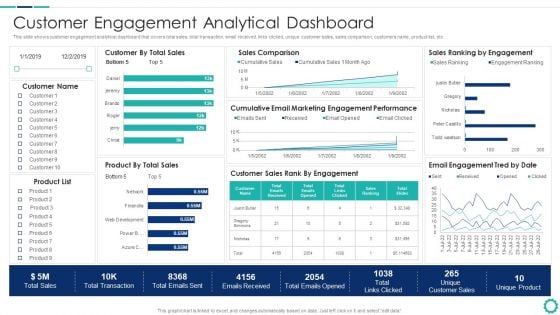
Creating Successful Strategies To Enhance Customer Experience Customer Engagement Analytical Dashboard Slides PDF
This slide shows customer engagement analytical dashboard that covers total sales, total transaction, email received, links clicked, unique customer sales, sales comparison, customers name, product list, etc.Deliver an awe inspiring pitch with this creative Creating Successful Strategies To Enhance Customer Experience Customer Engagement Analytical Dashboard Slides PDF bundle. Topics like Sales Comparison, Engagement Performance, Customer Sales can be discussed with this completely editable template. It is available for immediate download depending on the needs and requirements of the user.
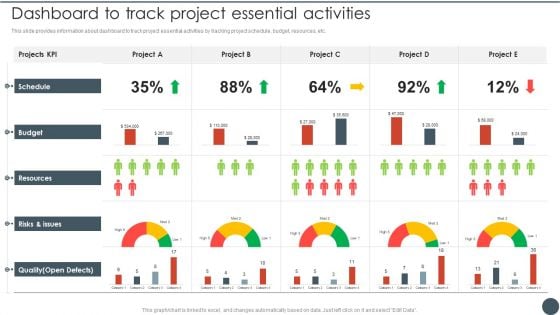
Project Team Engagement Tasks Dashboard To Track Project Essential Activities Themes PDF
This slide provides information regarding effective communication strategies in terms of planning post project communication, audit past communication performance, etc.This is a Project Team Engagement Tasks Dashboard To Track Project Essential Activities Themes PDF template with various stages. Focus and dispense information on three stages using this creative set, that comes with editable features. It contains large content boxes to add your information on topics like Project Communication, Communication Performance, Encourage Active You can also showcase facts, figures, and other relevant content using this PPT layout. Grab it now.
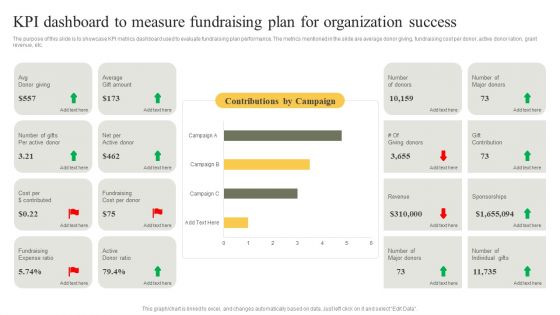
KPI Dashboard To Measure Fundraising Plan For Organization Success Infographics PDF
The purpose of this slide is to showcase KPI metrics dashboard used to evaluate fundraising plan performance. The metrics mentioned in the slide are average donor giving, fundraising cost per donor, active donor ration, grant revenue, etc. Showcasing this set of slides titled KPI Dashboard To Measure Fundraising Plan For Organization Success Infographics PDF. The topics addressed in these templates are Fundraising Cost, Average, Ratio. All the content presented in this PPT design is completely editable. Download it and make adjustments in color, background, font etc. as per your unique business setting.
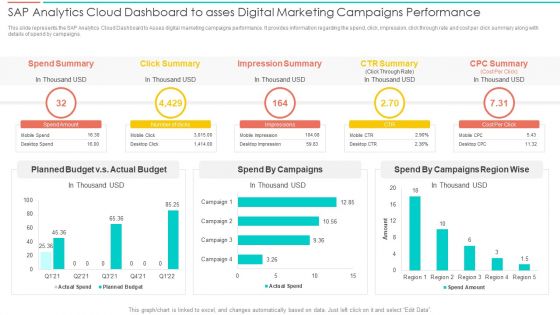
SAC Planning And Implementation SAP Analytics Cloud Dashboard To Asses Digital Marketing Pictures PDF
This slide represents the SAP Analytics Cloud Dashboard to Asses digital marketing campaigns performance. It provides information regarding the spend, click, impression, click through rate and cost per click summary along with details of spend by campaigns. Deliver an awe inspiring pitch with this creative SAC Planning And Implementation SAP Analytics Cloud Dashboard To Asses Digital Marketing Pictures PDF bundle. Topics like Spend Summary, Click Summary, Impression Summary, CTR Summary can be discussed with this completely editable template. It is available for immediate download depending on the needs and requirements of the user.
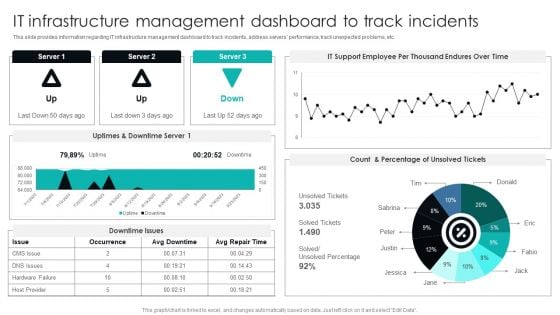
IT Infrastructure Library Procedure Management Playbook IT Infrastructure Management Dashboard To Track Incidents Graphics PDF
This slide provides information regarding IT infrastructure management dashboard to track incidents, address servers performance, track unexpected problems, etc. The best PPT templates are a great way to save time, energy, and resources. Slidegeeks have 100 percent editable powerpoint slides making them incredibly versatile. With these quality presentation templates, you can create a captivating and memorable presentation by combining visually appealing slides and effectively communicating your message. Download IT Infrastructure Library Procedure Management Playbook IT Infrastructure Management Dashboard To Track Incidents Graphics PDF from Slidegeeks and deliver a wonderful presentation.
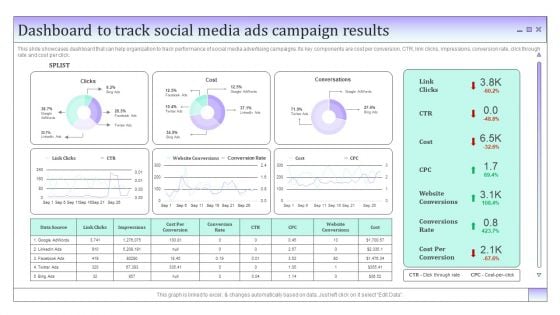
Business To Business Social Dashboard To Track Social Media Ads Campaign Results Demonstration PDF
This slide showcases dashboard that can help organization to track performance of social media advertising campaigns. Its key components are cost per conversion, CTR, link clicks, impressions, conversion rate, click through rate and cost per click. Presenting this PowerPoint presentation, titled Business To Business Social Dashboard To Track Social Media Ads Campaign Results Demonstration PDF, with topics curated by our researchers after extensive research. This editable presentation is available for immediate download and provides attractive features when used. Download now and captivate your audience. Presenting this Business To Business Social Dashboard To Track Social Media Ads Campaign Results Demonstration PDF. Our researchers have carefully researched and created these slides with all aspects taken into consideration. This is a completely customizable Business To Business Social Dashboard To Track Social Media Ads Campaign Results Demonstration PDF that is available for immediate downloading. Download now and make an impact on your audience. Highlight the attractive features available with our PPTs.
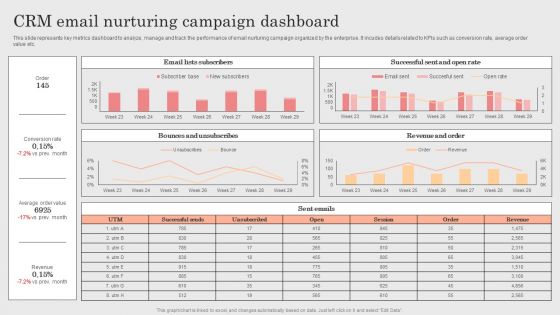
Integrating CRM Solution To Acquire Potential Customers CRM Email Nurturing Campaign Dashboard Template PDF
This slide represents key metrics dashboard to analyze, manage and track the performance of email nurturing campaign organized by the enterprise. It incudes details related to KPIs such as conversion rate, average order value etc. If you are looking for a format to display your unique thoughts, then the professionally designed Integrating CRM Solution To Acquire Potential Customers CRM Email Nurturing Campaign Dashboard Template PDF is the one for you. You can use it as a Google Slides template or a PowerPoint template. Incorporate impressive visuals, symbols, images, and other charts. Modify or reorganize the text boxes as you desire. Experiment with shade schemes and font pairings. Alter, share or cooperate with other people on your work. Download Integrating CRM Solution To Acquire Potential Customers CRM Email Nurturing Campaign Dashboard Template PDF and find out how to give a successful presentation. Present a perfect display to your team and make your presentation unforgettable.
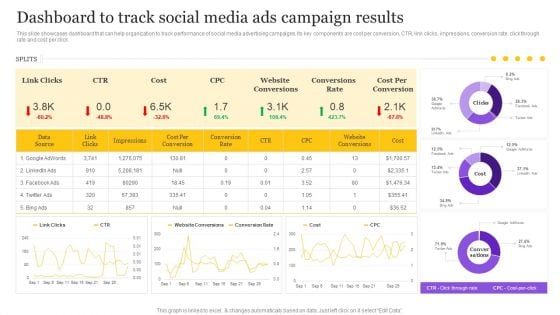
Digital Marketing Strategy Dashboard To Track Social Media Ads Campaign Results Introduction PDF
This slide showcases dashboard that can help organization to track performance of social media advertising campaigns. Its key components are cost per conversion, CTR, link clicks, impressions, conversion rate, click through rate and cost per click. The Digital Marketing Strategy Dashboard To Track Social Media Ads Campaign Results Introduction PDF is a compilation of the most recent design trends as a series of slides. It is suitable for any subject or industry presentation, containing attractive visuals and photo spots for businesses to clearly express their messages. This template contains a variety of slides for the user to input data, such as structures to contrast two elements, bullet points, and slides for written information. Slidegeeks is prepared to create an impression.
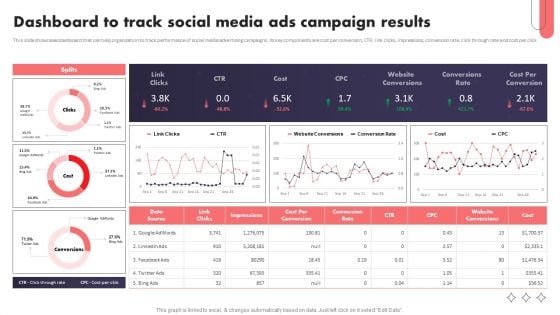
Social Media Promotional Technique Dashboard To Track Social Media Ads Campaign Structure PDF
This slide showcases dashboard that can help organization to track performance of social media advertising campaigns. Its key components are cost per conversion, CTR, link clicks, impressions, conversion rate, click through rate and cost per click. Slidegeeks is one of the best resources for PowerPoint templates. You can download easily and regulate Social Media Promotional Technique Dashboard To Track Social Media Ads Campaign Structure PDF for your personal presentations from our wonderful collection. A few clicks is all it takes to discover and get the most relevant and appropriate templates. Use our Templates to add a unique zing and appeal to your presentation and meetings. All the slides are easy to edit and you can use them even for advertisement purposes.
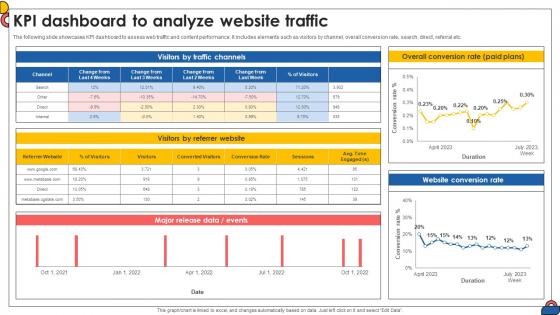
Kpi Dashboard To Analyze Website Traffic Comprehensive Guide To Implement Strategy SS V
The best PPT templates are a great way to save time, energy, and resources. Slidegeeks have 100 percent editable powerpoint slides making them incredibly versatile. With these quality presentation templates, you can create a captivating and memorable presentation by combining visually appealing slides and effectively communicating your message. Download Kpi Dashboard To Analyze Website Traffic Comprehensive Guide To Implement Strategy SS V from Slidegeeks and deliver a wonderful presentation. The following slide showcases KPI dashboard to assess web traffic and content performance. It includes elements such as visitors by channel, overall conversion rate, search, direct, referral etc.
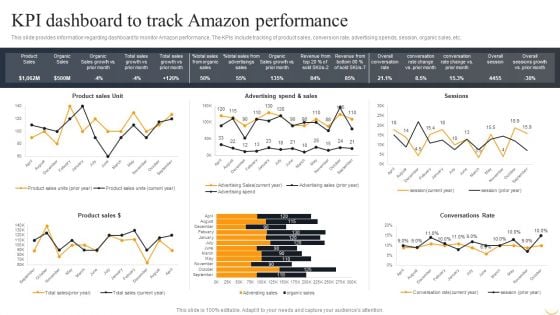
Amazon Business Strategies To Gain Competitive Advantage KPI Dashboard To Track Amazon Background PDF
This slide provides information regarding dashboard to monitor Amazon performance. The KPIs include tracking of product sales, conversion rate, advertising spends, session, organic sales, etc. Do you have to make sure that everyone on your team knows about any specific topic I yes, then you should give Amazon Business Strategies To Gain Competitive Advantage KPI Dashboard To Track Amazon Background PDF a try. Our experts have put a lot of knowledge and effort into creating this impeccable Amazon Business Strategies To Gain Competitive Advantage KPI Dashboard To Track Amazon Background PDF. You can use this template for your upcoming presentations, as the slides are perfect to represent even the tiniest detail. You can download these templates from the Slidegeeks website and these are easy to edit. So grab these today.

ATS Administration To Improve Asset Management Dashboard To Track System Guidelines PDF
This slide covers KPI dashboard to track system performance. It involves detail such as total number of assets, value of assets and purchases in fiscal year. Get a simple yet stunning designed ATS Administration To Improve Asset Management Dashboard To Track System Guidelines PDF. It is the best one to establish the tone in your meetings. It is an excellent way to make your presentations highly effective. So, download this PPT today from Slidegeeks and see the positive impacts. Our easy-to-edit ATS Administration To Improve Asset Management Dashboard To Track System Guidelines PDF can be your go-to option for all upcoming conferences and meetings. So, what are you waiting for Grab this template today.
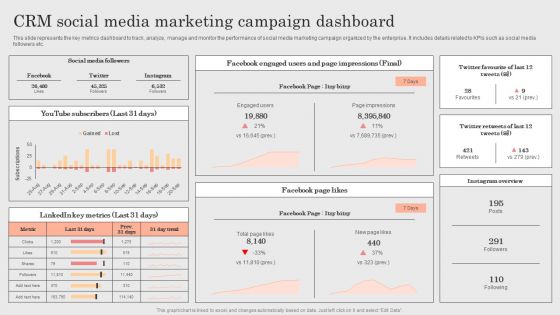
Integrating CRM Solution To Acquire Potential Customers CRM Social Media Marketing Campaign Dashboard Template PDF
This slide represents the key metrics dashboard to track, analyze, manage and monitor the performance of social media marketing campaign organized by the enterprise. It includes details related to KPIs such as social media followers etc. Formulating a presentation can take up a lot of effort and time, so the content and message should always be the primary focus. The visuals of the PowerPoint can enhance the presenters message, so our Integrating CRM Solution To Acquire Potential Customers CRM Social Media Marketing Campaign Dashboard Template PDF was created to help save time. Instead of worrying about the design, the presenter can concentrate on the message while our designers work on creating the ideal templates for whatever situation is needed. Slidegeeks has experts for everything from amazing designs to valuable content, we have put everything into Integrating CRM Solution To Acquire Potential Customers CRM Social Media Marketing Campaign Dashboard Template PDF
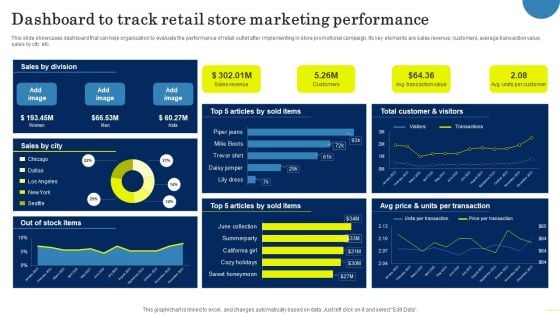
Field Marketing Strategies To Boost Product Sales Dashboard To Track Retail Store Marketing Download PDF
This slide showcases dashboard that can help organization to evaluate the performance of retail outlet after implementing in store promotional campaign. Its key elements are sales revenue, customers, average transaction value, sales by city etc. Do you have an important presentation coming up Are you looking for something that will make your presentation stand out from the rest Look no further than Field Marketing Strategies To Boost Product Sales Dashboard To Track Retail Store Marketing Download PDF. With our professional designs, you can trust that your presentation will pop and make delivering it a smooth process. And with Slidegeeks, you can trust that your presentation will be unique and memorable. So why wait Grab Field Marketing Strategies To Boost Product Sales Dashboard To Track Retail Store Marketing Download PDF today and make your presentation stand out from the rest.
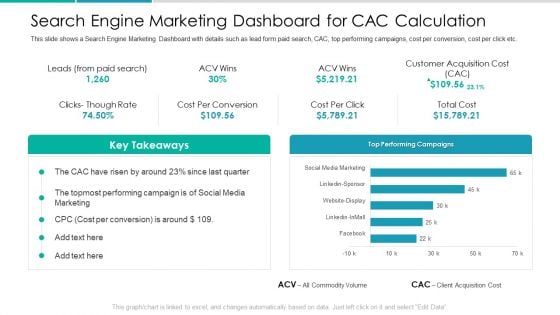
Client Acquisition Cost For Customer Retention Search Engine Marketing Dashboard For CAC Calculation Infographics PDF
This slide shows a Search Engine Marketing Dashboard with details such as lead form paid search, CAC, top performing campaigns, cost per conversion, cost per click etc. Deliver an awe inspiring pitch with this creative client acquisition cost for customer retention search engine marketing dashboard for cac calculation infographics pdf bundle. Topics like performing, campaign, social media, marketing, customer acquisition cost can be discussed with this completely editable template. It is available for immediate download depending on the needs and requirements of the user.
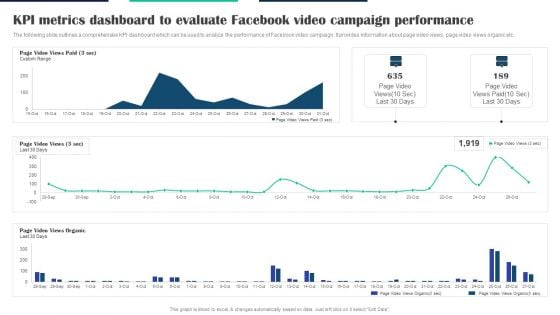
Executing Video Promotional KPI Metrics Dashboard To Evaluate Facebook Video Campaign Summary PDF
The following slide outlines a comprehensive KPI dashboard which can be used to analyze the performance of Facebook video campaign. It provides information about page video views, page video views organic etc. Coming up with a presentation necessitates that the majority of the effort goes into the content and the message you intend to convey. The visuals of a PowerPoint presentation can only be effective if it supplements and supports the story that is being told. Keeping this in mind our experts created Executing Video Promotional KPI Metrics Dashboard To Evaluate Facebook Video Campaign Summary PDF to reduce the time that goes into designing the presentation. This way, you can concentrate on the message while our designers take care of providing you with the right template for the situation.
Strategies To Maintain Transportation Shipping And Logistics Tracking Dashboard With Shipments Ppt Infographics Information PDF
This slide covers Key performance indicators to track the automation system of the company. This dashboard includes Logistics Efficiency Status, delivery time accuracy etc. Presenting this PowerPoint presentation, titled Strategies To Maintain Transportation Shipping And Logistics Tracking Dashboard With Shipments Ppt Infographics Information PDF, with topics curated by our researchers after extensive research. This editable presentation is available for immediate download and provides attractive features when used. Download now and captivate your audience. Presenting this Strategies To Maintain Transportation Shipping And Logistics Tracking Dashboard With Shipments Ppt Infographics Information PDF. Our researchers have carefully researched and created these slides with all aspects taken into consideration. This is a completely customizable Strategies To Maintain Transportation Shipping And Logistics Tracking Dashboard With Shipments Ppt Infographics Information PDF that is available for immediate downloading. Download now and make an impact on your audience. Highlight the attractive features available with our PPTs.
Shipping And Logistics Tracking Dashboard With Shipments And Fleet Status Ideas PDF
This slide covers Key performance indicators to track the automation system of the company. This dashboard includes Logistics Efficiency Status, delivery time accuracy etc. Get a simple yet stunning designed Shipping And Logistics Tracking Dashboard With Shipments And Fleet Status Ideas PDF. It is the best one to establish the tone in your meetings. It is an excellent way to make your presentations highly effective. So, download this PPT today from Slidegeeks and see the positive impacts. Our easy to edit Shipping And Logistics Tracking Dashboard With Shipments And Fleet Status Ideas PDF can be your go to option for all upcoming conferences and meetings. So, what are you waiting for Grab this template today.
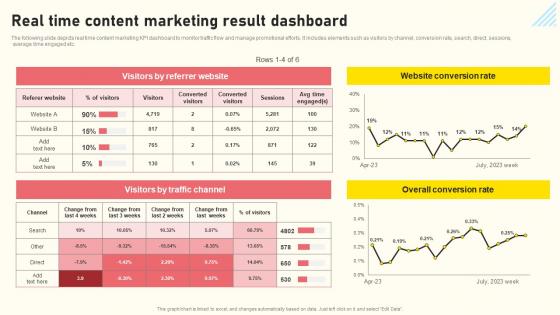
Effective Real Time Marketing Principles Real Time Content Marketing Result Dashboard Mockup Pdf
The following slide depicts real time content marketing KPI dashboard to monitor traffic flow and manage promotional efforts. It includes elements such as visitors by channel, conversion rate, search, direct, sessions, average time engaged etc. From laying roadmaps to briefing everything in detail, our templates are perfect for you. You can set the stage with your presentation slides. All you have to do is download these easy-to-edit and customizable templates. Effective Real Time Marketing Principles Real Time Content Marketing Result Dashboard Mockup Pdf will help you deliver an outstanding performance that everyone would remember and praise you for. Do download this presentation today. The following slide depicts real time content marketing KPI dashboard to monitor traffic flow and manage promotional efforts. It includes elements such as visitors by channel, conversion rate, search, direct, sessions, average time engaged etc.
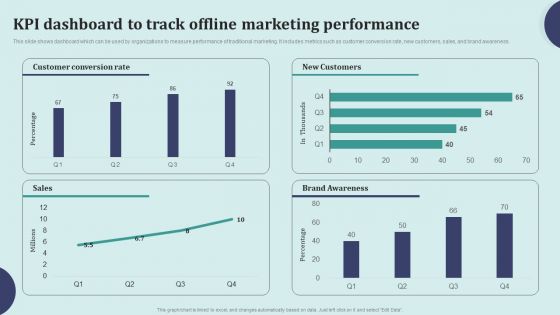
Offline Marketing Techniques To Elevate Brand Visibility KPI Dashboard To Track Offline Formats PDF
This slide shows dashboard which can be used by organizations to measure performance of traditional marketing. It includes metrics such as customer conversion rate, new customers, sales, and brand awareness. Coming up with a presentation necessitates that the majority of the effort goes into the content and the message you intend to convey. The visuals of a PowerPoint presentation can only be effective if it supplements and supports the story that is being told. Keeping this in mind our experts created Offline Marketing Techniques To Elevate Brand Visibility KPI Dashboard To Track Offline Formats PDF to reduce the time that goes into designing the presentation. This way, you can concentrate on the message while our designers take care of providing you with the right template for the situation.
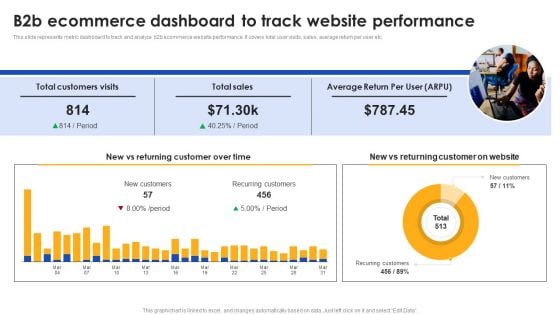
E Commerce Operations In B2b B2b Ecommerce Dashboard To Track Website Infographics PDF
This slide represents metric dashboard to track and analyze b2b ecommerce website performance. It covers total user visits, sales, average return per user etc. Find a pre designed and impeccable E Commerce Operations In B2b B2b Ecommerce Dashboard To Track Website Infographics PDF. The templates can ace your presentation without additional effort. You can download these easy to edit presentation templates to make your presentation stand out from others. So, what are you waiting for Download the template from Slidegeeks today and give a unique touch to your presentation.
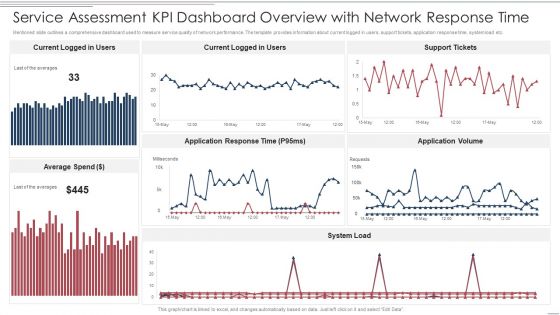
Service Assessment Kpi Dashboard Overview With Network Response Time Themes PDF
Mentioned slide outlines a comprehensive dashboard used to measure service quality of network performance. The template provides information about current logged in users, support tickets, application response time, system load etc. Pitch your topic with ease and precision using this Service Assessment Kpi Dashboard Overview With Network Response Time Themes PDF. This layout presents information on Average Spend, System Load, Application Response Time. It is also available for immediate download and adjustment. So, changes can be made in the color, design, graphics or any other component to create a unique layout.
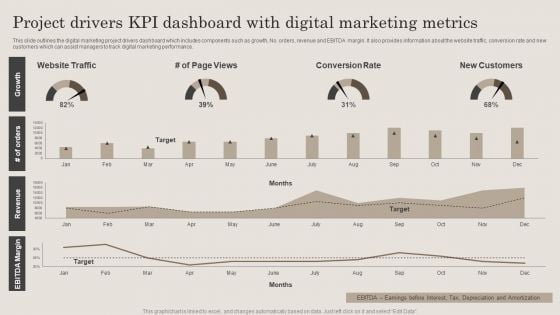
Project Drivers Kpi Dashboard With Digital Marketing Metrics Ppt PowerPoint Presentation File Clipart PDF
This slide outlines the digital marketing project drivers dashboard which includes components such as growth, No. orders, revenue and EBITDA margin. It also provides information about the website traffic, conversion rate and new customers which can assist managers to track digital marketing performance. Showcasing this set of slides titled Project Drivers Kpi Dashboard With Digital Marketing Metrics Ppt PowerPoint Presentation File Clipart PDF. The topics addressed in these templates are Website Traffic, Conversion Rate, New Customers. All the content presented in this PPT design is completely editable. Download it and make adjustments in color, background, font etc. as per your unique business setting.
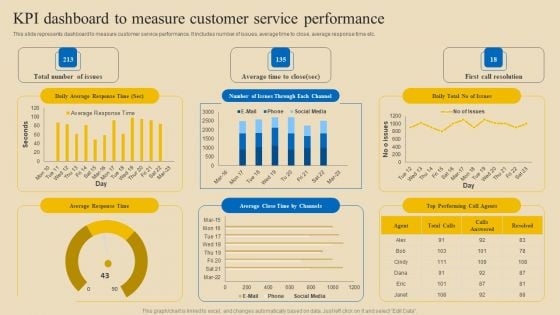
Implementing Digital Customer Service Kpi Dashboard To Measure Customer Service Structure PDF
This slide represents dashboard to measure customer service performance. It includes number of issues, average time to close, average response time etc. Explore a selection of the finest Implementing Digital Customer Service Kpi Dashboard To Measure Customer Service Structure PDF here. With a plethora of professionally designed and pre-made slide templates, you can quickly and easily find the right one for your upcoming presentation. You can use our Implementing Digital Customer Service Kpi Dashboard To Measure Customer Service Structure PDF to effectively convey your message to a wider audience. Slidegeeks has done a lot of research before preparing these presentation templates. The content can be personalized and the slides are highly editable. Grab templates today from Slidegeeks.
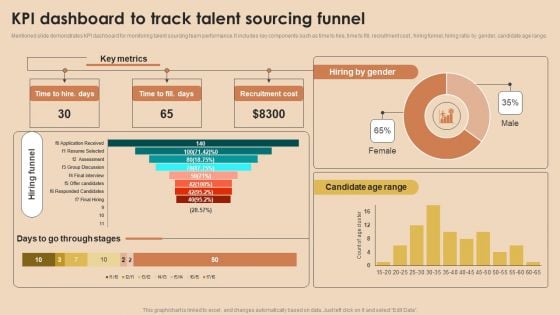
Detailed Guide For Talent Acquisition KPI Dashboard To Track Talent Sourcing Funnel Elements PDF
Mentioned slide demonstrates KPI dashboard for monitoring talent sourcing team performance. It includes key components such as time to hire, time to fill, recruitment cost , hiring funnel, hiring ratio by gender, candidate age range. Do you know about Slidesgeeks Detailed Guide For Talent Acquisition KPI Dashboard To Track Talent Sourcing Funnel Elements PDF These are perfect for delivering any kind od presentation. Using it, create PowerPoint presentations that communicate your ideas and engage audiences. Save time and effort by using our pre designed presentation templates that are perfect for a wide range of topic. Our vast selection of designs covers a range of styles, from creative to business, and are all highly customizable and easy to edit. Download as a PowerPoint template or use them as Google Slides themes.
Dashboard For Tracking Impact Of Warehouse Leveraging Logistics Automation Information Pdf
This slide covers the dashboard with after automation warehouse overview. It include KPIs such as autonomous robots status, robotic arms status, battery level, performance, time to return, etc.Get a simple yet stunning designed Dashboard For Tracking Impact Of Warehouse Leveraging Logistics Automation Information Pdf. It is the best one to establish the tone in your meetings. It is an excellent way to make your presentations highly effective. So, download this PPT today from Slidegeeks and see the positive impacts. Our easy-to-edit Dashboard For Tracking Impact Of Warehouse Leveraging Logistics Automation Information Pdf can be your go-to option for all upcoming conferences and meetings. So, what are you waiting for Grab this template today. This slide covers the dashboard with after automation warehouse overview. It include KPIs such as autonomous robots status, robotic arms status, battery level, performance, time to return, etc.
Brand Management To Enhance Customer Tracking Dashboard To Monitor Brand Loyalty Microsoft PDF
This slide provides information brand loyalty tracking dashboard in order to monitor customer engagement, average revenues, new vs. returning visitors performance, etc. This Brand Management To Enhance Customer Tracking Dashboard To Monitor Brand Loyalty Microsoft PDF is perfect for any presentation, be it in front of clients or colleagues. It is a versatile and stylish solution for organizing your meetings. The Brand Management To Enhance Customer Tracking Dashboard To Monitor Brand Loyalty Microsoft PDF features a modern design for your presentation meetings. The adjustable and customizable slides provide unlimited possibilities for acing up your presentation. Slidegeeks has done all the homework before launching the product for you. So, dont wait, grab the presentation templates today
Marketers Guide To Data Analysis Optimization Dashboard For Tracking Business Blog Kpis Infographics PDF
This slide covers the dashboard for analyzing blogging KPIs such as performance, published posts, views, new blog subscribers, top blog posts by pageviews, top blog posts by CTR, etc. Coming up with a presentation necessitates that the majority of the effort goes into the content and the message you intend to convey. The visuals of a PowerPoint presentation can only be effective if it supplements and supports the story that is being told. Keeping this in mind our experts created Marketers Guide To Data Analysis Optimization Dashboard For Tracking Business Blog Kpis Infographics PDF to reduce the time that goes into designing the presentation. This way, you can concentrate on the message while our designers take care of providing you with the right template for the situation.
Marketing Success Metrics Dashboard For Tracking Business Blog Kpis Brochure PDF
This slide covers the dashboard for analyzing blogging KPIs such as performance, published posts, views, new blog subscribers, top blog posts by pageviews, top blog posts by CTR, etc. Retrieve professionally designed Marketing Success Metrics Dashboard For Tracking Business Blog Kpis Brochure PDF to effectively convey your message and captivate your listeners. Save time by selecting pre-made slideshows that are appropriate for various topics, from business to educational purposes. These themes come in many different styles, from creative to corporate, and all of them are easily adjustable and can be edited quickly. Access them as PowerPoint templates or as Google Slides themes. You dont have to go on a hunt for the perfect presentation because Slidegeeks got you covered from everywhere.
Online Marketing Analytics To Enhance Business Growth Dashboard For Tracking Business Blog Kpis Template PDF
This slide covers the dashboard for analyzing blogging KPIs such as performance, published posts, views, new blog subscribers, top blog posts by pageviews, top blog posts by CTR, etc. Slidegeeks is one of the best resources for PowerPoint templates. You can download easily and regulate Online Marketing Analytics To Enhance Business Growth Dashboard For Tracking Business Blog Kpis Template PDF for your personal presentations from our wonderful collection. A few clicks is all it takes to discover and get the most relevant and appropriate templates. Use our Templates to add a unique zing and appeal to your presentation and meetings. All the slides are easy to edit and you can use them even for advertisement purposes.
Optimizing Marketing Analytics To Enhance Organizational Growth Dashboard For Tracking Business Designs PDF
This slide covers the dashboard for analyzing blogging KPIs such as performance, published posts, views, new blog subscribers, top blog posts by pageviews, top blog posts by CTR, etc. Do you know about Slidesgeeks Optimizing Marketing Analytics To Enhance Organizational Growth Dashboard For Tracking Business Designs PDF These are perfect for delivering any kind od presentation. Using it, create PowerPoint presentations that communicate your ideas and engage audiences. Save time and effort by using our pre designed presentation templates that are perfect for a wide range of topic. Our vast selection of designs covers a range of styles, from creative to business, and are all highly customizable and easy to edit. Download as a PowerPoint template or use them as Google Slides themes.
Social Media In Customer Support Social Media Customer Service Tracking Dashboard Structure Pdf
This slide represents the social dashboard for tracking media customer service by covering the total number of requests and requests answered, total revenue, support costs rate to revenue rate, customer satisfaction, the average time to solve an issue, and so on. This Social Media In Customer Support Social Media Customer Service Tracking Dashboard Structure Pdf from Slidegeeks makes it easy to present information on your topic with precision. It provides customization options, so you can make changes to the colors, design, graphics, or any other component to create a unique layout. It is also available for immediate download, so you can begin using it right away. Slidegeeks has done good research to ensure that you have everything you need to make your presentation stand out. Make a name out there for a brilliant performance. This slide represents the social dashboard for tracking media customer service by covering the total number of requests and requests answered, total revenue, support costs rate to revenue rate, customer satisfaction, the average time to solve an issue, and so on.
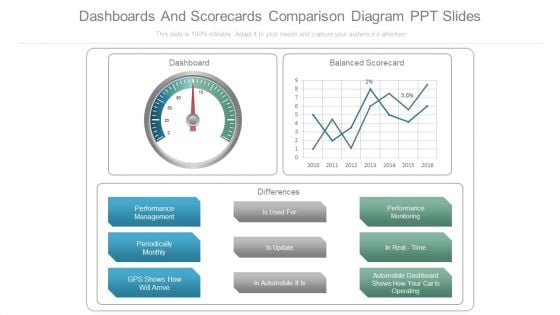
Dashboards And Scorecards Comparison Diagram Ppt Slides
This is a dashboards and scorecards comparison diagram ppt slides. This is a three stage process. The stages in this process are dashboard, balanced scorecard, differences, performance management, periodically monthly, gps shows how will arrive, is used for, is update, in automobile it is, performance monitoring, in real time, automobile dashboard shows how your car is operating.
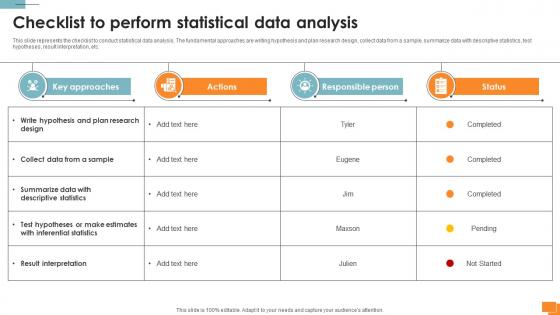
Statistical Tools For Evidence Checklist To Perform Statistical Data Analysis
This slide represents the checklist to conduct statistical data analysis. The fundamental approaches are writing hypothesis and plan research design, collect data from a sample, summarize data with descriptive statistics, test hypotheses, result interpretation, etc. Whether you have daily or monthly meetings, a brilliant presentation is necessary. Statistical Tools For Evidence Checklist To Perform Statistical Data Analysis can be your best option for delivering a presentation. Represent everything in detail using Statistical Tools For Evidence Checklist To Perform Statistical Data Analysis and make yourself stand out in meetings. The template is versatile and follows a structure that will cater to your requirements. All the templates prepared by Slidegeeks are easy to download and edit. Our research experts have taken care of the corporate themes as well. So, give it a try and see the results. This slide represents the checklist to conduct statistical data analysis. The fundamental approaches are writing hypothesis and plan research design, collect data from a sample, summarize data with descriptive statistics, test hypotheses, result interpretation, etc.
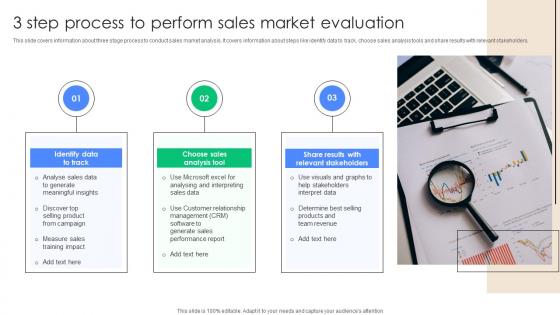
3 Step Process To Perform Sales Market Evaluation Introduction Pdf
This slide covers information about three stage process to conduct sales market analysis. It covers information about steps like identify data to track, choose sales analysis tools and share results with relevant stakeholders. Showcasing this set of slides titled 3 Step Process To Perform Sales Market Evaluation Introduction Pdf. The topics addressed in these templates are Identify Data Track, Choose Sales Analysis Tool, Share Results Relevant. All the content presented in this PPT design is completely editable. Download it and make adjustments in color, background, font etc. as per your unique business setting. This slide covers information about three stage process to conduct sales market analysis. It covers information about steps like identify data to track, choose sales analysis tools and share results with relevant stakeholders.
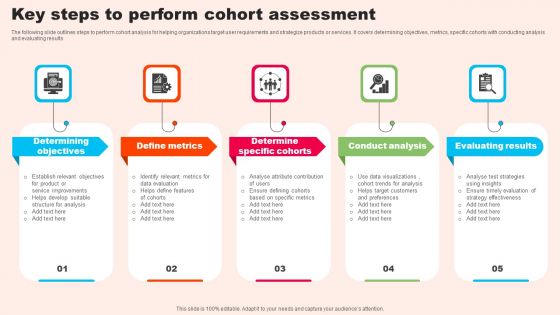
Key Steps To Perform Cohort Assessment Structure PDF
The following slide outlines steps to perform cohort analysis for helping organizations target user requirements and strategize products or services. It covers determining objectives, metrics, specific cohorts with conducting analysis and evaluating results. Persuade your audience using this Key Steps To Perform Cohort Assessment Structure PDF. This PPT design covers five stages, thus making it a great tool to use. It also caters to a variety of topics including Define Metrics, Determine Specific Cohorts, Conduct Analysis. Download this PPT design now to present a convincing pitch that not only emphasizes the topic but also showcases your presentation skills.
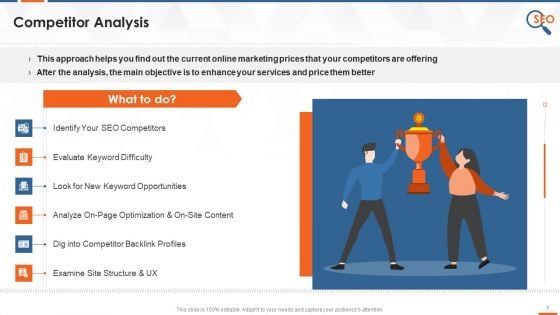
Healthcare Company SEO Approach Perform Competitor Analysis Training Ppt
This slide covers competitor analysis as SEO strategy for healthcare industry. It also depicts that this research will assist businesses in better identifying opportunities and preparing for potential threats.
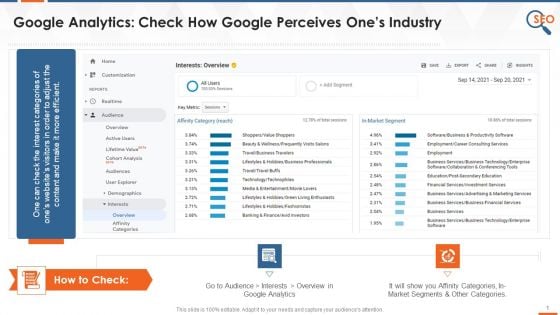
Google Analytics SEO Tool To Perform Industry Analysis Training Ppt
This slide showcases how the Google Analytics tool is used in SEO for industry analysis.
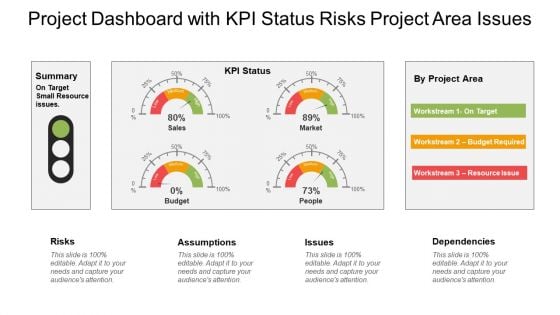
Project Summary Dashboard With Kpi Status Ppt PowerPoint Presentation Slides Show
This is a project summary dashboard with kpi status ppt powerpoint presentation slides show. This is a three stage process. The stages in this process are project analysis, project review, project performance management.
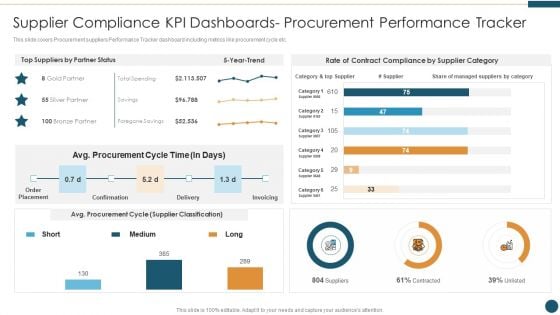
Supplier Relationship Management Supplier Compliance KPI Dashboards Structure PDF
This slide covers Procurement suppliers Performance Tracker dashboard including metrics like procurement cycle etc. Deliver an awe inspiring pitch with this creative Supplier Relationship Management Supplier Compliance KPI Dashboards Structure PDF bundle. Topics like Supplier Compliance Kpi Dashboards Procurement Performance Tracker can be discussed with this completely editable template. It is available for immediate download depending on the needs and requirements of the user.
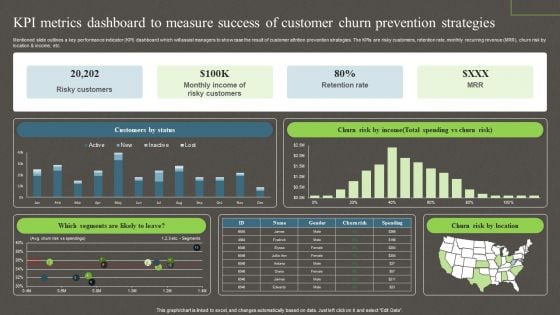
Kpi Metrics Dashboard To Measure Success Of Customer Churn Prevention Strategies Ppt PowerPoint Presentation File Model PDF
Mentioned slide outlines a key performance indicator KPI dashboard which will assist managers to showcase the result of customer attrition prevention strategies. The KPIs are risky customers, retention rate, monthly recurring revenue MRR, churn risk by location and income, etc. This Kpi Metrics Dashboard To Measure Success Of Customer Churn Prevention Strategies Ppt PowerPoint Presentation File Model PDF from Slidegeeks makes it easy to present information on your topic with precision. It provides customization options, so you can make changes to the colors, design, graphics, or any other component to create a unique layout. It is also available for immediate download, so you can begin using it right away. Slidegeeks has done good research to ensure that you have everything you need to make your presentation stand out. Make a name out there for a brilliant performance.
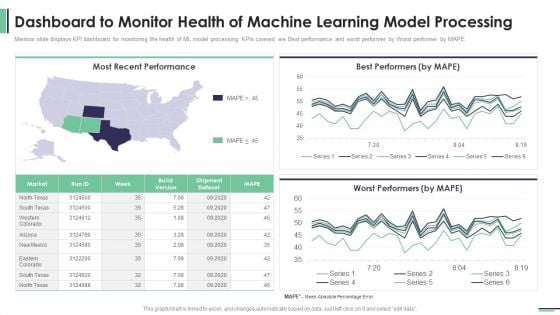
Machine Learning Development And Operations Cycle IT Dashboard To Monitor Health Of Machine Demonstration PDF
Mention slide displays KPI dashboard for monitoring the health of ML model processing. KPIs covered are Best performance and worst performer by Worst performer by MAPE.Deliver an awe inspiring pitch with this creative machine learning development and operations cycle it dashboard to monitor health of machine demonstration pdf bundle. Topics like most recent performance, best performers, worst performers can be discussed with this completely editable template. It is available for immediate download depending on the needs and requirements of the user.
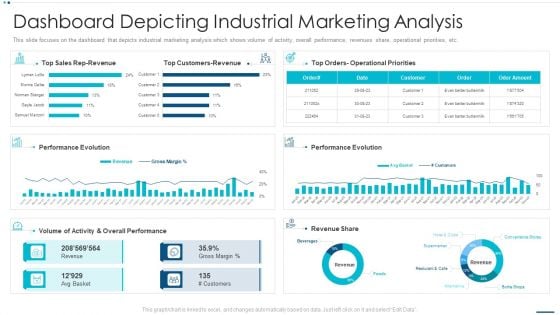
Strategic B2B Marketing Plan Dashboard Depicting Industrial Marketing Analysis Introduction PDF
This slide focuses on the dashboard that depicts industrial marketing analysis which shows volume of activity, overall performance, revenues share, operational priorities, etc.Deliver and pitch your topic in the best possible manner with this strategic b2b marketing plan dashboard depicting industrial marketing analysis introduction pdf Use them to share invaluable insights on performance evolution, volume of activity, overall performance and impress your audience. This template can be altered and modified as per your expectations. So, grab it now.
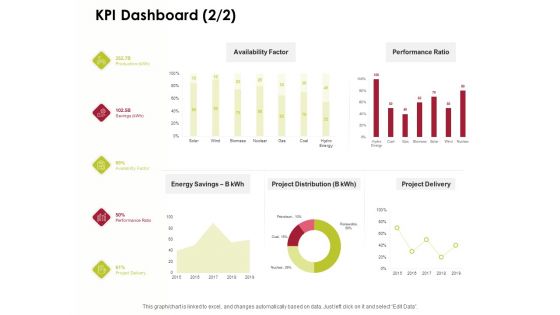
Power Management System And Technology KPI Dashboard Project Ppt PowerPoint Presentation Layouts Graphic Tips PDF
Presenting this set of slides with name power management system and technology kpi dashboard project ppt powerpoint presentation layouts graphic tips pdf. The topics discussed in these slides are availability factor, performance ratio, energy savings b kwh, project distribution, project delivery, performance ratio. This is a completely editable PowerPoint presentation and is available for immediate download. Download now and impress your audience.
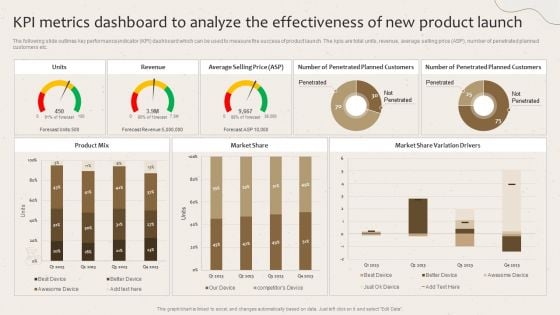
Kpi Metrics Dashboard To Analyze The Effectiveness Of New Product Launch Launching New Beverage Product Diagrams PDF
The following slide outlines key performance indicator KPI dashboard which can be used to measure the success of product launch. The kpis are total units, revenue, average selling price ASP, number of penetrated planned customers etc. Create an editable Kpi Metrics Dashboard To Analyze The Effectiveness Of New Product Launch Launching New Beverage Product Diagrams PDF that communicates your idea and engages your audience. Whether you are presenting a business or an educational presentation, pre-designed presentation templates help save time. Kpi Metrics Dashboard To Analyze The Effectiveness Of New Product Launch Launching New Beverage Product Diagrams PDF is highly customizable and very easy to edit, covering many different styles from creative to business presentations. Slidegeeks has creative team members who have crafted amazing templates. So, go and get them without any delay.
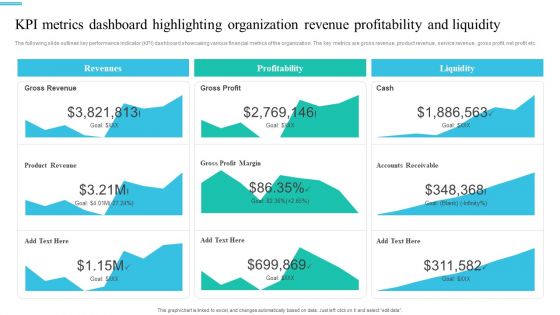
Monetary Planning And Evaluation Guide KPI Metrics Dashboard Highlighting Organization Revenue Profitability And Liquidity Ppt Diagram Images PDF
The following slide outlines key performance indicator KPI dashboard showcasing various financial metrics of the organization. The key metrics are gross revenue, product revenue, service revenue, gross profit, net profit etc. Coming up with a presentation necessitates that the majority of the effort goes into the content and the message you intend to convey. The visuals of a PowerPoint presentation can only be effective if it supplements and supports the story that is being told. Keeping this in mind our experts created Monetary Planning And Evaluation Guide KPI Metrics Dashboard Highlighting Organization Revenue Profitability And Liquidity Ppt Diagram Images PDF to reduce the time that goes into designing the presentation. This way, you can concentrate on the message while our designers take care of providing you with the right template for the situation.
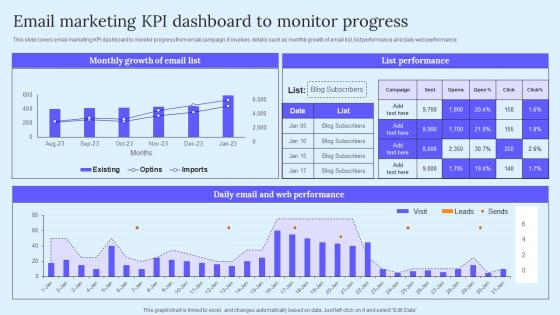
Email Marketing KPI Dashboard B2B Marketing Techniques To Attract Potential Professional Pdf
This slide covers email marketing KPI dashboard to monitor progress from email campaign. It involves details such as monthly growth of email list, list performance and daily web performance. Coming up with a presentation necessitates that the majority of the effort goes into the content and the message you intend to convey. The visuals of a PowerPoint presentation can only be effective if it supplements and supports the story that is being told. Keeping this in mind our experts created Email Marketing KPI Dashboard B2B Marketing Techniques To Attract Potential Professional Pdf to reduce the time that goes into designing the presentation. This way, you can concentrate on the message while our designers take care of providing you with the right template for the situation. This slide covers email marketing KPI dashboard to monitor progress from email campaign. It involves details such as monthly growth of email list, list performance and daily web performance.
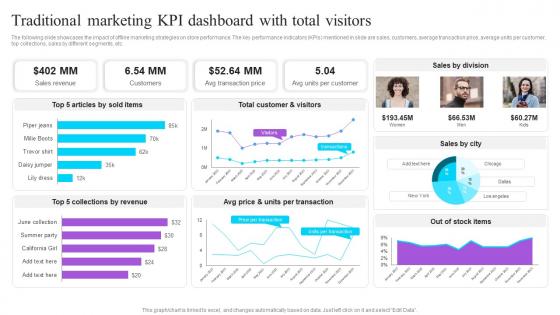
Traditional Marketing KPI Dashboard With Total Visitors Effective GTM Techniques Pictures PDF
The following slide showcases the impact of offline marketing strategies on store performance. The key performance indicators KPIs mentioned in slide are sales, customers, average transaction price, average units per customer, top collections, sales by different segments, etc. Create an editable Traditional Marketing KPI Dashboard With Total Visitors Effective GTM Techniques Pictures PDF that communicates your idea and engages your audience. Whether you are presenting a business or an educational presentation, pre-designed presentation templates help save time. Traditional Marketing KPI Dashboard With Total Visitors Effective GTM Techniques Pictures PDF is highly customizable and very easy to edit, covering many different styles from creative to business presentations. Slidegeeks has creative team members who have crafted amazing templates. So, go and get them without any delay. The following slide showcases the impact of offline marketing strategies on store performance. The key performance indicators KPIs mentioned in slide are sales, customers, average transaction price, average units per customer, top collections, sales by different segments, etc.
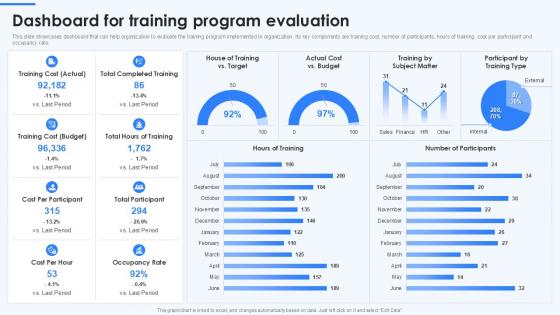
Dashboard For Training Program Evaluation On Job Employee Training Program For Skills
The Dashboard For Training Program Evaluation On Job Employee Training Program For Skills is a compilation of the most recent design trends as a series of slides. It is suitable for any subject or industry presentation, containing attractive visuals and photo spots for businesses to clearly express their messages. This template contains a variety of slides for the user to input data, such as structures to contrast two elements, bullet points, and slides for written information. Slidegeeks is prepared to create an impression. Our Dashboard for Training Program Evaluation on Job Employee Training Program for Skills shall offer a graphical representation providing insights to measure the effectiveness of an organizations training initiatives. This particular slide captures such important performance metrics such as the cost associated with training, number of participants, total hours undertaken in the training program, per participant cost, and occupation rate that help evaluate the entire program conducted.
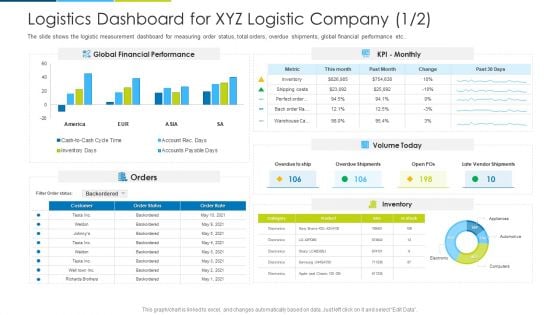
Logistics Dashboard For XYZ Logistic Company Orders Ppt Infographic Template Diagrams PDF
The slide shows the logistic measurement dashboard for measuring order status, total orders, overdue shipments, global financial performance etc. Deliver and pitch your topic in the best possible manner with this logistics dashboard for xyz logistic company orders ppt infographic template diagrams pdf. Use them to share invaluable insights on global financial performance, orders, inventory and impress your audience. This template can be altered and modified as per your expectations. So, grab it now.
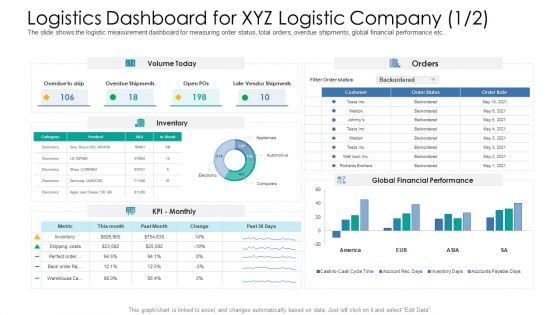
Logistics Dashboard For XYZ Logistic Company Inventory Ppt Infographic Template Background PDF
The slide shows the logistic measurement dashboard for measuring order status, total orders, overdue shipments, global financial performance etc.Deliver and pitch your topic in the best possible manner with this logistics dashboard for XYZ logistic company inventory ppt infographic template background pdf. Use them to share invaluable insights on global financial performance, orders, volume today and impress your audience. This template can be altered and modified as per your expectations. So, grab it now.
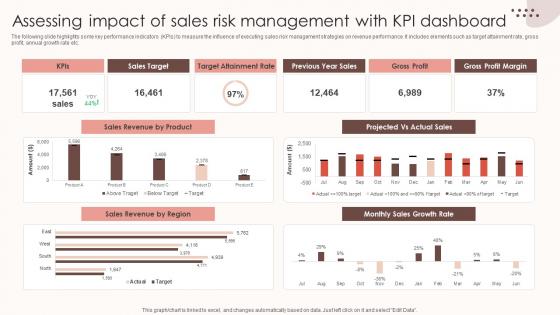
Assessing Sales Risks Assessing Impact Of Sales Risk Management With Kpi Dashboard Topics PDF
The following slide highlights some key performance indicators KPIs to measure the influence of executing sales risk management strategies on revenue performance. It includes elements such as target attainment rate, gross profit, annual growth rate etc. Create an editable Assessing Sales Risks Assessing Impact Of Sales Risk Management With Kpi Dashboard Topics PDF that communicates your idea and engages your audience. Whether you are presenting a business or an educational presentation, pre-designed presentation templates help save time. Assessing Sales Risks Assessing Impact Of Sales Risk Management With Kpi Dashboard Topics PDF is highly customizable and very easy to edit, covering many different styles from creative to business presentations. Slidegeeks has creative team members who have crafted amazing templates. So, go and get them without any delay. The following slide highlights some key performance indicators KPIs to measure the influence of executing sales risk management strategies on revenue performance. It includes elements such as target attainment rate, gross profit, annual growth rate etc.

Adwords Campaign Dashboard Internet Marketing Strategies To Grow Your Business Structure PDF
Analyze the performance your AdWords campaigns by seeing which keywords resulted in the most clicks, impressions, leads, and Cost Per Click. Deliver an awe inspiring pitch with this creative adwords campaign dashboard internet marketing strategies to grow your business structure pdf bundle. Topics like performance, trend, metric, goals can be discussed with this completely editable template. It is available for immediate download depending on the needs and requirements of the user.
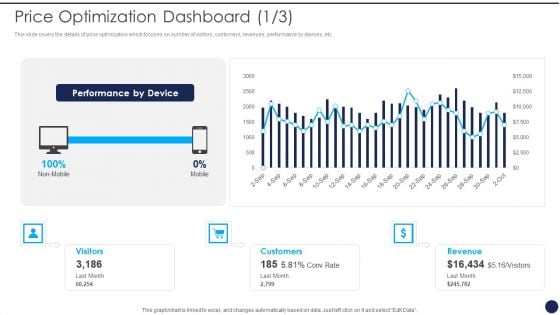
Product Pricing Strategies Analysis Price Optimization Dashboard Ppt File Background Image PDF
This slide covers the details of price optimization which focuses on number of visitors, customers, revenues, performance by devices, etc. Deliver an awe inspiring pitch with this creative Product Pricing Strategies Analysis Price Optimization Dashboard Ppt File Background Image PDF bundle. Topics like Visitors Customers Revenue, Performance By Device can be discussed with this completely editable template. It is available for immediate download depending on the needs and requirements of the user.
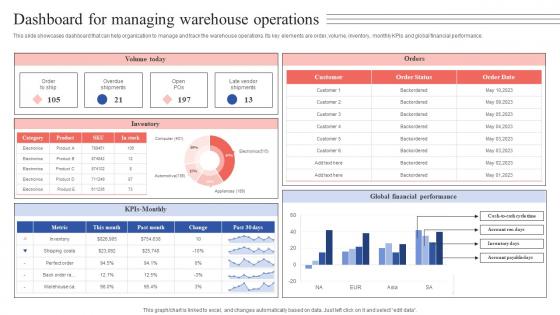
Dashboard For Managing Warehouse Operations Tactical Guide Stock Administration Diagrams Pdf
This slide showcases dashboard that can help organization to manage and track the warehouse operations. Its key elements are order, volume, inventory, monthly KPIs and global financial performance. From laying roadmaps to briefing everything in detail, our templates are perfect for you. You can set the stage with your presentation slides. All you have to do is download these easy-to-edit and customizable templates. Dashboard For Managing Warehouse Operations Tactical Guide Stock Administration Diagrams Pdf will help you deliver an outstanding performance that everyone would remember and praise you for. Do download this presentation today. This slide showcases dashboard that can help organization to manage and track the warehouse operations. Its key elements are order, volume, inventory, monthly KPIs and global financial performance.
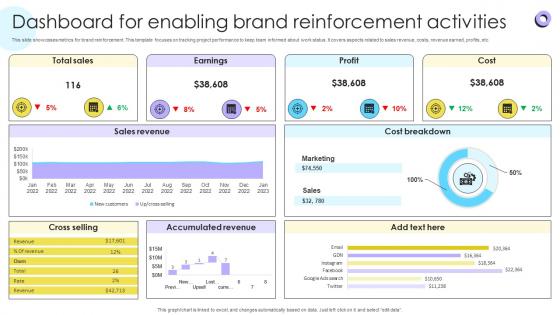
Dashboard For Enabling Brand Reinforcement Encouraging Repetitive Customer Purchase Ppt Slide
This slide showcases metrics for brand reinforcement. This template focuses on tracking project performance to keep team informed about work status. It covers aspects related to sales revenue, costs, revenue earned, profits, etc. From laying roadmaps to briefing everything in detail, our templates are perfect for you. You can set the stage with your presentation slides. All you have to do is download these easy-to-edit and customizable templates. Dashboard For Enabling Brand Reinforcement Encouraging Repetitive Customer Purchase Ppt Slide will help you deliver an outstanding performance that everyone would remember and praise you for. Do download this presentation today. This slide showcases metrics for brand reinforcement. This template focuses on tracking project performance to keep team informed about work status. It covers aspects related to sales revenue, costs, revenue earned, profits, etc.
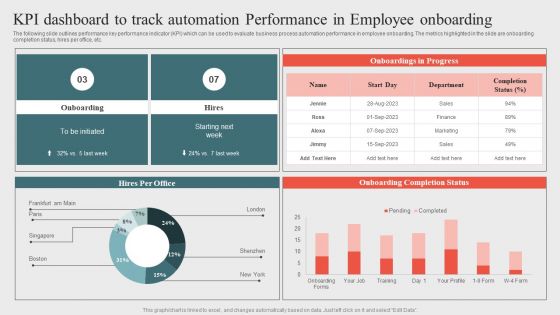
Kpi Dashboard To Track Automation Performanceoptimizing Business Processes Through Automation Summary PDF
The following slide outlines performance key performance indicator KPI which can be used to evaluate business process automation performance in employee onboarding. The metrics highlighted in the slide are onboarding completion status, hires per office, etc. Do you have to make sure that everyone on your team knows about any specific topic I yes, then you should give Kpi Dashboard To Track Automation Performanceoptimizing Business Processes Through Automation Summary PDF a try. Our experts have put a lot of knowledge and effort into creating this impeccable Kpi Dashboard To Track Automation Performanceoptimizing Business Processes Through Automation Summary PDF. You can use this template for your upcoming presentations, as the slides are perfect to represent even the tiniest detail. You can download these templates from the Slidegeeks website and these are easy to edit. So grab these today.
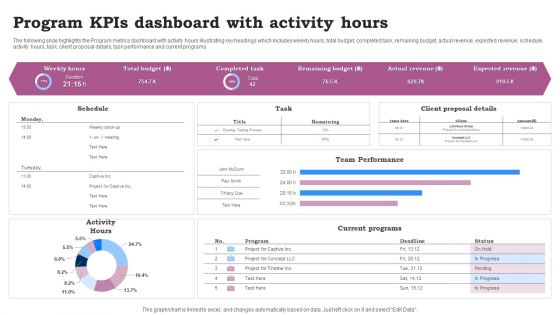
Program Kpis Dashboard With Activity Hours Ppt Infographics Clipart Images PDF
The following slide highlights the Program metrics dashboard with activity hours illustrating key headings which includes weekly hours, total budget, completed task, remaining budget, actual revenue, expected revenue, schedule, activity hours, task, client proposal details, task performance and current programs. Pitch your topic with ease and precision using this Program Kpis Dashboard With Activity Hours Ppt Infographics Clipart Images PDF. This layout presents information on Team Performance, Current Programs, Activity Hours. It is also available for immediate download and adjustment. So, changes can be made in the color, design, graphics or any other component to create a unique layout.
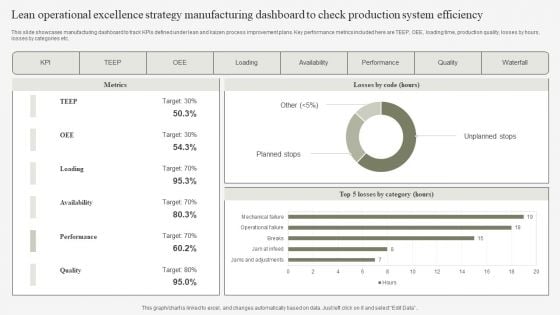
Lean Operational Excellence Strategy Manufacturing Dashboard To Check Production System Efficiency Pictures PDF
This slide showcases manufacturing dashboard to track KPIs defined under lean and kaizen process improvement plans. Key performance metrics included here are TEEP, OEE, loading time, production quality, losses by hours, losses by categories etc. Pitch your topic with ease and precision using this Lean Operational Excellence Strategy Manufacturing Dashboard To Check Production System Efficiency Pictures PDF. This layout presents information on Loading, Availability, Performance. It is also available for immediate download and adjustment. So, changes can be made in the color, design, graphics or any other component to create a unique layout.
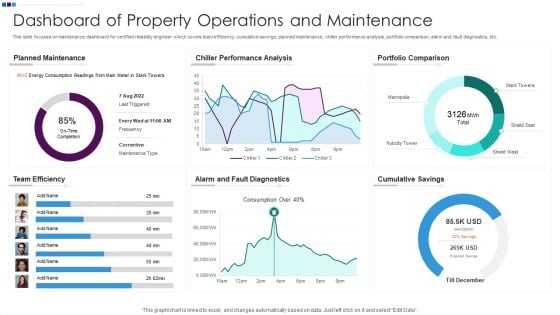
Dashboard Of Property Operations And Maintenance Ppt Infographic Template Objects PDF
This slide focuses on maintenance dashboard for certified reliability engineer which covers team efficiency, cumulative savings, planned maintenance, chiller performance analysis, portfolio comparison, alarm and fault diagnostics, etc. Pitch your topic with ease and precision using this Dashboard Of Property Operations And Maintenance Ppt Infographic Template Objects PDF. This layout presents information on Planned Maintenance Efficiency, Chiller Performance Analysis, Portfolio Comparison Team, Alarm And Fault. It is also available for immediate download and adjustment. So, changes can be made in the color, design, graphics or any other component to create a unique layout.


 Continue with Email

 Home
Home


