Performance Icon
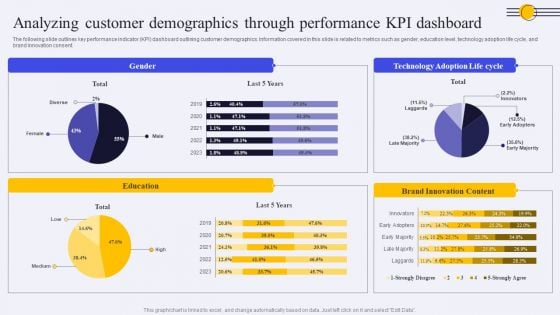
Analyzing Customer Demographics Through Performance KPI Dashboard Ppt PowerPoint Presentation File Model PDF
The following slide outlines key performance indicator KPI dashboard outlining customer demographics. Information covered in this slide is related to metrics such as gender, education level, technology adoption life cycle, and brand innovation consent. Are you searching for a Analyzing Customer Demographics Through Performance KPI Dashboard Ppt PowerPoint Presentation File Model PDF that is uncluttered, straightforward, and original Its easy to edit, and you can change the colors to suit your personal or business branding. For a presentation that expresses how much effort you have put in, this template is ideal. With all of its features, including tables, diagrams, statistics, and lists, its perfect for a business plan presentation. Make your ideas more appealing with these professional slides. Download Analyzing Customer Demographics Through Performance KPI Dashboard Ppt PowerPoint Presentation File Model PDF from Slidegeeks today.
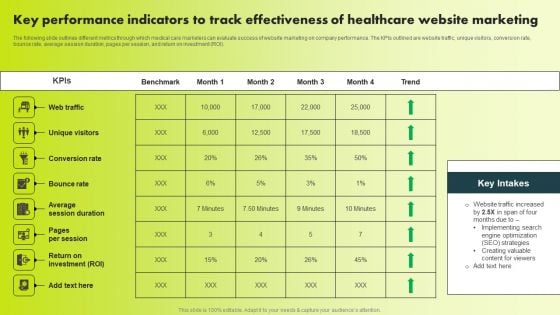
Key Performance Indicators To Track Effectiveness Of Healthcare Website Marketing Themes PDF
The following slide outlines different metrics through which medical care marketers can evaluate success of website marketing on company performance. The KPIs outlined are website traffic, unique visitors, conversion rate, bounce rate, average session duration, pages per session, and return on investment ROI. Whether you have daily or monthly meetings, a brilliant presentation is necessary. Key Performance Indicators To Track Effectiveness Of Healthcare Website Marketing Themes PDF can be your best option for delivering a presentation. Represent everything in detail using Key Performance Indicators To Track Effectiveness Of Healthcare Website Marketing Themes PDF and make yourself stand out in meetings. The template is versatile and follows a structure that will cater to your requirements. All the templates prepared by Slidegeeks are easy to download and edit. Our research experts have taken care of the corporate themes as well. So, give it a try and see the results.
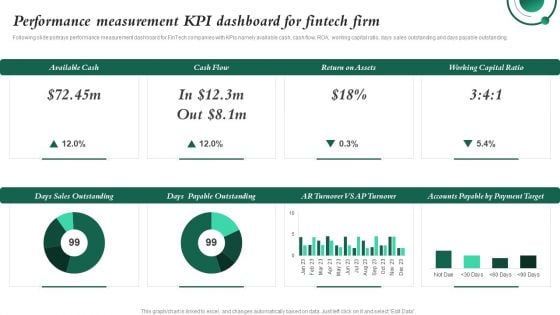
Performance Measurement KPI Dashboard For Fintech Firm Investment In Latest Technology To Ensure Portrait PDF
Following slide portrays performance measurement dashboard for FinTech companies with KPIs namely available cash, cash flow, ROA, working capital ratio, days sales outstanding and days payable outstanding.Whether you have daily or monthly meetings, a brilliant presentation is necessary. Performance Measurement KPI Dashboard For Fintech Firm Investment In Latest Technology To Ensure Portrait PDF can be your best option for delivering a presentation. Represent everything in detail using Performance Measurement KPI Dashboard For Fintech Firm Investment In Latest Technology To Ensure Portrait PDF and make yourself stand out in meetings. The template is versatile and follows a structure that will cater to your requirements. All the templates prepared by Slidegeeks are easy to download and edit. Our research experts have taken care of the corporate themes as well. So, give it a try and see the results.
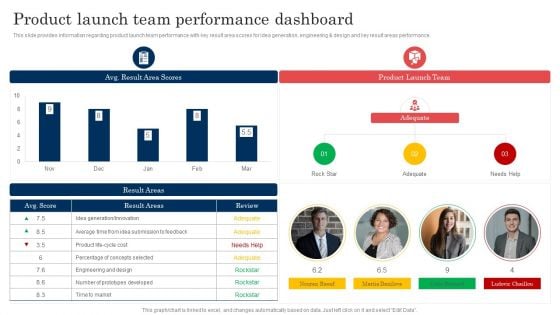
Commodity Launch Administration Playbook Product Launch Team Performance Dashboard Infographics PDF
This slide provides information regarding product launch team performance with key result area scores for idea generation, engineering and design and key result areas performance. Do you know about Slidesgeeks Commodity Launch Administration Playbook Product Launch Team Performance Dashboard Infographics PDF These are perfect for delivering any kind od presentation. Using it, create PowerPoint presentations that communicate your ideas and engage audiences. Save time and effort by using our pre-designed presentation templates that are perfect for a wide range of topic. Our vast selection of designs covers a range of styles, from creative to business, and are all highly customizable and easy to edit. Download as a PowerPoint template or use them as Google Slides themes.
Consumer Lead Generation Process Inbound Lead Performance Tracking Dashboard Demonstration PDF
This slide covers the KPI dashboard for evaluating inbound lead performance. It includes metrics such as lead to opportunity ratio, opportunity to win ratio, lead conversion ratio, inbound leads, and leads in the sales funnel. Whether you have daily or monthly meetings, a brilliant presentation is necessary. Consumer Lead Generation Process Inbound Lead Performance Tracking Dashboard Demonstration PDF can be your best option for delivering a presentation. Represent everything in detail using Consumer Lead Generation Process Inbound Lead Performance Tracking Dashboard Demonstration PDF and make yourself stand out in meetings. The template is versatile and follows a structure that will cater to your requirements. All the templates prepared by Slidegeeks are easy to download and edit. Our research experts have taken care of the corporate themes as well. So, give it a try and see the results.
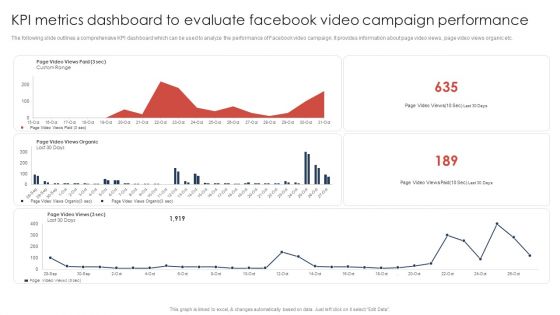
Kpi Metrics Dashboard To Evaluate Facebook Video Campaign Performance Information PDF
The following slide outlines a comprehensive KPI dashboard which can be used to analyze the performance of Facebook video campaign. It provides information about page video views, page video views organic etc. Whether you have daily or monthly meetings, a brilliant presentation is necessary. Kpi Metrics Dashboard To Evaluate Facebook Video Campaign Performance Information PDF can be your best option for delivering a presentation. Represent everything in detail using Kpi Metrics Dashboard To Evaluate Facebook Video Campaign Performance Information PDF and make yourself stand out in meetings. The template is versatile and follows a structure that will cater to your requirements. All the templates prepared by Slidegeeks are easy to download and edit. Our research experts have taken care of the corporate themes as well. So, give it a try and see the results.
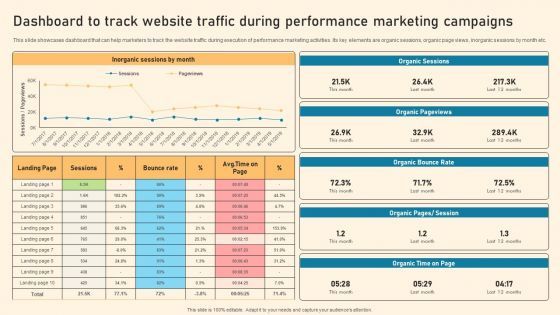
Dashboard To Track Website Traffic During Performance Marketing Campaigns Ppt PowerPoint Presentation File Slides PDF
This slide showcases dashboard that can help marketers to track the website traffic during execution of performance marketing activities. Its key elements are organic sessions, organic page views, inorganic sessions by month etc. Whether you have daily or monthly meetings, a brilliant presentation is necessary. Dashboard To Track Website Traffic During Performance Marketing Campaigns Ppt PowerPoint Presentation File Slides PDF can be your best option for delivering a presentation. Represent everything in detail using Dashboard To Track Website Traffic During Performance Marketing Campaigns Ppt PowerPoint Presentation File Slides PDF and make yourself stand out in meetings. The template is versatile and follows a structure that will cater to your requirements. All the templates prepared by Slidegeeks are easy to download and edit. Our research experts have taken care of the corporate themes as well. So, give it a try and see the results.
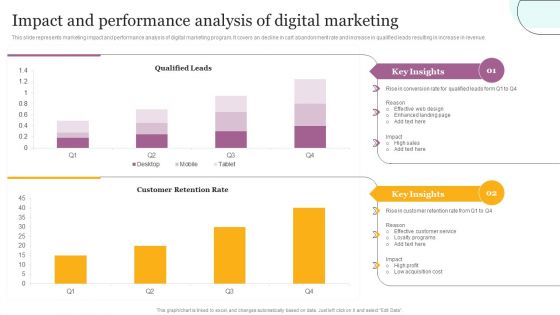
Impact And Performance Analysis Of Digital Marketing Ppt File Summary PDF
This slide represents marketing impact and performance analysis of digital marketing program. It covers an decline in cart abandonment rate and increase in qualified leads resulting in increase in revenue. Whether you have daily or monthly meetings, a brilliant presentation is necessary. Impact And Performance Analysis Of Digital Marketing Ppt File Summary PDF can be your best option for delivering a presentation. Represent everything in detail using Impact And Performance Analysis Of Digital Marketing Ppt File Summary PDF and make yourself stand out in meetings. The template is versatile and follows a structure that will cater to your requirements. All the templates prepared by Slidegeeks are easy to download and edit. Our research experts have taken care of the corporate themes as well. So, give it a try and see the results.
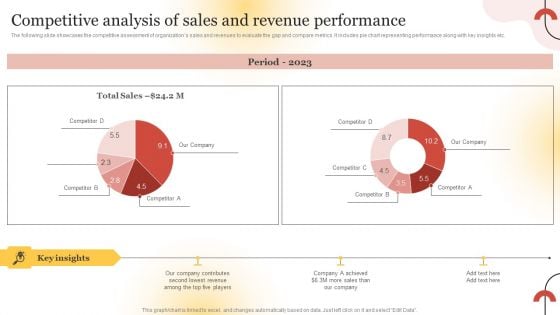
Executing Sales Risk Reduction Plan Competitive Analysis Of Sales And Revenue Performance Diagrams PDF
The following slide showcases the competitive assessment of organizations sales and revenues to evaluate the gap and compare metrics. It includes pie chart representing performance along with key insights etc. Take your projects to the next level with our ultimate collection of Executing Sales Risk Reduction Plan Competitive Analysis Of Sales And Revenue Performance Diagrams PDF. Slidegeeks has designed a range of layouts that are perfect for representing task or activity duration, keeping track of all your deadlines at a glance. Tailor these designs to your exact needs and give them a truly corporate look with your own brand colors they will make your projects stand out from the rest.
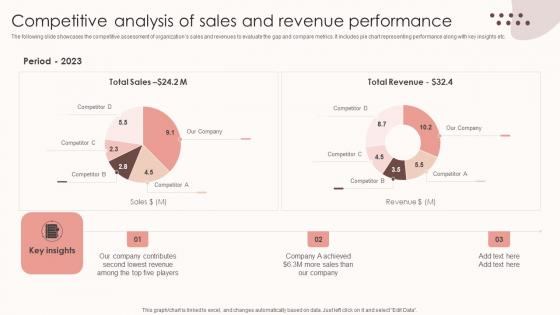
Assessing Sales Risks Competitive Analysis Of Sales And Revenue Performance Clipart PDF
The following slide showcases the competitive assessment of organizations sales and revenues to evaluate the gap and compare metrics. It includes pie chart representing performance along with key insights etc. Present like a pro with Assessing Sales Risks Competitive Analysis Of Sales And Revenue Performance Clipart PDF Create beautiful presentations together with your team, using our easy-to-use presentation slides. Share your ideas in real-time and make changes on the fly by downloading our templates. So whether you are in the office, on the go, or in a remote location, you can stay in sync with your team and present your ideas with confidence. With Slidegeeks presentation got a whole lot easier. Grab these presentations today. The following slide showcases the competitive assessment of organizations sales and revenues to evaluate the gap and compare metrics. It includes pie chart representing performance along with key insights etc.
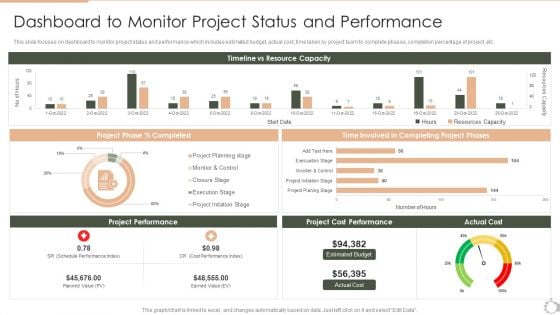
Techniques For Timely Project Dashboard To Monitor Project Status And Performance Microsoft PDF
This slide focuses on dashboard to monitor project status and performance which includes estimated budget, actual cost, time taken by project team to complete phases, completion percentage of project, etc. Deliver and pitch your topic in the best possible manner with this Techniques For Timely Project Dashboard To Monitor Project Status And Performance Microsoft PDF. Use them to share invaluable insights on Timeline vs, Resource Capacity, Project Phase, Time Involved and impress your audience. This template can be altered and modified as per your expectations. So, grab it now.
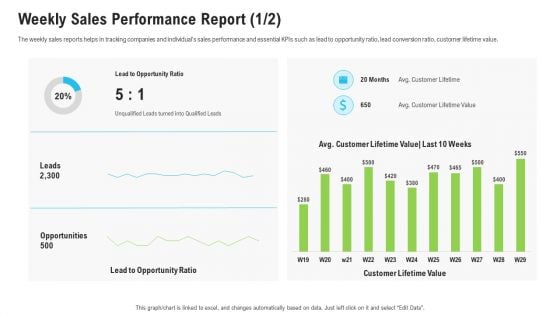
Sales Department Strategies Increase Revenues Weekly Sales Performance Report Leads Diagrams PDF
The weekly sales reports helps in tracking companies and individuals sales performance and essential KPIs such as lead to opportunity ratio, lead conversion ratio, customer lifetime value. Deliver and pitch your topic in the best possible manner with this sales department strategies increase revenues weekly sales performance report leads diagrams pdf. Use them to share invaluable insights on lead to opportunity ratio, customer lifetime value and impress your audience. This template can be altered and modified as per your expectations. So, grab it now.
Retail Trading Platform Dashboard Tracking Essential Kpis For Ecommerce Performance Diagrams PDF
This slide provides information regarding essential KPIs for ecommerce performance dashboard tracking average bounce rate, new vs. old customers, channel revenue vs. channel acquisitions costs, channel revenue vs. sales, average conversion rate, etc. Deliver an awe inspiring pitch with this creative retail trading platform dashboard tracking essential kpis for ecommerce performance diagrams pdf bundle. Topics like average bounce rate, average conversion rate, bounce rate, channel revenue sales can be discussed with this completely editable template. It is available for immediate download depending on the needs and requirements of the user.
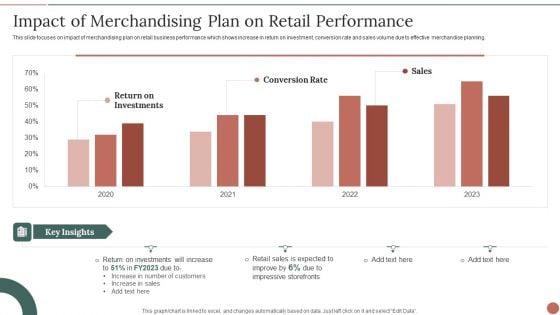
Retail Business Product Planning Procedure Impact Of Merchandising Plan On Retail Performance Diagrams PDF
This slide focuses on impact of merchandising plan on retail business performance which shows increase in return on investment, conversion rate and sales volume due to effective merchandise planning. Deliver and pitch your topic in the best possible manner with this Retail Business Product Planning Procedure Impact Of Merchandising Plan On Retail Performance Diagrams PDF. Use them to share invaluable insights on Retail Sales, Increase In Sales, Investments and impress your audience. This template can be altered and modified as per your expectations. So, grab it now.

Performance Analysis Using Operating Revenue Business Operational Expenditure And Income Metrics Diagrams PDF
This slide illustrates performance analysis using operating revenue, operating expenditure opex and income metrics which can be referred by organizations to evaluate their inflows and outflows to make relevant decisions for increasing profitability. It includes information about operating revenue, operating expense and income before taxes. Pitch your topic with ease and precision using this Performance Analysis Using Operating Revenue Business Operational Expenditure And Income Metrics Diagrams PDF. This layout presents information on Taxes, Highest Operating, Recorded. It is also available for immediate download and adjustment. So, changes can be made in the color, design, graphics or any other component to create a unique layout.
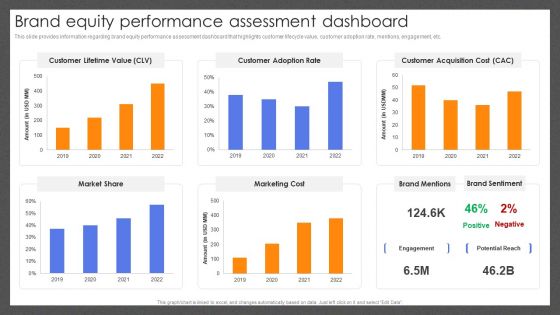
Guide For Effective Brand Brand Equity Performance Assessment Dashboard Diagrams PDF
This slide provides information regarding brand equity performance assessment dashboard that highlights customer lifecycle value, customer adoption rate, mentions, engagement, etc. Present like a pro with Guide For Effective Brand Brand Equity Performance Assessment Dashboard Diagrams PDF Create beautiful presentations together with your team, using our easy-to-use presentation slides. Share your ideas in real-time and make changes on the fly by downloading our templates. So whether youre in the office, on the go, or in a remote location, you can stay in sync with your team and present your ideas with confidence. With Slidegeeks presentation got a whole lot easier. Grab these presentations today.
Facebook Advertising Campaign Performance Tracking Report Ppt PowerPoint Presentation Diagram Images PDF
This slide represents the dashboard to track and monitor the performance and effectiveness of Facebook advertising campaign. It includes details related to KPIs such as Facebook Ads amount spent, FB ads websites conversion etc. Make sure to capture your audiences attention in your business displays with our gratis customizable Facebook Advertising Campaign Performance Tracking Report Ppt PowerPoint Presentation Diagram Images PDF. These are great for business strategies, office conferences, capital raising or task suggestions. If you desire to acquire more customers for your tech business and ensure they stay satisfied, create your own sales presentation with these plain slides.
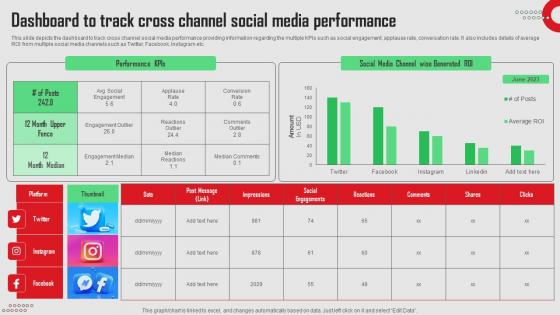
Dashboard To Track Cross Channel Social Media Platforms Performance Inspiration Pdf
This slide depicts the dashboard to track cross channel social media performance providing information regarding the multiple KPIs such as social engagement, applause rate, conversation rate. It also includes details of average ROI from multiple social media channels such as Twitter, Facebook, Instagram etc.There are so many reasons you need a Dashboard To Track Cross Channel Social Media Platforms Performance Inspiration Pdf. The first reason is you can not spend time making everything from scratch, Thus, Slidegeeks has made presentation templates for you too. You can easily download these templates from our website easily. This slide depicts the dashboard to track cross channel social media performance providing information regarding the multiple KPIs such as social engagement, applause rate, conversation rate. It also includes details of average ROI from multiple social media channels such as Twitter, Facebook, Instagram etc.
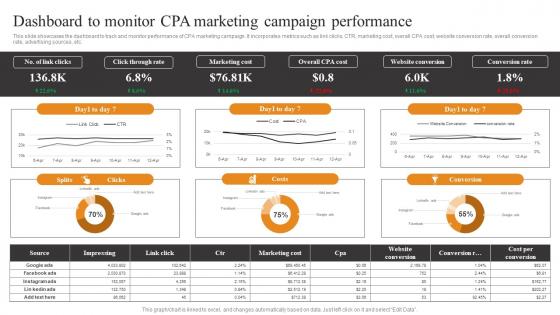
Dashboard To Monitor CPA Tactics To Optimize Corporate Performance Slides Pdf
This slide showcases the dashboard to track and monitor performance of CPA marketing campaign. It incorporates metrics such as link clicks, CTR, marketing cost, overall CPA cost, website conversion rate, overall conversion rate, advertising sources, etc. Present like a pro with Dashboard To Monitor CPA Tactics To Optimize Corporate Performance Slides Pdf Create beautiful presentations together with your team, using our easy to use presentation slides. Share your ideas in real time and make changes on the fly by downloading our templates. So whether you are in the office, on the go, or in a remote location, you can stay in sync with your team and present your ideas with confidence. With Slidegeeks presentation got a whole lot easier. Grab these presentations today. This slide showcases the dashboard to track and monitor performance of CPA marketing campaign. It incorporates metrics such as link clicks, CTR, marketing cost, overall CPA cost, website conversion rate, overall conversion rate, advertising sources, etc.
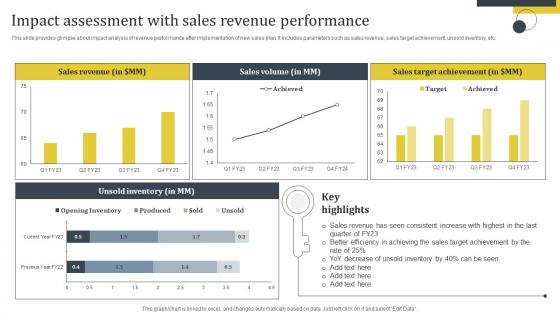
Enhance Customer Retention Impact Assessment With Sales Revenue Performance Rules Pdf
This slide provides glimpse about impact analysis of revenue performance after implementation of new sales plan. It includes parameters such as sales revenue, sales target achievement, unsold inventory, etc. This modern and well-arranged Enhance Customer Retention Impact Assessment With Sales Revenue Performance Rules Pdf provides lots of creative possibilities. It is very simple to customize and edit with the Powerpoint Software. Just drag and drop your pictures into the shapes. All facets of this template can be edited with Powerpoint no extra software is necessary. Add your own material, put your images in the places assigned for them, adjust the colors, and then you can show your slides to the world, with an animated slide included. This slide provides glimpse about impact analysis of revenue performance after implementation of new sales plan. It includes parameters such as sales revenue, sales target achievement, unsold inventory, etc.
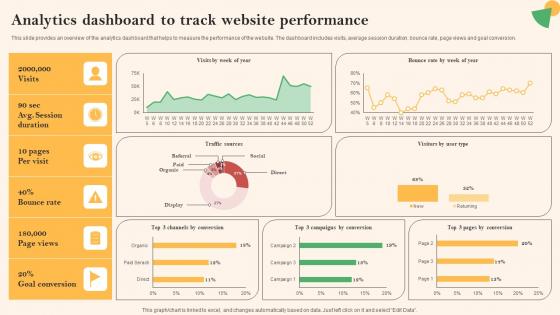
Social Media Marketing To Boost Analytics Dashboard To Track Website Performance Pictures Pdf
This slide provides an overview of the analytics dashboard that helps to measure the performance of the website. The dashboard includes visits, average session duration, bounce rate, page views and goal conversion. Slidegeeks is one of the best resources for PowerPoint templates. You can download easily and regulate Social Media Marketing To Boost Analytics Dashboard To Track Website Performance Pictures Pdf for your personal presentations from our wonderful collection. A few clicks is all it takes to discover and get the most relevant and appropriate templates. Use our Templates to add a unique zing and appeal to your presentation and meetings. All the slides are easy to edit and you can use them even for advertisement purposes. This slide provides an overview of the analytics dashboard that helps to measure the performance of the website. The dashboard includes visits, average session duration, bounce rate, page views and goal conversion.
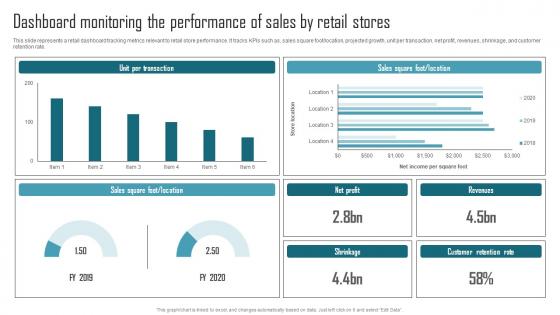
Effective Product Adaptation Dashboard Monitoring The Performance Of Sales By Retail Stores Designs PDF
This slide represents a retail dashboard tracking metrics relevant to retail store performance. It tracks KPIs such as, sales square footlocation, projected growth, unit per transaction, net profit, revenues, shrinkage, and customer retention rate. If your project calls for a presentation, then Slidegeeks is your go-to partner because we have professionally designed, easy-to-edit templates that are perfect for any presentation. After downloading, you can easily edit Effective Product Adaptation Dashboard Monitoring The Performance Of Sales By Retail Stores Designs PDF and make the changes accordingly. You can rearrange slides or fill them with different images. Check out all the handy templates This slide represents a retail dashboard tracking metrics relevant to retail store performance. It tracks KPIs such as, sales square footlocation, projected growth, unit per transaction, net profit, revenues, shrinkage, and customer retention rate.
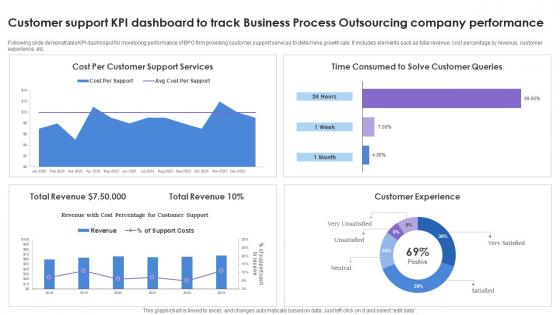
Customer Support KPI Dashboard To Track Business Process Outsourcing Company Performance Rules Pdf Wd
Following slide demonstrates KPI dashboard for monitoring performance of BPO firm providing customer support services to determine growth rate. It includes elements such as total revenue, cost percentage by revenue, customer experience, etc. Showcasing this set of slides titled Customer Support KPI Dashboard To Track Business Process Outsourcing Company Performance Rules Pdf Wd. The topics addressed in these templates are Customer Experience, Total Revenue. All the content presented in this PPT design is completely editable. Download it and make adjustments in color, background, font etc. as per your unique business setting. Following slide demonstrates KPI dashboard for monitoring performance of BPO firm providing customer support services to determine growth rate. It includes elements such as total revenue, cost percentage by revenue, customer experience, etc.
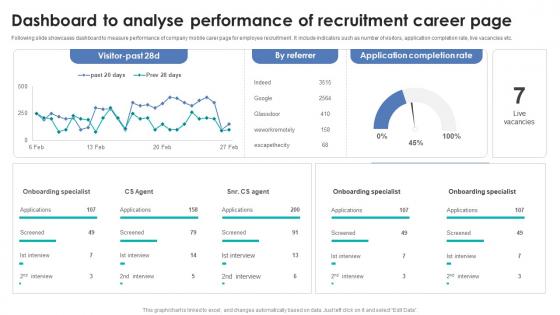
Integrating Automation For Effective Business Dashboard To Analyse Performance Of Recruitment
Following slide showcases dashboard to measure performance of company mobile carer page for employee recruitment . It include indicators such as number of visitors, application completion rate, live vacancies etc. Present like a pro with Integrating Automation For Effective Business Dashboard To Analyse Performance Of Recruitment. Create beautiful presentations together with your team, using our easy-to-use presentation slides. Share your ideas in real-time and make changes on the fly by downloading our templates. So whether you are in the office, on the go, or in a remote location, you can stay in sync with your team and present your ideas with confidence. With Slidegeeks presentation got a whole lot easier. Grab these presentations today. Following slide showcases dashboard to measure performance of company mobile carer page for employee recruitment . It include indicators such as number of visitors, application completion rate, live vacancies etc.

Facebook Marketing Plan Facebook Ads Dashboard With Campaign Performance Strategy SS V
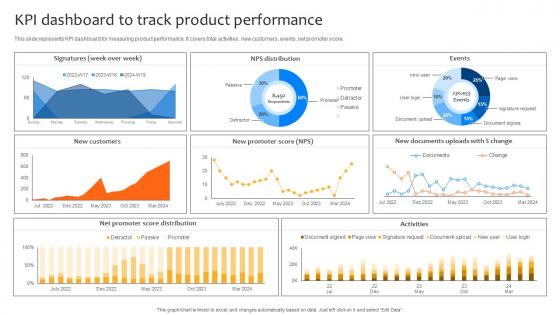
Deploying Strategies For Business KPI Dashboard To Track Product Performance Strategy SS V
This slide represents KPI dashboard for measuring product performance. It covers total activities, new customers, events, net promoter score. Coming up with a presentation necessitates that the majority of the effort goes into the content and the message you intend to convey. The visuals of a PowerPoint presentation can only be effective if it supplements and supports the story that is being told. Keeping this in mind our experts created Deploying Strategies For Business KPI Dashboard To Track Product Performance Strategy SS V to reduce the time that goes into designing the presentation. This way, you can concentrate on the message while our designers take care of providing you with the right template for the situation. This slide represents KPI dashboard for measuring product performance. It covers total activities, new customers, events, net promoter score.
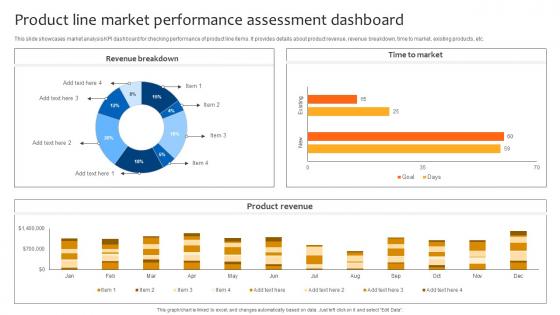
Deploying Strategies For Business Product Line Market Performance Assessment Dashboard Strategy SS V
This slide showcases market analysis KPI dashboard for checking performance of product line items. It provides details about product revenue, revenue breakdown, time to market, existing products, etc. Take your projects to the next level with our ultimate collection of Deploying Strategies For Business Product Line Market Performance Assessment Dashboard Strategy SS V. Slidegeeks has designed a range of layouts that are perfect for representing task or activity duration, keeping track of all your deadlines at a glance. Tailor these designs to your exact needs and give them a truly corporate look with your own brand colors they will make your projects stand out from the rest This slide showcases market analysis KPI dashboard for checking performance of product line items. It provides details about product revenue, revenue breakdown, time to market, existing products, etc.
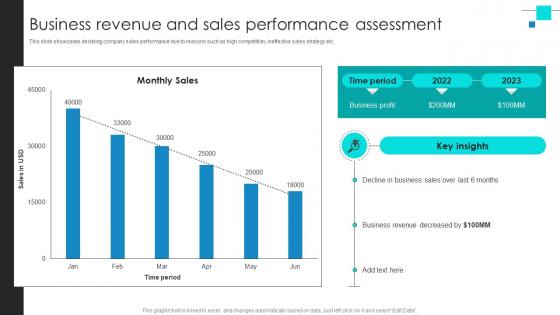
Project Benchmarking Process Business Revenue And Sales Performance Assessment CRP DK SS V
This slide showcases declining company sales performance due to reasons such as high competition, ineffective sales strategy etc. Present like a pro with Project Benchmarking Process Business Revenue And Sales Performance Assessment CRP DK SS V. Create beautiful presentations together with your team, using our easy-to-use presentation slides. Share your ideas in real-time and make changes on the fly by downloading our templates. So whether you are in the office, on the go, or in a remote location, you can stay in sync with your team and present your ideas with confidence. With Slidegeeks presentation got a whole lot easier. Grab these presentations today. This slide showcases declining company sales performance due to reasons such as high competition, ineffective sales strategy etc.
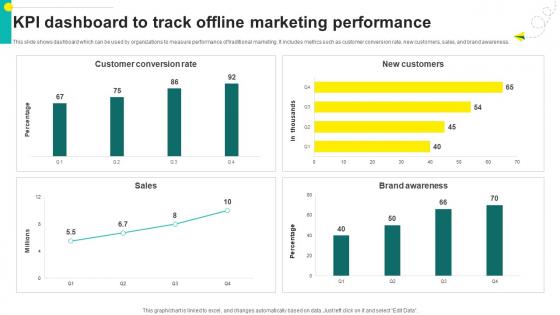
One On One Advertising Kpi Dashboard To Track Offline Marketing Performance Strategy SS V
This slide shows dashboard which can be used by organizations to measure performance of traditional marketing. It includes metrics such as customer conversion rate, new customers, sales, and brand awareness. Welcome to our selection of the One On One Advertising Kpi Dashboard To Track Offline Marketing Performance Strategy SS V. These are designed to help you showcase your creativity and bring your sphere to life. Planning and Innovation are essential for any business that is just starting out. This collection contains the designs that you need for your everyday presentations. All of our PowerPoints are 100Percent editable, so you can customize them to suit your needs. This multi-purpose template can be used in various situations. Grab these presentation templates today. This slide shows dashboard which can be used by organizations to measure performance of traditional marketing. It includes metrics such as customer conversion rate, new customers, sales, and brand awareness.
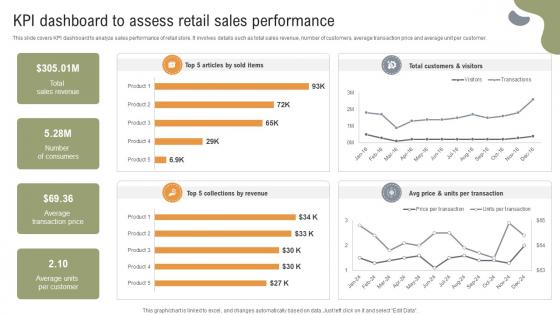
Implementing Strategies To Enhance KPI Dashboard To Assess Retail Sales Performance
This slide covers KPI dashboard to analyze sales performance of retail store. It involves details such as total sales revenue, number of customers, average transaction price and average unit per customer. The Implementing Strategies To Enhance KPI Dashboard To Assess Retail Sales Performance is a compilation of the most recent design trends as a series of slides. It is suitable for any subject or industry presentation, containing attractive visuals and photo spots for businesses to clearly express their messages. This template contains a variety of slides for the user to input data, such as structures to contrast two elements, bullet points, and slides for written information. Slidegeeks is prepared to create an impression. This slide covers KPI dashboard to analyze sales performance of retail store. It involves details such as total sales revenue, number of customers, average transaction price and average unit per customer.
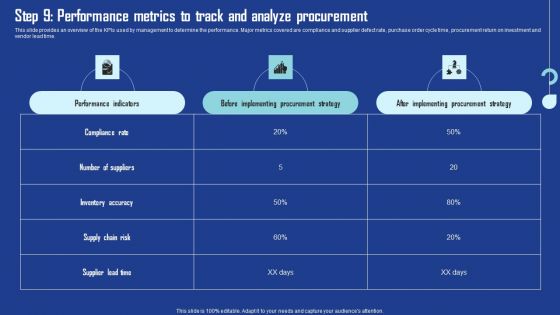
Step 9 Performance Metrics To Track And Analyze Procurement Diagrams PDF
This slide provides an overview of the KPIs used by management to determine the performance. Major metrics covered are compliance and supplier defect rate, purchase order cycle time, procurement return on investment and vendor lead time. Are you searching for a Step 9 Performance Metrics To Track And Analyze Procurement Diagrams PDF that is uncluttered, straightforward, and original Its easy to edit, and you can change the colors to suit your personal or business branding. For a presentation that expresses how much effort you have put in, this template is ideal. With all of its features, including tables, diagrams, statistics, and lists, its perfect for a business plan presentation. Make your ideas more appealing with these professional slides. Download Step 9 Performance Metrics To Track And Analyze Procurement Diagrams PDF from Slidegeeks today.
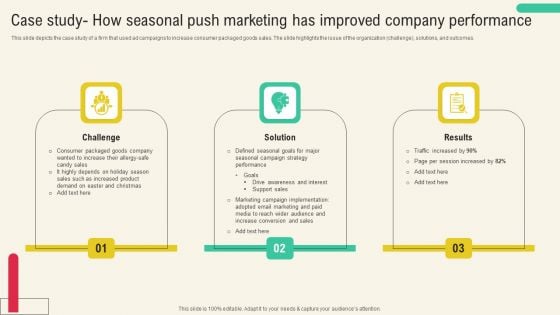
Case Study How Seasonal Push Marketing Has Improved Company Performance Diagrams PDF
This slide depicts the case study of a firm that used ad campaigns to increase consumer packaged goods sales. The slide highlights the issue of the organization challenge, solutions, and outcomes. Presenting this PowerPoint presentation, titled Case Study How Seasonal Push Marketing Has Improved Company Performance Diagrams PDF, with topics curated by our researchers after extensive research. This editable presentation is available for immediate download and provides attractive features when used. Download now and captivate your audience. Presenting this Case Study How Seasonal Push Marketing Has Improved Company Performance Diagrams PDF. Our researchers have carefully researched and created these slides with all aspects taken into consideration. This is a completely customizable Case Study How Seasonal Push Marketing Has Improved Company Performance Diagrams PDF that is available for immediate downloading. Download now and make an impact on your audience. Highlight the attractive features available with our PPTs.
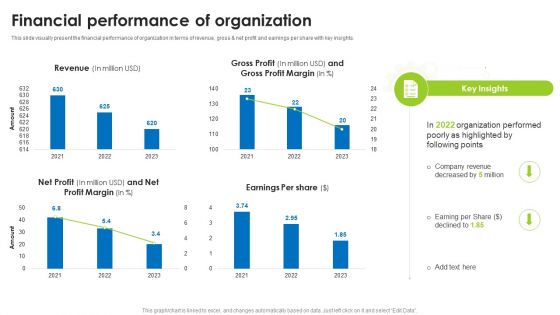
BI Technique For Data Informed Decisions Financial Performance Of Organization Guidelines PDF
This slide visually present the financial performance of organization in terms of revenue, gross and net profit and earnings per share with key insights. If you are looking for a format to display your unique thoughts, then the professionally designed BI Technique For Data Informed Decisions Financial Performance Of Organization Guidelines PDF is the one for you. You can use it as a Google Slides template or a PowerPoint template. Incorporate impressive visuals, symbols, images, and other charts. Modify or reorganize the text boxes as you desire. Experiment with shade schemes and font pairings. Alter, share or cooperate with other people on your work. Download BI Technique For Data Informed Decisions Financial Performance Of Organization Guidelines PDF and find out how to give a successful presentation. Present a perfect display to your team and make your presentation unforgettable.

Call Center Action Plan Dashboard Highlighting Agent Performance With Satisfaction Score Information PDF
This slide showcases dashboard for call center action plan which includes total calls, average answer speed, abandon rate, average calls per minute with agent performance and overall customer satisfaction score. If you are looking for a format to display your unique thoughts, then the professionally designed Call Center Action Plan Dashboard Highlighting Agent Performance With Satisfaction Score Information PDF is the one for you. You can use it as a Google Slides template or a PowerPoint template. Incorporate impressive visuals, symbols, images, and other charts. Modify or reorganize the text boxes as you desire. Experiment with shade schemes and font pairings. Alter, share or cooperate with other people on your work. Download Call Center Action Plan Dashboard Highlighting Agent Performance With Satisfaction Score Information PDF and find out how to give a successful presentation. Present a perfect display to your team and make your presentation unforgettable.
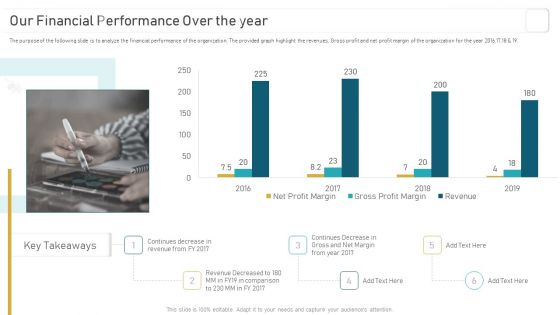
Deploying And Managing Recurring Our Financial Performance Over The Year Infographics PDF
The purpose of the following slide is to analyze the financial performance of the organization. The provided graph highlight the revenues, Gross profit and net profit margin of the organization for the year 2016,17,18 and 19. If you are looking for a format to display your unique thoughts, then the professionally designed Deploying And Managing Recurring Our Financial Performance Over The Year Infographics PDF is the one for you. You can use it as a Google Slides template or a PowerPoint template. Incorporate impressive visuals, symbols, images, and other charts. Modify or reorganize the text boxes as you desire. Experiment with shade schemes and font pairings. Alter, share or cooperate with other people on your work. Download Deploying And Managing Recurring Our Financial Performance Over The Year Infographics PDF and find out how to give a successful presentation. Present a perfect display to your team and make your presentation unforgettable.
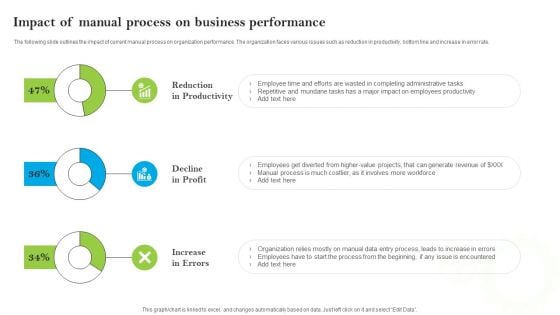
Introducing AI Tools Impact Of Manual Process On Business Performance Ideas PDF
The following slide outlines the impact of current manual process on organization performance. The organization faces various issues such as reduction in productivity, bottom line and increase in error rate. If you are looking for a format to display your unique thoughts, then the professionally designed Introducing AI Tools Impact Of Manual Process On Business Performance Ideas PDF is the one for you. You can use it as a Google Slides template or a PowerPoint template. Incorporate impressive visuals, symbols, images, and other charts. Modify or reorganize the text boxes as you desire. Experiment with shade schemes and font pairings. Alter, share or cooperate with other people on your work. Download Introducing AI Tools Impact Of Manual Process On Business Performance Ideas PDF and find out how to give a successful presentation. Present a perfect display to your team and make your presentation unforgettable.
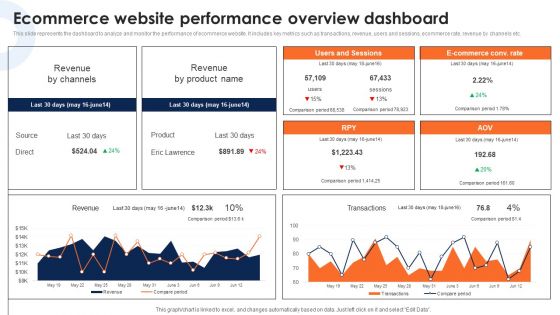
Ecommerce Website Performance Overview Dashboard Deploying Ecommerce Order Management Infographics PDF
This slide represents the dashboard to analyze and monitor the performance of ecommerce website. It includes key metrics such as transactions, revenue, users and sessions, ecommerce rate, revenue by channels etc.If you are looking for a format to display your unique thoughts, then the professionally designed Ecommerce Website Performance Overview Dashboard Deploying Ecommerce Order Management Infographics PDF is the one for you. You can use it as a Google Slides template or a PowerPoint template. Incorporate impressive visuals, symbols, images, and other charts. Modify or reorganize the text boxes as you desire. Experiment with shade schemes and font pairings. Alter, share or cooperate with other people on your work. Download Ecommerce Website Performance Overview Dashboard Deploying Ecommerce Order Management Infographics PDF and find out how to give a successful presentation. Present a perfect display to your team and make your presentation unforgettable.
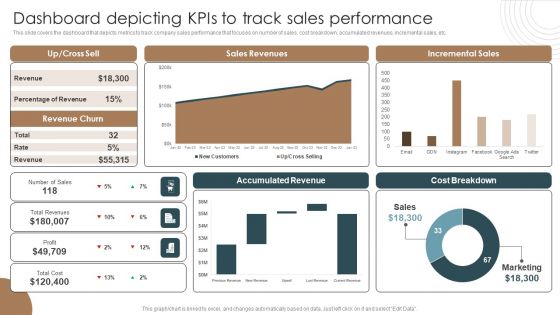
Dashboard Depicting Kpis To Track Sales Performance Integrating Technology To Transform Change Portrait PDF
This slide covers the dashboard that depicts metrics to track company sales performance that focuses on number of sales, cost breakdown, accumulated revenues, incremental sales, etc.If you are looking for a format to display your unique thoughts, then the professionally designed Dashboard Depicting Kpis To Track Sales Performance Integrating Technology To Transform Change Portrait PDF is the one for you. You can use it as a Google Slides template or a PowerPoint template. Incorporate impressive visuals, symbols, images, and other charts. Modify or reorganize the text boxes as you desire. Experiment with shade schemes and font pairings. Alter, share or cooperate with other people on your work. Download Dashboard Depicting Kpis To Track Sales Performance Integrating Technology To Transform Change Portrait PDF and find out how to give a successful presentation. Present a perfect display to your team and make your presentation unforgettable.
Product Branding To Enhance Product Branding Performance Tracking Dashboard Graphics PDF
This slide provides information regarding product branding performance tracking dashboard in terms of revenues, new customers, customer satisfaction rate. If you are looking for a format to display your unique thoughts, then the professionally designed Product Branding To Enhance Product Branding Performance Tracking Dashboard Graphics PDF is the one for you. You can use it as a Google Slides template or a PowerPoint template. Incorporate impressive visuals, symbols, images, and other charts. Modify or reorganize the text boxes as you desire. Experiment with shade schemes and font pairings. Alter, share or cooperate with other people on your work. Download Product Branding To Enhance Product Branding Performance Tracking Dashboard Graphics PDF and find out how to give a successful presentation. Present a perfect display to your team and make your presentation unforgettable.
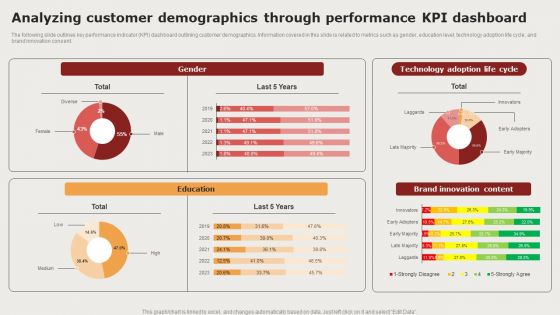
Creating Positioning Techniques For Market Research Analyzing Customer Demographics Through Performance Background PDF
The following slide outlines key performance indicator KPI dashboard outlining customer demographics. Information covered in this slide is related to metrics such as gender, education level, technology adoption life cycle, and brand innovation consent. If you are looking for a format to display your unique thoughts, then the professionally designed Creating Positioning Techniques For Market Research Analyzing Customer Demographics Through Performance Background PDF is the one for you. You can use it as a Google Slides template or a PowerPoint template. Incorporate impressive visuals, symbols, images, and other charts. Modify or reorganize the text boxes as you desire. Experiment with shade schemes and font pairings. Alter, share or cooperate with other people on your work. Download Creating Positioning Techniques For Market Research Analyzing Customer Demographics Through Performance Background PDF and find out how to give a successful presentation. Present a perfect display to your team and make your presentation unforgettable.
Maximizing Brand Growth With Umbrella Branding Activities Corporate Branding Performance Tracking Dashboard Summary PDF
This slide provides information regarding corporate branding performance tracking dashboard in terms of leads, conversion metrics, web traffic, etc. If you are looking for a format to display your unique thoughts, then the professionally designed Maximizing Brand Growth With Umbrella Branding Activities Corporate Branding Performance Tracking Dashboard Summary PDF is the one for you. You can use it as a Google Slides template or a PowerPoint template. Incorporate impressive visuals, symbols, images, and other charts. Modify or reorganize the text boxes as you desire. Experiment with shade schemes and font pairings. Alter, share or cooperate with other people on your work. Download Maximizing Brand Growth With Umbrella Branding Activities Corporate Branding Performance Tracking Dashboard Summary PDF and find out how to give a successful presentation. Present a perfect display to your team and make your presentation unforgettable.
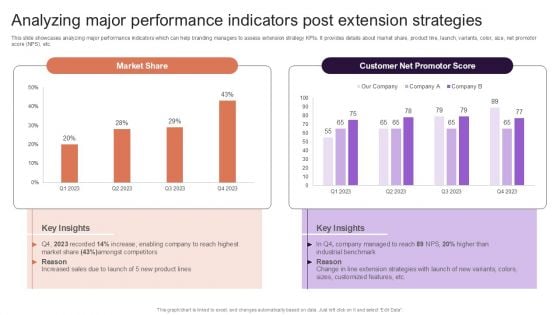
Implementing Brand Extension Initiatives For Apple Company Analyzing Major Performance Indicators Post Extension Topics PDF
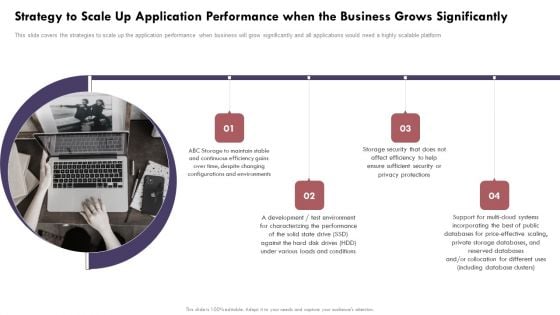
Strategy To Scale Up Application Performance When Cloud Computing Complexities And Solutions Diagrams PDF
This slide covers the strategies to scale up the application performance when business will grow significantly and all applications would need a highly scalable platform.Create an editable Strategy To Scale Up Application Performance When Cloud Computing Complexities And Solutions Diagrams PDF that communicates your idea and engages your audience. Whether you are presenting a business or an educational presentation, pre-designed presentation templates help save time. Strategy To Scale Up Application Performance When Cloud Computing Complexities And Solutions Diagrams PDF is highly customizable and very easy to edit, covering many different styles from creative to business presentations. Slidegeeks has creative team members who have crafted amazing templates. So, go and get them without any delay.
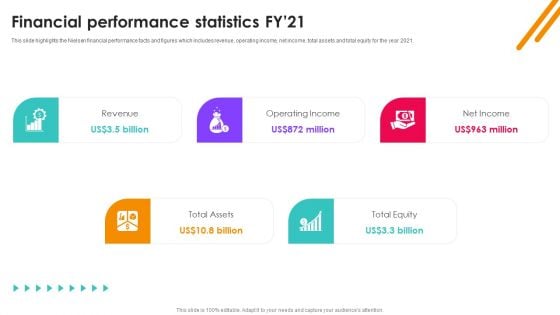
Nielsen Business Profile Financial Performance Statistics Fy21 Ppt PowerPoint Presentation Diagram PDF
This slide highlights the Nielsen financial performance facts and figures which includes revenue, operating income, net income, total assets and total equity for the year 2021. Do you have to make sure that everyone on your team knows about any specific topic I yes, then you should give Nielsen Business Profile Financial Performance Statistics Fy21 Ppt PowerPoint Presentation Diagram PDF a try. Our experts have put a lot of knowledge and effort into creating this impeccable Nielsen Business Profile Financial Performance Statistics Fy21 Ppt PowerPoint Presentation Diagram PDF. You can use this template for your upcoming presentations, as the slides are perfect to represent even the tiniest detail. You can download these templates from the Slidegeeks website and these are easy to edit. So grab these today.
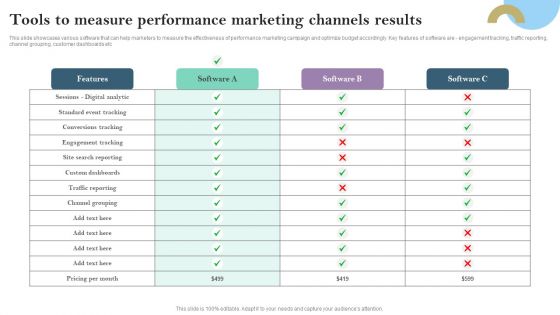
Tools To Measure Performance Marketing Channels Results Ppt PowerPoint Presentation File Diagrams PDF
This slide showcases various software that can help marketers to measure the effectiveness of performance marketing campaign and optimize budget accordingly. Key features of software are - engagement tracking, traffic reporting, channel grouping, customer dashboards etc Crafting an eye catching presentation has never been more straightforward. Let your presentation shine with this tasteful yet straightforward Tools To Measure Performance Marketing Channels Results Ppt PowerPoint Presentation File Diagrams PDF template. It offers a minimalistic and classy look that is great for making a statement. The colors have been employed intelligently to add a bit of playfulness while still remaining professional. Construct the ideal Tools To Measure Performance Marketing Channels Results Ppt PowerPoint Presentation File Diagrams PDF that effortlessly grabs the attention of your audience. Begin now and be certain to wow your customers.
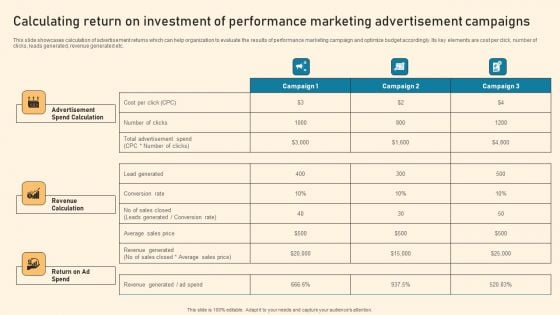
Calculating Return On Investment Of Performance Marketing Advertisement Campaigns Ppt PowerPoint Presentation Diagram Lists PDF
This slide showcases calculation of advertisement returns which can help organization to evaluate the results of performance marketing campaign and optimize budget accordingly. Its key elements are cost per click, number of clicks, leads generated, revenue generated etc. Do you have to make sure that everyone on your team knows about any specific topic I yes, then you should give Calculating Return On Investment Of Performance Marketing Advertisement Campaigns Ppt PowerPoint Presentation Diagram Lists PDF a try. Our experts have put a lot of knowledge and effort into creating this impeccable Calculating Return On Investment Of Performance Marketing Advertisement Campaigns Ppt PowerPoint Presentation Diagram Lists PDF. You can use this template for your upcoming presentations, as the slides are perfect to represent even the tiniest detail. You can download these templates from the Slidegeeks website and these are easy to edit. So grab these today.
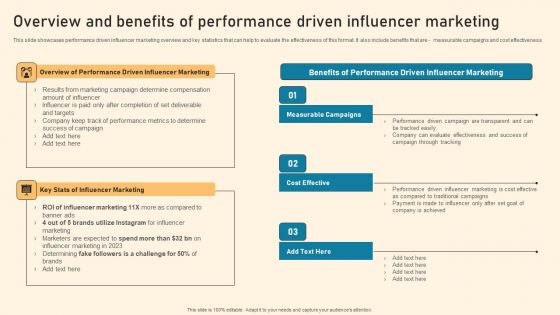
Overview And Benefits Of Performance Driven Influencer Marketing Ppt PowerPoint Presentation Diagram PDF
This slide showcases performance driven influencer marketing overview and key statistics that can help to evaluate the effectiveness of this format. It also include benefits that are measurable campaigns and cost effectiveness Do you have to make sure that everyone on your team knows about any specific topic I yes, then you should give Overview And Benefits Of Performance Driven Influencer Marketing Ppt PowerPoint Presentation Diagram PDF a try. Our experts have put a lot of knowledge and effort into creating this impeccable Overview And Benefits Of Performance Driven Influencer Marketing Ppt PowerPoint Presentation Diagram PDF. You can use this template for your upcoming presentations, as the slides are perfect to represent even the tiniest detail. You can download these templates from the Slidegeeks website and these are easy to edit. So grab these today.
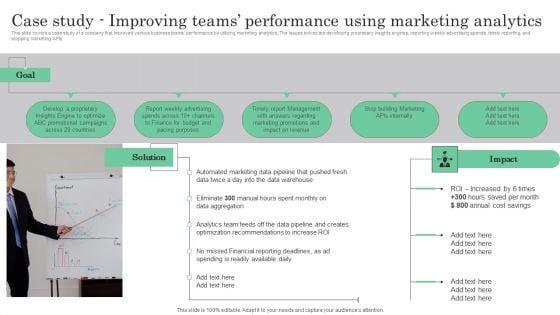
Online Marketing Analytics To Enhance Business Growth Case Study Improving Teams Performance Diagrams PDF
This slide covers a case study of a company that improved various business teams performance by utilizing marketing analytics. The issues solved are developing proprietary insights engines, reporting weekly advertising spends, timely reporting, and stopping marketing APIs. Do you have to make sure that everyone on your team knows about any specific topic I yes, then you should give Online Marketing Analytics To Enhance Business Growth Case Study Improving Teams Performance Diagrams PDF a try. Our experts have put a lot of knowledge and effort into creating this impeccable Online Marketing Analytics To Enhance Business Growth Case Study Improving Teams Performance Diagrams PDF. You can use this template for your upcoming presentations, as the slides are perfect to represent even the tiniest detail. You can download these templates from the Slidegeeks website and these are easy to edit. So grab these today.
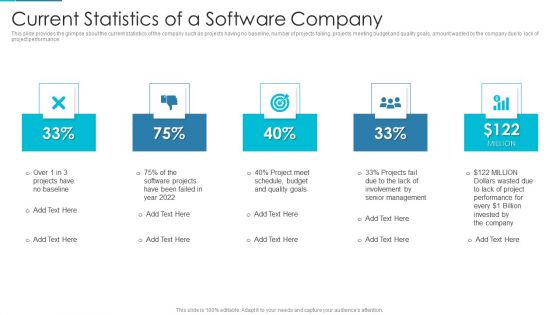
Project Management Outline For Schedule Performance Index Current Statistics Of A Software Company Diagrams PDF
This slide provides the glimpse about the current statistics of the company such as projects having no baseline, number of projects failing, projects meeting budget and quality goals, amount wasted by the company due to lack of project performance. This is a project management outline for schedule performance index current statistics of a software company diagrams pdf template with various stages. Focus and dispense information on five stages using this creative set, that comes with editable features. It contains large content boxes to add your information on topics like performance, management, budget, quality goals, lack of involvement. You can also showcase facts, figures, and other relevant content using this PPT layout. Grab it now.
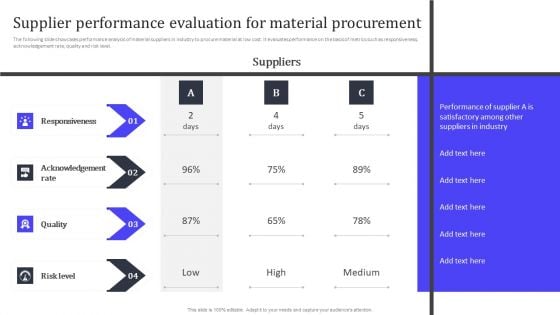
Supplier Performance Evaluation For Material Procurement Ppt PowerPoint Presentation File Diagrams PDF
The following slide showcases performance analysis of material suppliers in industry to procure material at low cost. It evaluates performance on the basis of metrics such as responsiveness, acknowledgement rate, quality and risk level. Slidegeeks is here to make your presentations a breeze with Supplier Performance Evaluation For Material Procurement Ppt PowerPoint Presentation File Diagrams PDF With our easy to use and customizable templates, you can focus on delivering your ideas rather than worrying about formatting. With a variety of designs to choose from, you are sure to find one that suits your needs. And with animations and unique photos, illustrations, and fonts, you can make your presentation pop. So whether you are giving a sales pitch or presenting to the board, make sure to check out Slidegeeks first.
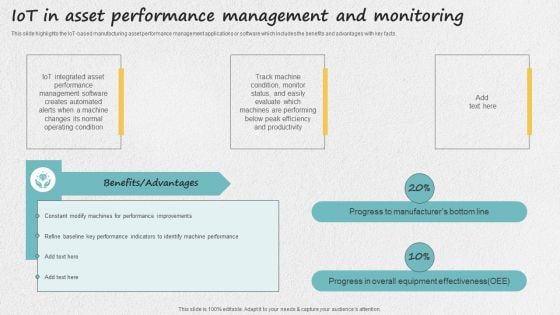
Iot Applications For Manufacturing Industry Iot In Asset Performance Management And Monitoring Diagrams PDF
This slide highlights the IoT-based manufacturing asset performance management applications or software which includes the benefits and advantages with key facts. This Iot Applications For Manufacturing Industry Iot In Asset Performance Management And Monitoring Diagrams PDF from Slidegeeks makes it easy to present information on your topic with precision. It provides customization options, so you can make changes to the colors, design, graphics, or any other component to create a unique layout. It is also available for immediate download, so you can begin using it right away. Slidegeeks has done good research to ensure that you have everything you need to make your presentation stand out. Make a name out there for a brilliant performance.
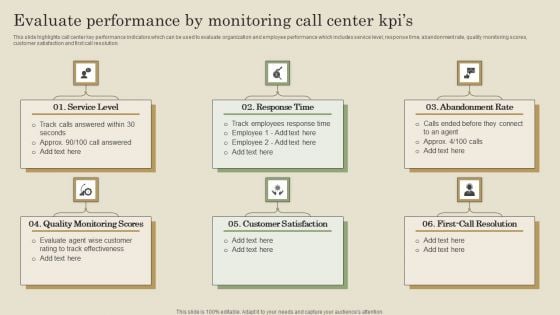
Evaluate Performance By Monitoring Call Center Kpis Ppt PowerPoint Presentation File Diagrams PDF
This slide highlights call center key performance indicators which can be used to evaluate organization and employee performance which includes service level, response time, abandonment rate, quality monitoring scores, customer satisfaction and first call resolution. Present like a pro with Evaluate Performance By Monitoring Call Center Kpis Ppt PowerPoint Presentation File Diagrams PDF Create beautiful presentations together with your team, using our easy to use presentation slides. Share your ideas in real time and make changes on the fly by downloading our templates. So whether you are in the office, on the go, or in a remote location, you can stay in sync with your team and present your ideas with confidence. With Slidegeeks presentation got a whole lot easier. Grab these presentations today.
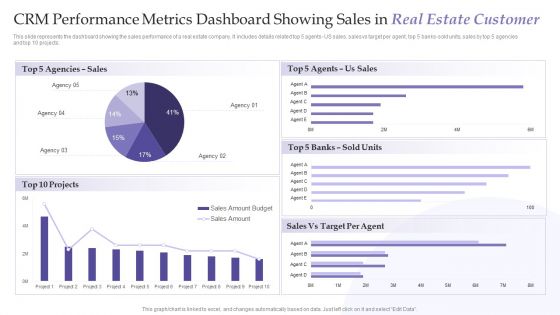
CRM Performance Metrics Dashboard Showing Sales In Real Estate Customer Information PDF
This slide represents the dashboard showing the sales performance of a real estate company. It includes details related top 5 agents US sales, sales vs target per agent, top 5 banks-sold units, sales by top 5 agencies. Pitch your topic with ease and precision using this CRM Performance Metrics Dashboard Showing Sales In Real Estate Customer Information PDF. This layout presents information on Us Sales, Sold Units, Target Per Agent. It is also available for immediate download and adjustment. So, changes can be made in the color, design, graphics or any other component to create a unique layout.
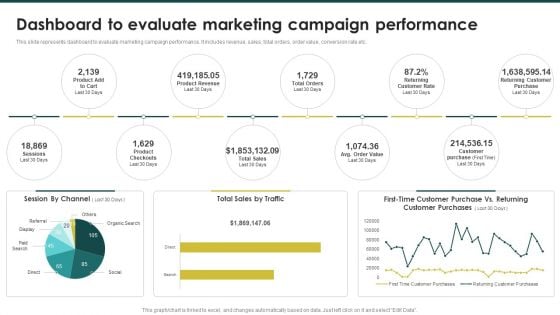
Dashboard To Evaluate Marketing Campaign Performance Ecommerce Marketing Plan To Enhance Microsoft PDF
This slide represents dashboard to evaluate marketing campaign performance. It includes revenue, sales, total orders, order value, conversion rate etc.Do you have to make sure that everyone on your team knows about any specific topic I yes, then you should give Dashboard To Evaluate Marketing Campaign Performance Ecommerce Marketing Plan To Enhance Microsoft PDF a try. Our experts have put a lot of knowledge and effort into creating this impeccable Dashboard To Evaluate Marketing Campaign Performance Ecommerce Marketing Plan To Enhance Microsoft PDF. You can use this template for your upcoming presentations, as the slides are perfect to represent even the tiniest detail. You can download these templates from the Slidegeeks website and these are easy to edit. So grab these today.
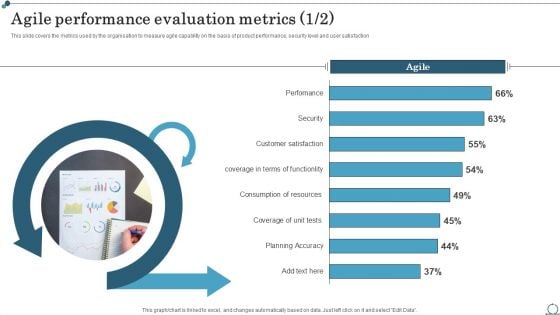
Agile Performance Evaluation Metrics Agile IT Methodology In Project Management Brochure PDF
This slide covers the metrics used by the organisation to measure agile capability on the basis of product performance, security level and user satisfaction.Find highly impressive Agile Performance Evaluation Metrics Agile IT Methodology In Project Management Brochure PDF on Slidegeeks to deliver a meaningful presentation. You can save an ample amount of time using these presentation templates. No need to worry to prepare everything from scratch because Slidegeeks experts have already done a huge research and work for you. You need to download Agile Performance Evaluation Metrics Agile IT Methodology In Project Management Brochure PDF for your upcoming presentation. All the presentation templates are 100precent editable and you can change the color and personalize the content accordingly. Download now.
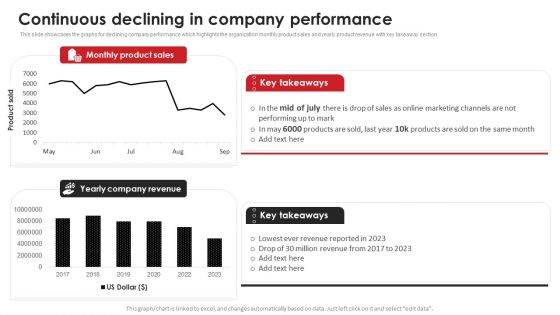
Continuous Declining In Company Performance Video Content Advertising Strategies For Youtube Download PDF
This slide showcases the graphs for declining company performance which highlights the organization monthly product sales and yearly product revenue with key takeaway section.Do you have to make sure that everyone on your team knows about any specific topic I yes, then you should give Continuous Declining In Company Performance Video Content Advertising Strategies For Youtube Download PDF a try. Our experts have put a lot of knowledge and effort into creating this impeccable Continuous Declining In Company Performance Video Content Advertising Strategies For Youtube Download PDF. You can use this template for your upcoming presentations, as the slides are perfect to represent even the tiniest detail. You can download these templates from the Slidegeeks website and these are easy to edit. So grab these today.
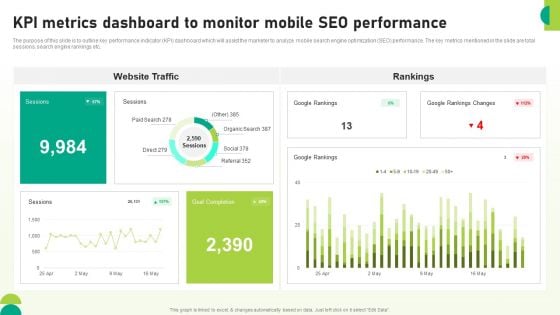
Utilizing SEO To Boost Customer KPI Metrics Dashboard To Monitor Mobile Seo Performance Download PDF
The purpose of this slide is to outline key performance indicator KPI dashboard which will assist the marketer to analyze mobile search engine optimization SEO performance. The key metrics mentioned in the slide are total sessions, search engine rankings etc. Coming up with a presentation necessitates that the majority of the effort goes into the content and the message you intend to convey. The visuals of a PowerPoint presentation can only be effective if it supplements and supports the story that is being told. Keeping this in mind our experts created Utilizing SEO To Boost Customer KPI Metrics Dashboard To Monitor Mobile Seo Performance Download PDF to reduce the time that goes into designing the presentation. This way, you can concentrate on the message while our designers take care of providing you with the right template for the situation.
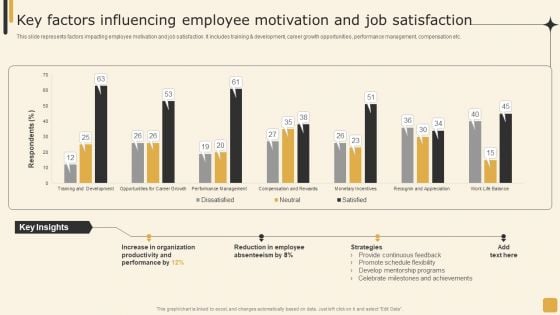
Key Factors Influencing Employee Motivation And Job Satisfaction Employee Performance Management Background PDF
This slide represents factors impacting employee motivation and job satisfaction. It includes training development, career growth opportunities, performance management, compensation etc.Explore a selection of the finest Key Factors Influencing Employee Motivation And Job Satisfaction Employee Performance Management Background PDF here. With a plethora of professionally designed and pre-made slide templates, you can quickly and easily find the right one for your upcoming presentation. You can use our Key Factors Influencing Employee Motivation And Job Satisfaction Employee Performance Management Background PDF to effectively convey your message to a wider audience. Slidegeeks has done a lot of research before preparing these presentation templates. The content can be personalized and the slides are highly editable. Grab templates today from Slidegeeks.
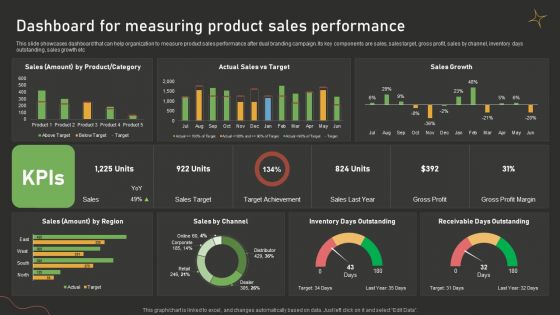
Dashboard For Measuring Product Sales Performance Dual Branding Campaign For Product Promotion Microsoft PDF
This slide showcases dashboard that can help organization to measure product sales performance after dual branding campaign. Its key components are sales, sales target, gross profit, sales by channel, inventory days outstanding, sales growth etc. Do you have an important presentation coming up Are you looking for something that will make your presentation stand out from the rest Look no further than Dashboard For Measuring Product Sales Performance Dual Branding Campaign For Product Promotion Microsoft PDF. With our professional designs, you can trust that your presentation will pop and make delivering it a smooth process. And with Slidegeeks, you can trust that your presentation will be unique and memorable. So why wait Grab Dashboard For Measuring Product Sales Performance Dual Branding Campaign For Product Promotion Microsoft PDF today and make your presentation stand out from the rest.
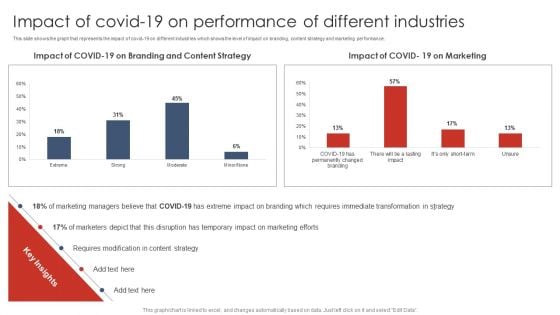
Impact Of Covid19 On Performance Of Different Industries Digital Marketing Strategy Deployment Template PDF
This slide shows the graph that represents the impact of covid-19 on different industries which shows the level of impact on branding, content strategy and marketing performance.Find highly impressive Impact Of Covid19 On Performance Of Different Industries Digital Marketing Strategy Deployment Template PDF on Slidegeeks to deliver a meaningful presentation. You can save an ample amount of time using these presentation templates. No need to worry to prepare everything from scratch because Slidegeeks experts have already done a huge research and work for you. You need to download Impact Of Covid19 On Performance Of Different Industries Digital Marketing Strategy Deployment Template PDF for your upcoming presentation. All the presentation templates are 100 precent editable and you can change the color and personalize the content accordingly. Download now.

 Home
Home