Performance Measurement
Improving PPC Campaign Results Develop Campaign Performance Tracking Infographics Pdf
The following slide depicts campaign performance management dashboard to measure the results. It includes elements such as conversions funnel, conversion rates, opportunity value, landing pages, sources google, twitter, Facebook etc. If you are looking for a format to display your unique thoughts, then the professionally designed Improving PPC Campaign Results Develop Campaign Performance Tracking Infographics Pdf is the one for you. You can use it as a Google Slides template or a PowerPoint template. Incorporate impressive visuals, symbols, images, and other charts. Modify or reorganize the text boxes as you desire. Experiment with shade schemes and font pairings. Alter, share or cooperate with other people on your work. Download Improving PPC Campaign Results Develop Campaign Performance Tracking Infographics Pdf and find out how to give a successful presentation. Present a perfect display to your team and make your presentation unforgettable. The following slide depicts campaign performance management dashboard to measure the results. It includes elements such as conversions funnel, conversion rates, opportunity value, landing pages, sources google, twitter, Facebook etc.
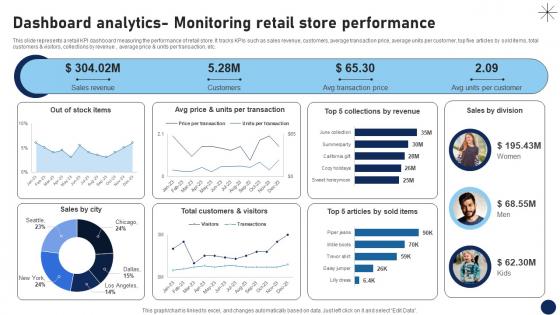
Dashboard Analytics Monitoring Retail Store Performance DT SS V
This slide represents a retail KPI dashboard measuring the performance of retail store. It tracks KPIs such as sales revenue, customers, average transaction price, average units per customer, top five articles by sold items, total customers and visitors, collections by revenue , average price and units per transaction, etc.Are you in need of a template that can accommodate all of your creative concepts This one is crafted professionally and can be altered to fit any style. Use it with Google Slides or PowerPoint. Include striking photographs, symbols, depictions, and other visuals. Fill, move around, or remove text boxes as desired. Test out color palettes and font mixtures. Edit and save your work, or work with colleagues. Download Dashboard Analytics Monitoring Retail Store Performance DT SS V and observe how to make your presentation outstanding. Give an impeccable presentation to your group and make your presentation unforgettable. This slide represents a retail KPI dashboard measuring the performance of retail store. It tracks KPIs such as sales revenue, customers, average transaction price, average units per customer, top five articles by sold items, total customers and visitors, collections by revenue , average price and units per transaction, etc.
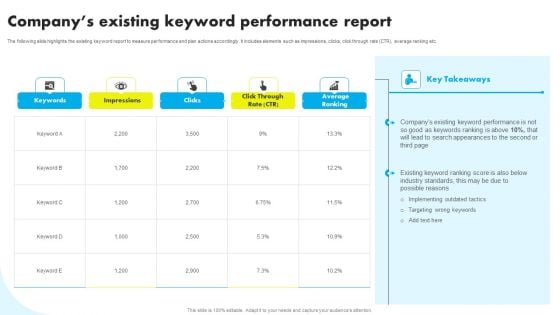
Companys Existing Keyword Performance Report Ppt Gallery Outline PDF

Comparison Chart For Performance Analysis Ppt Design
This is a comparison chart for performance analysis ppt design. This is a two stage process. The stages in this process are compare, scale, measurement, business, marketing.
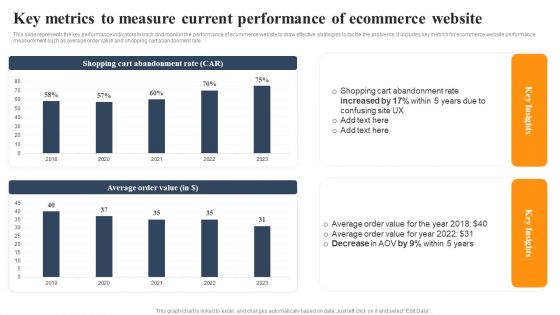
Implementing An Effective Ecommerce Management Framework Key Metrics Current Performance Of Ecommerce Website Slides PDF
This slide represents the key performance indicators to track and monitor the performance of ecommerce website to draw effective strategies to tackle the problems. It includes key metrics for ecommerce website performance measurement such as average order value and shopping cart abandonment rate. The Implementing An Effective Ecommerce Management Framework Key Metrics Current Performance Of Ecommerce Website Slides PDF is a compilation of the most recent design trends as a series of slides. It is suitable for any subject or industry presentation, containing attractive visuals and photo spots for businesses to clearly express their messages. This template contains a variety of slides for the user to input data, such as structures to contrast two elements, bullet points, and slides for written information. Slidegeeks is prepared to create an impression.
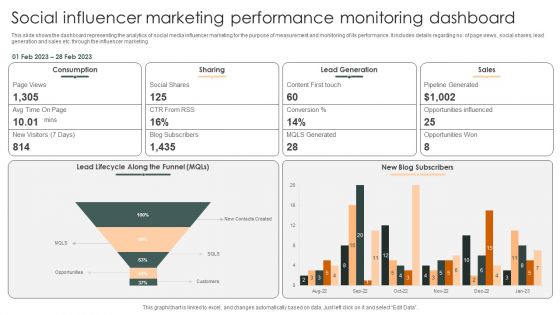
Social Influencer Marketing Performance Monitoring Dashboard Slides PDF
This slide shows the dashboard representing the analytics of social media influencer marketing for the purpose of measurement and monitoring of its performance. It includes details regarding no. of page views, social shares, lead generation and sales etc. through the influencer marketing.Pitch your topic with ease and precision using this Social Influencer Marketing Performance Monitoring Dashboard Slides PDF. This layout presents information on Lead Generation, Pipeline Generated, Opportunities Influenced. It is also available for immediate download and adjustment. So, changes can be made in the color, design, graphics or any other component to create a unique layout.

Performance Metrics Blind Shipping GTM Strategy GTM SS V
The following slide outlines various KPIs to track and measure drop shipping startups operational performance. The metrics are conversion rate, subscriptions, CAC, CLV, etc.Crafting an eye-catching presentation has never been more straightforward. Let your presentation shine with this tasteful yet straightforward Performance Metrics Blind Shipping GTM Strategy GTM SS V template. It offers a minimalistic and classy look that is great for making a statement. The colors have been employed intelligently to add a bit of playfulness while still remaining professional. Construct the ideal Performance Metrics Blind Shipping GTM Strategy GTM SS V that effortlessly grabs the attention of your audience Begin now and be certain to wow your customers The following slide outlines various KPIs to track and measure drop shipping startups operational performance. The metrics are conversion rate, subscriptions, CAC, CLV, etc.
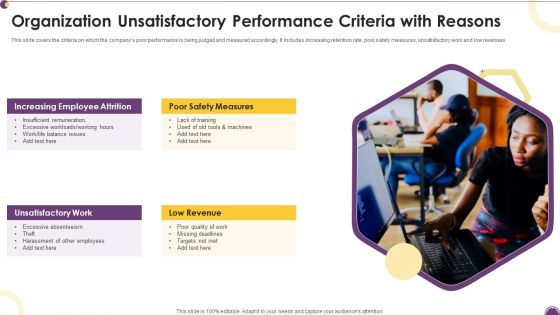
Organization Unsatisfactory Performance Criteria With Reasons Inspiration PDF
This slide covers the criteria on which the companys poor performance is being judged and measured accordingly. It includes increasing retention rate, poor safety measures, unsatisfactory work and low revenues.Persuade your audience using this Organization Unsatisfactory Performance Criteria With Reasons Inspiration PDF. This PPT design covers four stages, thus making it a great tool to use. It also caters to a variety of topics including Increasing Employee, Unsatisfactory Work, Safety Measures. Download this PPT design now to present a convincing pitch that not only emphasizes the topic but also showcases your presentation skills.
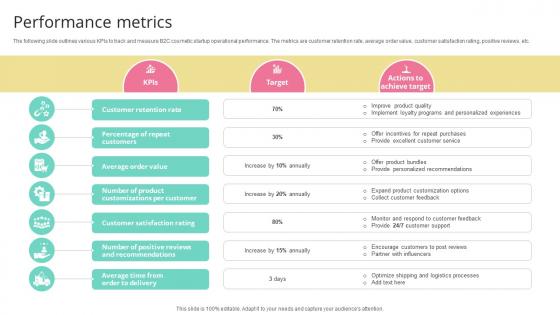
Performance Metrics Skincare Startup GTM Strategy GTM SS V
The following slide outlines various KPIs to track and measure B2C cosmetic startup operational performance. The metrics are customer retention rate, average order value, customer satisfaction rating, positive reviews, etc.Make sure to capture your audiences attention in your business displays with our gratis customizable Performance Metrics Skincare Startup GTM Strategy GTM SS V. These are great for business strategies, office conferences, capital raising or task suggestions. If you desire to acquire more customers for your tech business and ensure they stay satisfied, create your own sales presentation with these plain slides. The following slide outlines various KPIs to track and measure B2C cosmetic startup operational performance. The metrics are customer retention rate, average order value, customer satisfaction rating, positive reviews, etc.
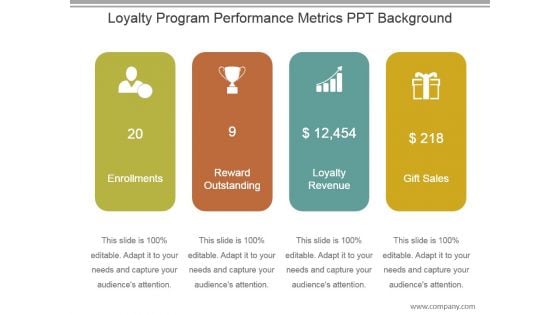
Loyalty Program Performance Metrics Ppt Background
This is a loyalty program performance metrics ppt background. This is a four stage process. The stages in this process are enrollments, reward outstanding, revenue, gift sales.
Employer Branding Strategy For Competitive Employee Performance Tracking Background Pdf
This slide showcases a dashboard presenting various metrics to measure and analyze employee overall performance. It outlines information about average absenteeism rate, yearly average overtime hours, training costs and overall labor effectiveness. Do you have an important presentation coming up Are you looking for something that will make your presentation stand out from the rest Look no further than Employer Branding Strategy For Competitive Employee Performance Tracking Background Pdf. With our professional designs, you can trust that your presentation will pop and make delivering it a smooth process. And with Slidegeeks, you can trust that your presentation will be unique and memorable. So why wait Grab Employer Branding Strategy For Competitive Employee Performance Tracking Background Pdf today and make your presentation stand out from the rest. This slide showcases a dashboard presenting various metrics to measure and analyze employee overall performance. It outlines information about average absenteeism rate, yearly average overtime hours, training costs and overall labor effectiveness.
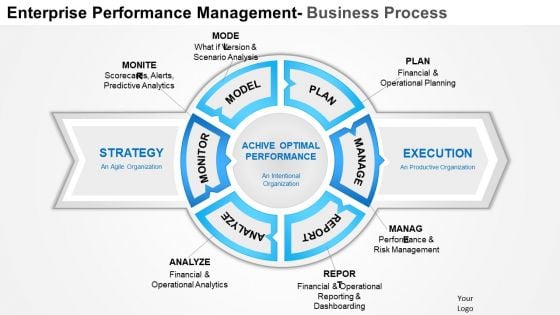
Business Framework Enterprise Performance Management PowerPoint Presentation
This image slide has been designed to depict enterprise performance management diagram. This image slide displays business planning and forecasting. This image slide may be used to exhibit business performance management in your presentations. This image slide will give edge to your presentations.
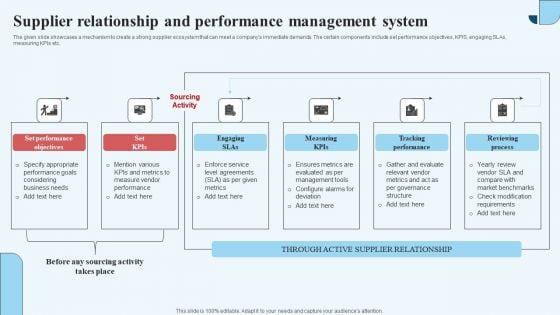
Supplier Relationship And Performance Management System Formats PDF
The given slide showcases a mechanism to create a strong supplier ecosystem that can meet a companys immediate demands. The certain components include set performance objectives, KPIS, engaging SLAs,measuring KPIs etc. Persuade your audience using this Supplier Relationship And Performance Management System Formats PDF. This PPT design covers six stages, thus making it a great tool to use. It also caters to a variety of topics including Measuring Kpis, Tracking Performance, Reviewing Process. Download this PPT design now to present a convincing pitch that not only emphasizes the topic but also showcases your presentation skills.
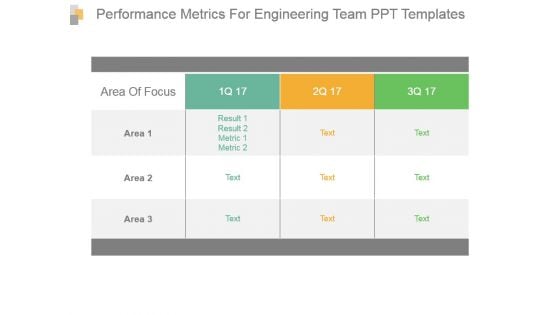
Performance Metrics For Engineering Team Ppt Templates
This is a performance metrics for engineering team ppt templates. This is a three stage process. The stages in this process are area of focus, result, area.
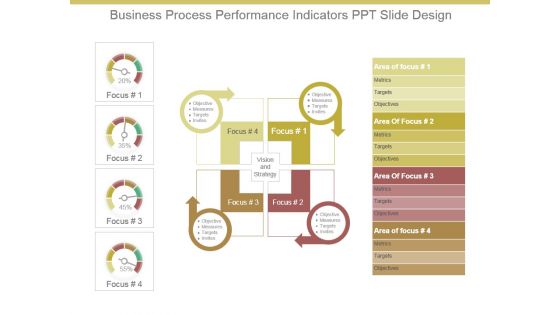
Business Process Performance Indicators Ppt Slide Design
This is a business process performance indicators ppt slide design. This is a four stage process. The stages in this process are focus, objective, measures, targets, invites, vision and strategy, area of focus, metrics, targets, objectives.
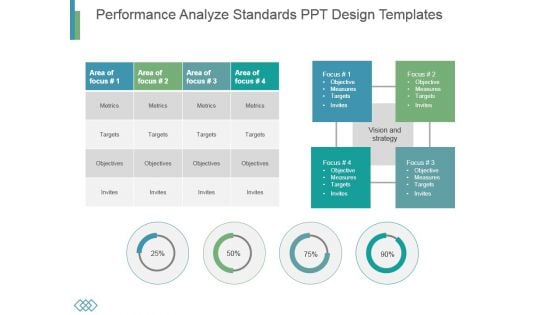
Performance Analyze Standards Ppt Design Templates
This is a performance analyze standards ppt design templates. This is a four stage process. The stages in this process are metrics, targets, objectives, invites.
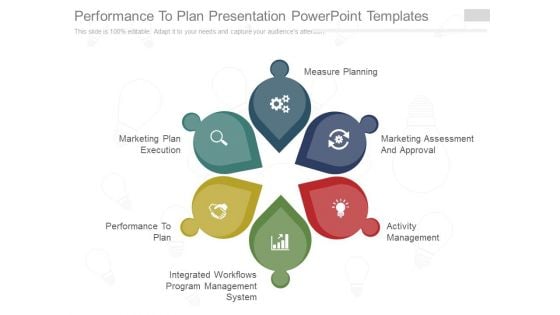
Performance To Plan Presentation Powerpoint Templates
This is a performance to plan presentation powerpoint templates. This is a six stage process. The stages in this process are measure planning, marketing assessment and approval, activity management, integrated workflows program management system, performance to plan, marketing plan execution.
Customer Service Performance Standards Powerpoint Slide Designs
This is a customer service performance standards powerpoint slide designs. This is a five stage process. The stages in this process are arrow, icons, boxes, business, marketing.

Call Center Process Key Performance Indicator Dashboard Mockup PDF
This slide showcases call center process measurements and key performance indicators so managers and teams can keep track of and improve performance . It includes received calls, calculating speed of answering calls , ended calls before starting conversations , average calls per minute etc. Showcasing this set of slides titled Call Center Process Key Performance Indicator Dashboard Mockup PDF. The topics addressed in these templates are Received Calls, Conversation, Abandon Rate. All the content presented in this PPT design is completely editable. Download it and make adjustments in color, background, font etc. as per your unique business setting.
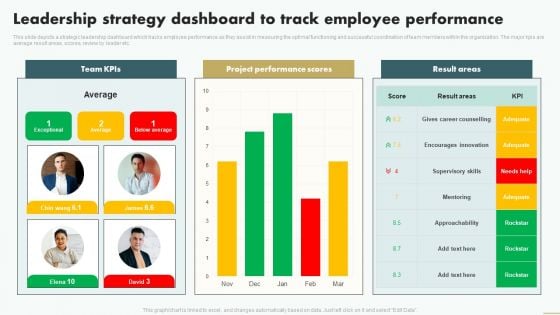
Leadership Strategy Dashboard To Track Employee Performance Brochure PDF
This slide depicts a strategic leadership dashboard which tracks employee performance as they assist in measuring the optimal functioning and successful coordination of team members within the organization. The major kpis are average result areas, scores, review by leader etc. Showcasing this set of slides titled Leadership Strategy Dashboard To Track Employee Performance Brochure PDF. The topics addressed in these templates are Leadership Strategy Dashboard, Track Employee Performance. All the content presented in this PPT design is completely editable. Download it and make adjustments in color, background, font etc. as per your unique business setting.
Facebook Ad Campaign Performance Tracking Dashboard Microsoft PDF
This slide represents the KPI dashboard to effectively measure and monitor performance of Facebook marketing campaign conducted by the organization to enhance customer engagement. It includes details related to KPIs such as ad impressions, ad reach etc. From laying roadmaps to briefing everything in detail, our templates are perfect for you. You can set the stage with your presentation slides. All you have to do is download these easy-to-edit and customizable templates. Facebook Ad Campaign Performance Tracking Dashboard Microsoft PDF will help you deliver an outstanding performance that everyone would remember and praise you for. Do download this presentation today.
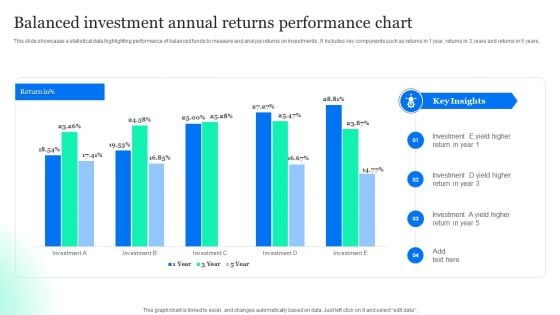
Balanced Investment Annual Returns Performance Chart Designs PDF
This slide showcases a statistical data highlighting performance of balanced funds to measure and analyze returns on investments . It includes key components such as returns in 1 year, returns in 3 years and returns in 5 years. Pitch your topic with ease and precision using this Balanced Investment Annual Returns Performance Chart Designs PDF. This layout presents information on Balanced Investment, Annual Returns, Performance Chart. It is also available for immediate download and adjustment. So, changes can be made in the color, design, graphics or any other component to create a unique layout.
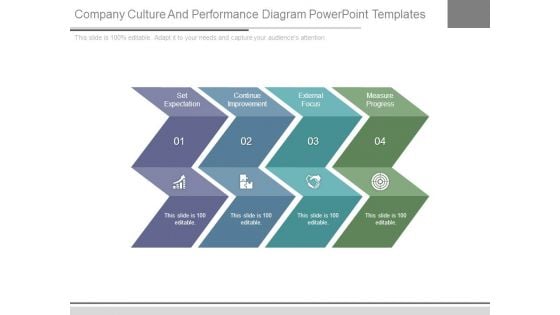
Company Culture And Performance Diagram Powerpoint Templates
This is a Company Culture And Performance Diagram Powerpoint Templates. This is a four stage process. The stages in this process are set expectation, continue improvement, external focus, measure progress.
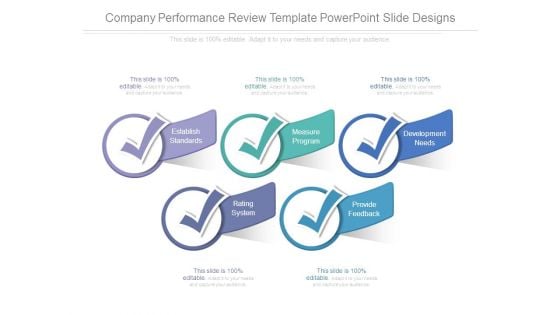
Company Performance Review Template Powerpoint Slide Designs
This is a company performance review template powerpoint slide designs. This is a five stage process. The stages in this process are establish standards, measure program, development needs, rating system, provide feedback.
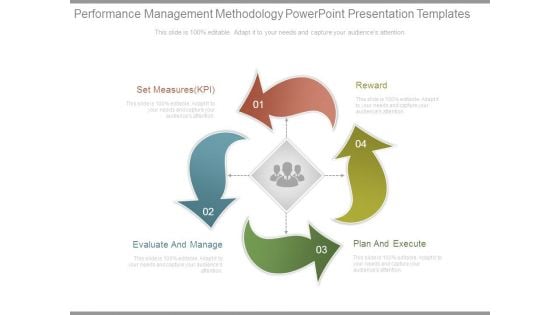
Performance Management Methodology Powerpoint Presentation Templates
This is a performance management methodology powerpoint presentation templates. This is a four stage process. The stages in this process are set measures kpi, evaluate and manage, reward, plan and execute.
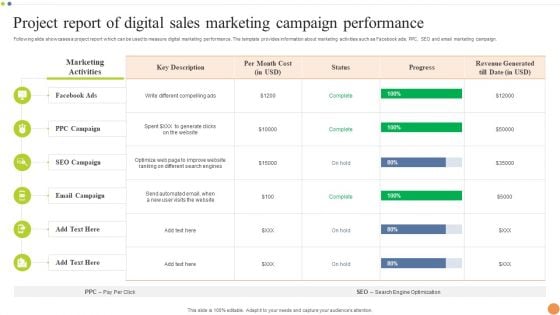
Project Report Of Digital Sales Marketing Campaign Performance Professional PDF
Following slide showcases a project report which can be used to measure digital marketing performance. The template provides information about marketing activities such as Facebook ads, PPC, SEO and email marketing campaign. Pitch your topic with ease and precision using this Project Report Of Digital Sales Marketing Campaign Performance Professional PDF. This layout presents information on Email Campaign, SEO Campaign, Marketing Activities. It is also available for immediate download and adjustment. So, changes can be made in the color, design, graphics or any other component to create a unique layout.
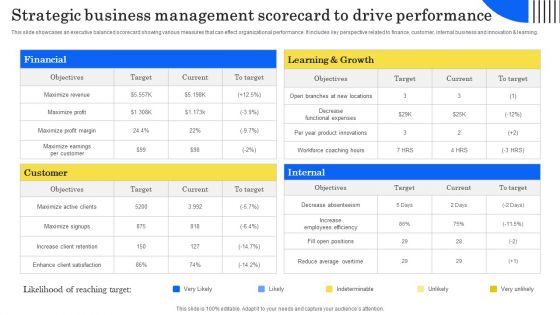
Strategic Business Management Scorecard To Drive Performance Formats PDF
This slide showcases an executive balanced scorecard showing various measures that can effect organizational performance. It includes key perspective related to finance, customer, internal business and innovation and learning. Showcasing this set of slides titled Strategic Business Management Scorecard To Drive Performance Formats PDF. The topics addressed in these templates are Customer, Financial, Learning Growth. All the content presented in this PPT design is completely editable. Download it and make adjustments in color, background, font etc. as per your unique business setting.
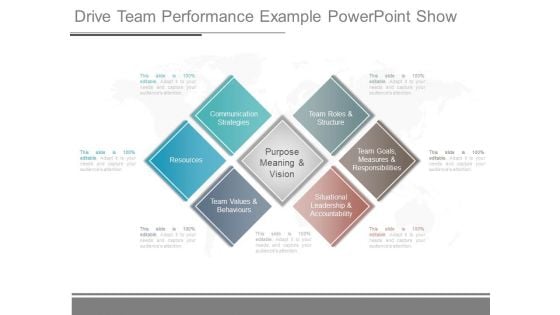
Drive Team Performance Example Powerpoint Show
This is a drive team performance example powerpoint show. This is a six stage process. The stages in this process are communication strategies, resources, team values and behaviours, purpose meaning and vision, team roles and structure, team goals, measures and responsibilities, situational leadership and accountability.
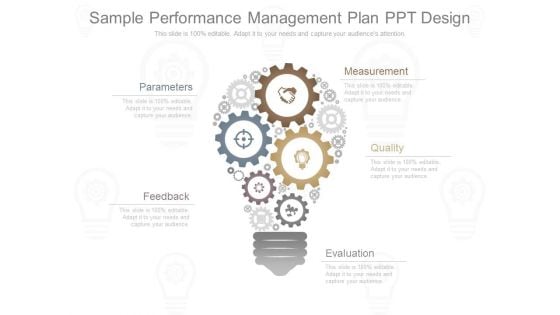
Sample Performance Management Plan Ppt Design
This is a sample performance management plan ppt design. This is a one stage process. The stages in this process are parameters, measurement, feedback, quality, evaluation.
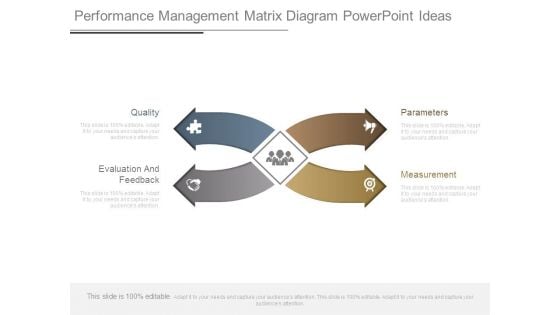
Performance Management Matrix Diagram Powerpoint Ideas
This is a performance management matrix diagram powerpoint ideas. This is a four stage process. The stages in this process are quality, evaluation and feedback, parameters, measurement.
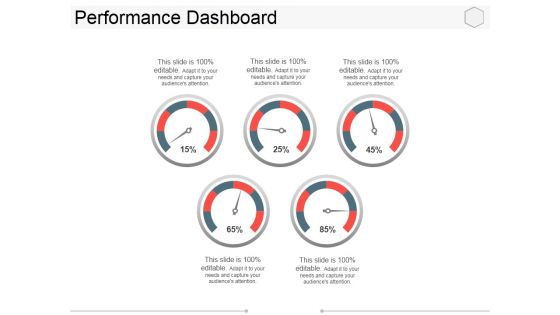
Performance Dashboard Ppt PowerPoint Presentation Layouts Styles
This is a performance dashboard ppt powerpoint presentation layouts styles. This is a five stage process. The stages in this process are process, measurement, dashboard, business, marketing.
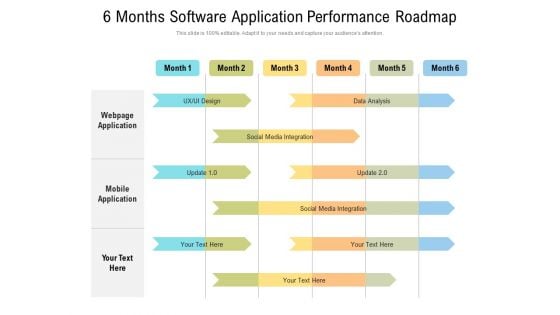
6 Months Software Application Performance Roadmap Designs
Presenting our innovatively-structured 6 months software application performance roadmap designs Template. Showcase your roadmap process in different formats like PDF, PNG, and JPG by clicking the download button below. This PPT design is available in both Standard Screen and Widescreen aspect ratios. It can also be easily personalized and presented with modified font size, font type, color, and shapes to measure your progress in a clear way.

Sustainable Power Usage Effectiveness PUE Performance Metric
This slide outlines the power usage effectiveness performance metric of data center performance. The purpose of this slide is to showcase the methods to calculate the PUE of a data center and how it helps data center operators to reduce energy costs and improve the environmental impact of data center operations. Find highly impressive Sustainable Power Usage Effectiveness PUE Performance Metric on Slidegeeks to deliver a meaningful presentation. You can save an ample amount of time using these presentation templates. No need to worry to prepare everything from scratch because Slidegeeks experts have already done a huge research and work for you. You need to download Sustainable Power Usage Effectiveness PUE Performance Metric for your upcoming presentation. All the presentation templates are 100 percent editable and you can change the color and personalize the content accordingly. Download now This slide outlines the power usage effectiveness performance metric of data center performance. The purpose of this slide is to showcase the methods to calculate the PUE of a data center and how it helps data center operators to reduce energy costs and improve the environmental impact of data center operations.

Performance Metrics Domotics Go To Market Strategy GTM SS V
The following slide outlines various KPIs to track and measure smart home automation startup operational performance. The metrics are CAC, CLTV, churn rate MRR, ARPU, etc.This modern and well-arranged Performance Metrics Domotics Go To Market Strategy GTM SS V provides lots of creative possibilities. It is very simple to customize and edit with the Powerpoint Software. Just drag and drop your pictures into the shapes. All facets of this template can be edited with Powerpoint, no extra software is necessary. Add your own material, put your images in the places assigned for them, adjust the colors, and then you can show your slides to the world, with an animated slide included. The following slide outlines various KPIs to track and measure smart home automation startup operational performance. The metrics are CAC, CLTV, churn rate MRR, ARPU, etc.

Performance Metrics Smart Home Startup GTM Strategy GTM SS V
The following slide outlines various KPIs to track and measure smart home automation startup operational performance. The metrics are CAC, CLTV, churn rate MRR, ARPU, etc.Welcome to our selection of the Performance Metrics Smart Home Startup GTM Strategy GTM SS V. These are designed to help you showcase your creativity and bring your sphere to life. Planning and Innovation are essential for any business that is just starting out. This collection contains the designs that you need for your everyday presentations. All of our PowerPoints are 100 percent editable, so you can customize them to suit your needs. This multi-purpose template can be used in various situations. Grab these presentation templates today. The following slide outlines various KPIs to track and measure smart home automation startup operational performance. The metrics are CAC, CLTV, churn rate MRR, ARPU, etc.
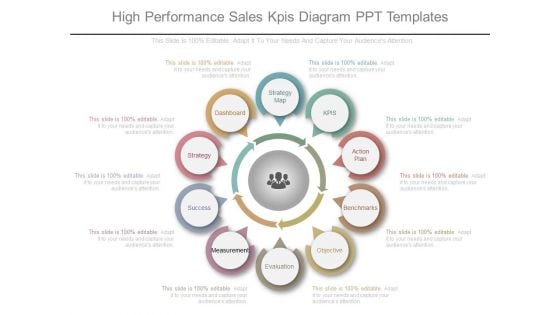
High Performance Sales Kpis Diagram Ppt Templates
This is a high performance sales kpis diagram ppt templates. This is a ten stage process. The stages in this process are strategy map, kpis, action plan, benchmarks, objective, evaluation, measurement, success, strategy, dashboard.
Client Self Service Key Performance Indicators Icons Pdf
The following slide highlights key performance indicators of customer self service to offer enterprises actual and desired cost of support, measure efficiency etc. It includes key performance indicators such as net promoter score, customer effort score, self-service re-contact rate, conversion ratio and case deflection rate. Pitch your topic with ease and precision using this Client Self Service Key Performance Indicators Icons Pdf. This layout presents information on Description, Target, Actual. It is also available for immediate download and adjustment. So, changes can be made in the color, design, graphics or any other component to create a unique layout. The following slide highlights key performance indicators of customer self service to offer enterprises actual and desired cost of support, measure efficiency etc. It includes key performance indicators such as net promoter score, customer effort score, self-service re-contact rate, conversion ratio and case deflection rate.
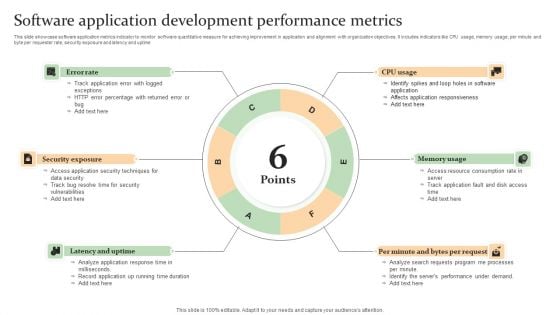
Software Application Development Performance Metrics Mockup PDF
This slide showcase software application metrics indicator to monitor software quantitative measure for achieving improvement in application and alignment with organization objectives. It includes indicators like CPU usage, memory usage, per minute and byte per requester rate, security exposure and latency and uptime Persuade your audience using this Software Application Development Performance Metrics Mockup PDF. This PPT design covers Six stages, thus making it a great tool to use. It also caters to a variety of topics including Latency And Uptime, Memory Usage, Security Exposure . Download this PPT design now to present a convincing pitch that not only emphasizes the topic but also showcases your presentation skills.
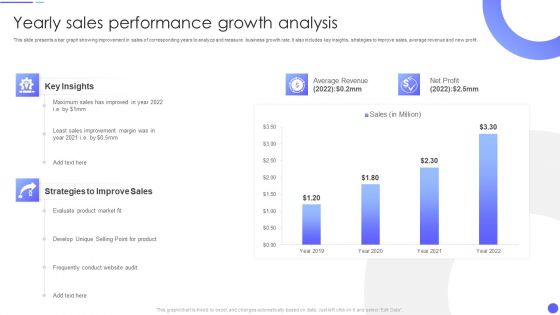
Yearly Sales Performance Growth Analysis Rules PDF
This slide presents a bar graph showing improvement in sales of corresponding years to analyze and measure business growth rate. It also includes key insights, strategies to improve sales, average revenue and new profit.Pitch your topic with ease and precision using this Yearly Sales Performance Growth Analysis Rules PDF This layout presents information on Average Revenue, Strategies To Improve, Sales Improvement It is also available for immediate download and adjustment. So, changes can be made in the color, design, graphics or any other component to create a unique layout.
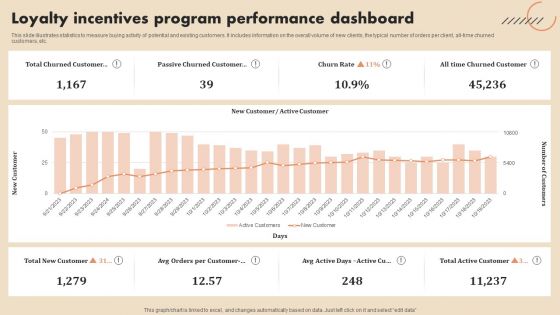
Loyalty Incentives Program Performance Dashboard Microsoft PDF
This slide illustrates statistics to measure buying activity of potential and existing customers. It includes information on the overall volume of new clients, the typical number of orders per client, all time churned customers, etc.Showcasing this set of slides titled Loyalty Incentives Program Performance Dashboard Microsoft PDF. The topics addressed in these templates are Total Churned Customer, Passive Churned Customer. All the content presented in this PPT design is completely editable. Download it and make adjustments in color, background, font etc. as per your unique business setting.
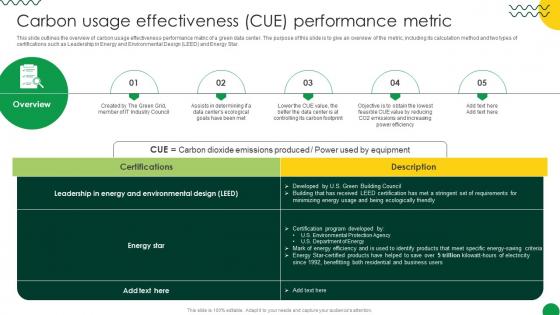
Sustainable Carbon Usage Effectiveness CUE Performance Metric
This slide outlines the overview of carbon usage effectiveness performance matric of a green data center. The purpose of this slide is to give an overview of the metric, including its calculation method and two types of certifications such as Leadership in Energy and Environmental Design LEED and Energy Star. Find highly impressive Sustainable Carbon Usage Effectiveness CUE Performance Metric on Slidegeeks to deliver a meaningful presentation. You can save an ample amount of time using these presentation templates. No need to worry to prepare everything from scratch because Slidegeeks experts have already done a huge research and work for you. You need to download Sustainable Carbon Usage Effectiveness CUE Performance Metric for your upcoming presentation. All the presentation templates are 100 percent editable and you can change the color and personalize the content accordingly. Download now This slide outlines the overview of carbon usage effectiveness performance matric of a green data center. The purpose of this slide is to give an overview of the metric, including its calculation method and two types of certifications such as Leadership in Energy and Environmental Design LEED and Energy Star.
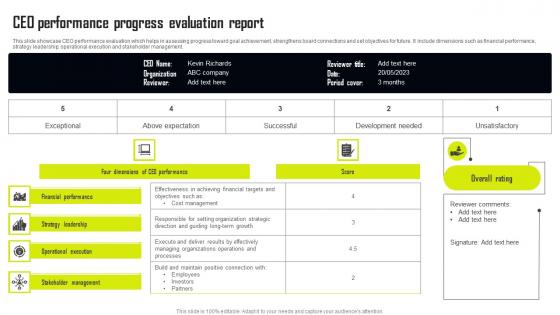
CEO Performance Progress Evaluation Report Diagrams Pdf
This slide showcase CEO performance evaluation which helps in assessing progress toward goal achievement, strengthens board connections and set objectives for future. It include dimensions such as financial performance, strategy leadership, operational execution and stakeholder management. Pitch your topic with ease and precision using this CEO Performance Progress Evaluation Report Diagrams Pdf This layout presents information on Financial Performance, Strategy Leadership, Operational Execution It is also available for immediate download and adjustment. So, changes can be made in the color, design, graphics or any other component to create a unique layout. This slide showcase CEO performance evaluation which helps in assessing progress toward goal achievement, strengthens board connections and set objectives for future. It include dimensions such as financial performance, strategy leadership, operational execution and stakeholder management.
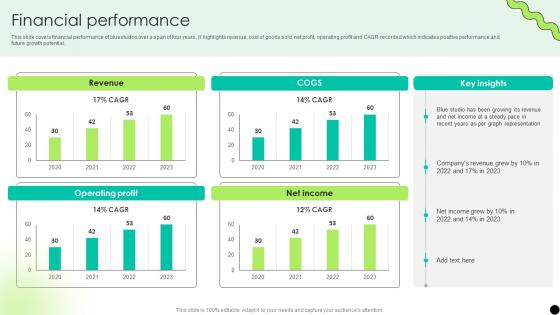
Financial Performance Digital Payment Platform Pitch Deck
This slide covers financial performance of bluestudios over a span of four years. It highlights revenue, cost of goods sold, net profit, operating profit and CAGR recorded which indicates positive performance and future growth potential. From laying roadmaps to briefing everything in detail, our templates are perfect for you. You can set the stage with your presentation slides. All you have to do is download these easy-to-edit and customizable templates. Financial Performance Digital Payment Platform Pitch Deck will help you deliver an outstanding performance that everyone would remember and praise you for. Do download this presentation today. This slide covers financial performance of bluestudios over a span of four years. It highlights revenue, cost of goods sold, net profit, operating profit and CAGR recorded which indicates positive performance and future growth potential.
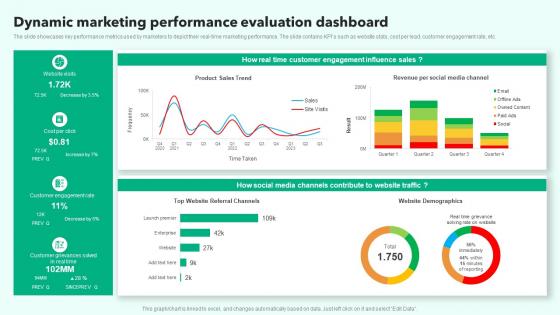
Dynamic Marketing Performance Evaluation Dashboard Microsoft Pdf
The slide showcases key performance metrics used by marketers to depict their real time marketing performance. The slide contains KPIs such as website stats, cost per lead, customer engagement rate, etc. Pitch your topic with ease and precision using this Dynamic Marketing Performance Evaluation Dashboard Microsoft Pdf. This layout presents information on Influence Sales, Customer Engagement, Customer Engagement Rate. It is also available for immediate download and adjustment. So, changes can be made in the color, design, graphics or any other component to create a unique layout. The slide showcases key performance metrics used by marketers to depict their real time marketing performance. The slide contains KPIs such as website stats, cost per lead, customer engagement rate, etc.

Performance Review Process Powerpoint Presentation Slides
Boost your market performance by sing our comprehensive and professionally designed PowerPoint presentation Performance Review Process Powerpoint Presentation Slides that includes key features such as tools for employee assessments, promotions, appraisals, cost accounting, and confidential record management, ensuring a holistic approach to performance improvement. This PPT offers data driven insights to streamline overall performance strategy. The performance coaching presentation template helps you to review the productivity and profitability of your organization. Download this performance management presentation deck and achieve your business target in an effective manner. Boost your market performance by sing our comprehensive and professionally designed PowerPoint presentation Performance Review Process Powerpoint Presentation Slides that includes key features such as tools for employee assessments, promotions, appraisals, cost accounting, and confidential record management, ensuring a holistic approach to performance improvement. This PPT offers data driven insights to streamline overall performance strategy. The performance coaching presentation template helps you to review the productivity and profitability of your organization. Download this performance management presentation deck and achieve your business target in an effective manner.
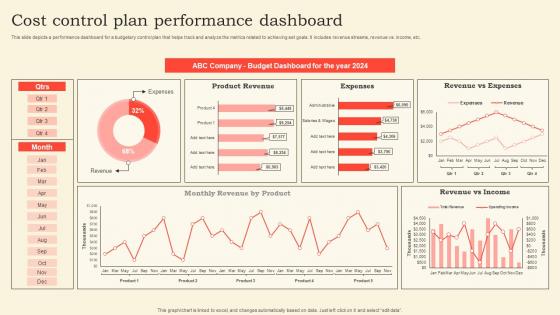
Cost Control Plan Performance Dashboard Pictures Pdf
This slide depicts a performance dashboard for a budgetary control plan that helps track and analyze the metrics related to achieving set goals. It includes revenue streams, revenue vs. income, etc. Pitch your topic with ease and precision using this Cost Control Plan Performance Dashboard Pictures Pdf. This layout presents information on Dashboard, Expenses, Income. It is also available for immediate download and adjustment. So, changes can be made in the color, design, graphics or any other component to create a unique layout. This slide depicts a performance dashboard for a budgetary control plan that helps track and analyze the metrics related to achieving set goals. It includes revenue streams, revenue vs. income, etc.
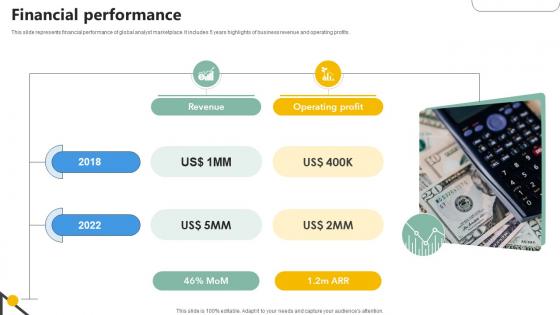
Financial Performance Analytics Company Investor Funding Elevator
This slide represents financial performance of global analyst marketplace. It includes 5 years highlights of business revenue and operating profits.Retrieve professionally designed Financial Performance Analytics Company Investor Funding Elevator to effectively convey your message and captivate your listeners. Save time by selecting pre-made slideshows that are appropriate for various topics, from business to educational purposes. These themes come in many different styles, from creative to corporate, and all of them are easily adjustable and can be edited quickly. Access them as PowerPoint templates or as Google Slides themes. You do not have to go on a hunt for the perfect presentation because Slidegeeks got you covered from everywhere. This slide represents financial performance of global analyst marketplace. It includes 5 years highlights of business revenue and operating profits.
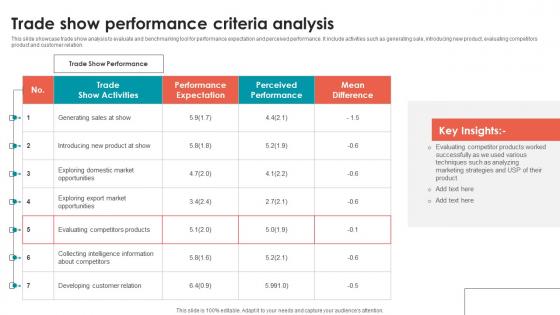
Trade Show Performance Criteria Analysis Inspiration Pdf
This slide showcase trade show analysis to evaluate and benchmarking tool for performance expectation and perceived performance. It include activities such as generating sale, introducing new product, evaluating competitors product and customer relation. Pitch your topic with ease and precision using this Trade Show Performance Criteria Analysis Inspiration Pdf. This layout presents information on Market Opportunities, Evaluating Competitors Products, Developing Customer Relation. It is also available for immediate download and adjustment. So, changes can be made in the color, design, graphics or any other component to create a unique layout. This slide showcase trade show analysis to evaluate and benchmarking tool for performance expectation and perceived performance. It include activities such as generating sale, introducing new product, evaluating competitors product and customer relation.
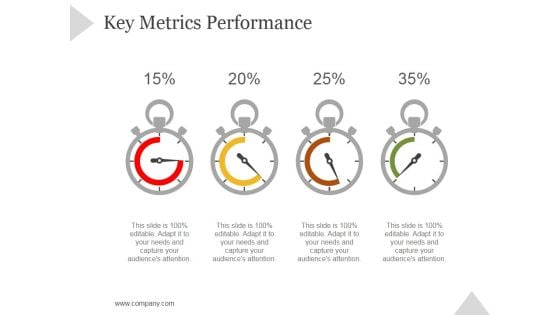
Key Metrics Performance Ppt PowerPoint Presentation Tips
This is a key metrics performance ppt powerpoint presentation tips. This is a four stage process. The stages in this process are business, strategy, marketing, success, dashboard, measuring.
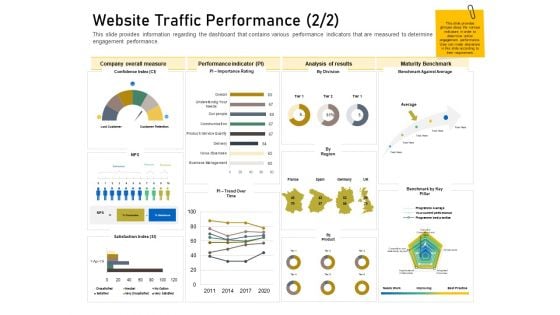
Enhancing Customer Engagement Digital Platform Website Traffic Performance Time Infographics PDF
Deliver and pitch your topic in the best possible manner with this enhancing customer engagement digital platform website traffic performance time infographics pdf. Use them to share invaluable insights on measure, performance, analysis, maturity and impress your audience. This template can be altered and modified as per your expectations. So, grab it now.
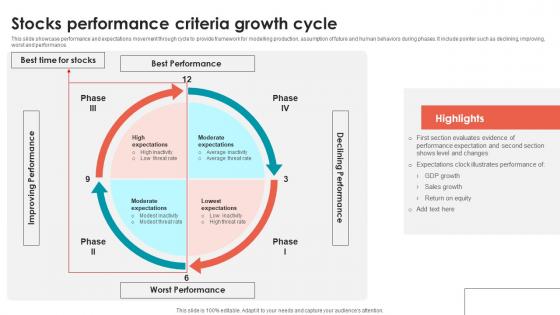
Stocks Performance Criteria Growth Cycle Demonstration Pdf
This slide showcase performance and expectations movement through cycle to provide framework for modelling production, assumption of future and human behaviors during phases. It include pointer such as declining, improving, worst and performance. Showcasing this set of slides titled Stocks Performance Criteria Growth Cycle Demonstration Pdf. The topics addressed in these templates are Moderate Expectations, Lowest Expectations, Average Inactivity. All the content presented in this PPT design is completely editable. Download it and make adjustments in color, background, font etc. as per your unique business setting. This slide showcase performance and expectations movement through cycle to provide framework for modelling production, assumption of future and human behaviors during phases. It include pointer such as declining, improving, worst and performance.
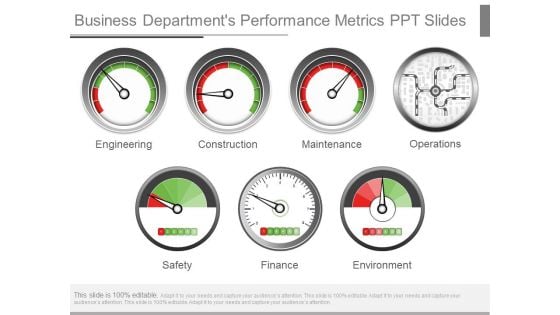
Business Departments Performance Metrics Ppt Slides
This is a business departments performance metrics ppt slides. This is a seven stage process. The stages in this process are engineering, construction, maintenance, operations, safety, finance, environment.
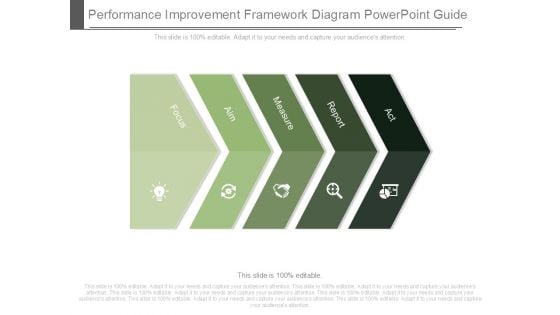
Performance Improvement Framework Diagram Powerpoint Guide
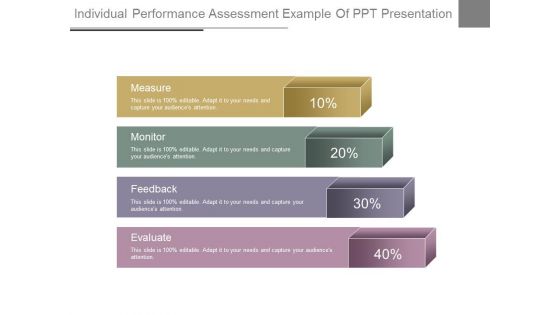
Individual Performance Assessment Example Of Ppt Presentation
This is an individual performance assessment example of ppt presentation. This is a four stage process. The stages in this process are measure, monitor, feedback, evaluate.

Business Performance Dashboard Analysis Diagram Powerpoint Slides
This is a business performance dashboard analysis diagram powerpoint slides. This is a three stage process. The stages in this process are measure, business, management, presentation, process.

Key Performance Indicators Sample Diagram Ppt Slides
This is a Key Performance Indicators Sample Diagram Ppt Slides. This is a four stage process. The stages in this process are strategize, measure, innovate, propagate.
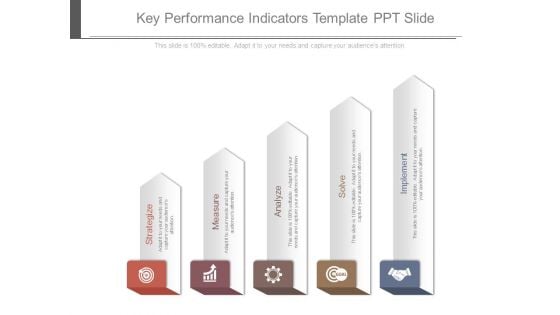
Key Performance Indicators Template Ppt Slide
This is a key performance indicators template ppt slide. This is a five stage process. The stages in this process are strategize, measure, analyze, solve, implement.
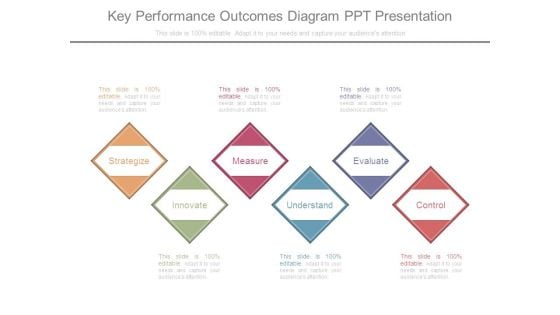
Key Performance Outcomes Diagram Ppt Presentation
This is a key performance outcomes diagram ppt presentation. This is a six stage process. The stages in this process are strategize, innovate, measure, evaluate, control, understand.
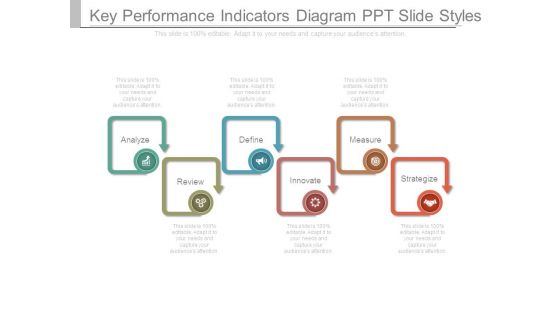
Key Performance Indicators Diagram Ppt Slide Styles
This is a key performance indicators diagram ppt slide styles. This is a six stage process. The stages in this process are analyze, define, measure, review, innovate, strategize.
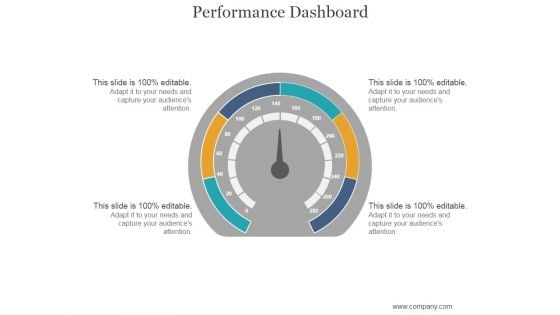
Performance Dashboard Ppt PowerPoint Presentation Show
This is a performance dashboard ppt powerpoint presentation show. This is a one stage process. The stages in this process are business, dashboard, measure, management, marketing.


 Continue with Email

 Home
Home


