Performance Measurement
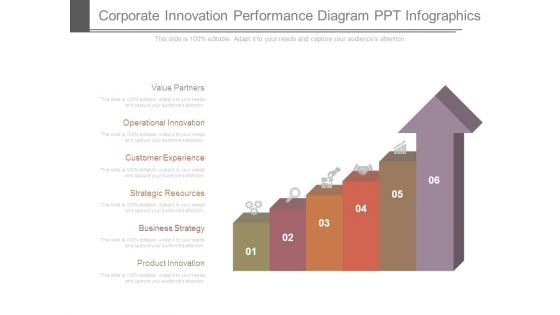
Corporate Innovation Performance Diagram Ppt Infographics
This is a corporate innovation performance diagram ppt infographics. This is a six stage process. The stages in this process are value partners, operational innovation, customer experience, strategic resources, business strategy, product innovation.
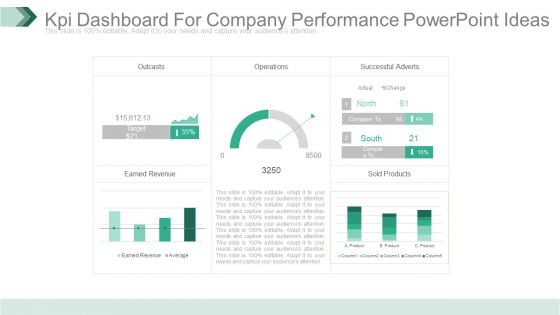
Kpi Dashboard For Company Performance Powerpoint Ideas
This is a kpi dashboard for company performance powerpoint ideas. This is a five stage process. The stages in this process are outcasts, operations, successful adverts, earned revenue, sold products.
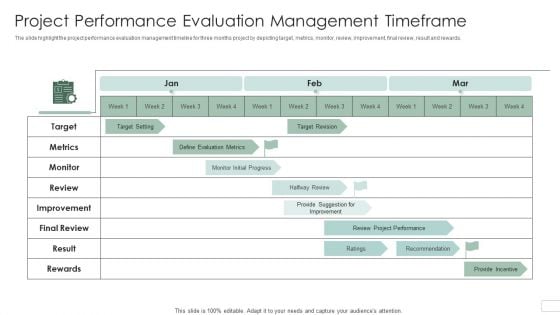
Project Performance Evaluation Management Timeframe Professional PDF
The slide highlight the project performance evaluation management timeline for three months project by depicting target, metrics, monitor, review, improvement, final review, result and rewards. Showcasing this set of slides titled Project Performance Evaluation Management Timeframe Professional PDF. The topics addressed in these templates are Final Review, Target, Metrics. All the content presented in this PPT design is completely editable. Download it and make adjustments in color, background, font etc. as per your unique business setting.
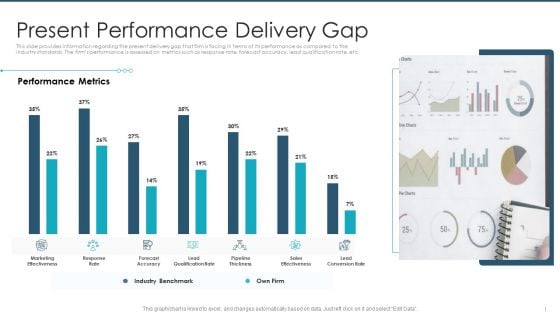
Present Performance Delivery Gap Professional PDF
This slide provides information regarding the present delivery gap that firm is facing in terms of its performance as compared to the industry standards. The firms performance is assessed on metrics such as response rate, forecast accuracy, lead qualification rate, etc. Deliver and pitch your topic in the best possible manner with this present performance delivery gap professional pdf. Use them to share invaluable insights on marketing effectiveness, response rate lead qualification rate, sales effectivenessand impress your audience. This template can be altered and modified as per your expectations. So, grab it now.
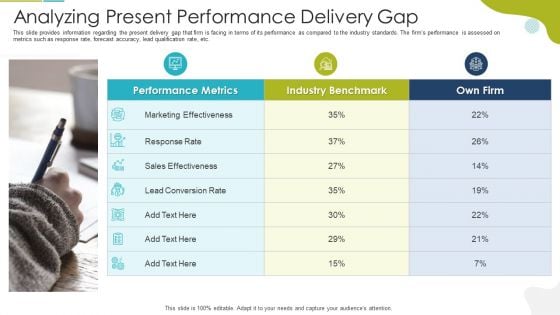
Analyzing Present Performance Delivery Gap Information PDF
This slide provides information regarding the present delivery gap that firm is facing in terms of its performance as compared to the industry standards. The firms performance is assessed on metrics such as response rate, forecast accuracy, lead qualification rate, etc. This is a analyzing present performance delivery gap information pdf template with various stages. Focus and dispense information on three stages using this creative set, that comes with editable features. It contains large content boxes to add your information on topics like marketing effectiveness, lead conversion rate, response rate . You can also showcase facts, figures, and other relevant content using this PPT layout. Grab it now.
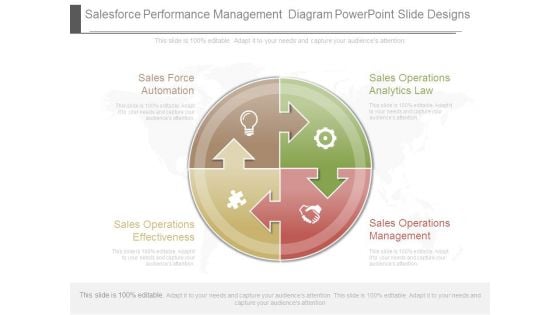
Salesforce Performance Management Diagram Powerpoint Slide Designs
This is a salesforce performance management diagram powerpoint slide designs. This is a four stage process. The stages in this process are sales force automation, sales operations effectiveness, sales operations analytics law, sales operations management.
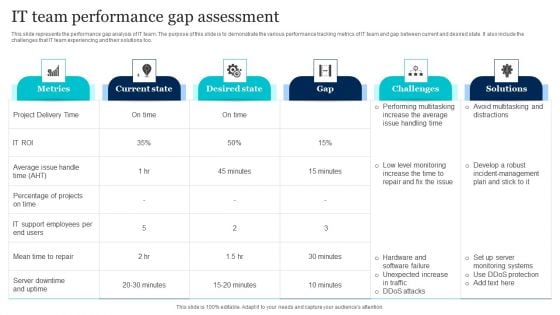
IT Team Performance Gap Assessment Slides PDF
This slide represents the performance gap analysis of IT team. The purpose of this slide is to demonstrate the various performance tracking metrics of IT team and gap between current and desired state. It also include the challenges that IT team experiencing and their solutions too. Pitch your topic with ease and precision using this IT Team Performance Gap Assessment Slides PDF. This layout presents information on Develop, Incident Management, Plan. It is also available for immediate download and adjustment. So, changes can be made in the color, design, graphics or any other component to create a unique layout.
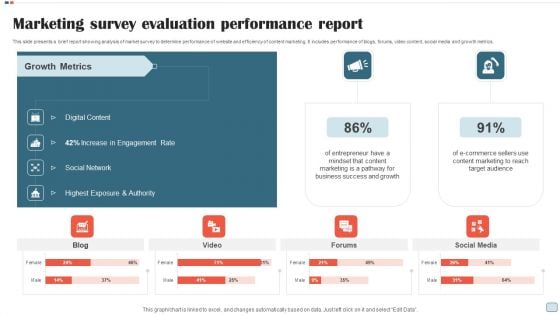
Marketing Survey Evaluation Performance Report Guidelines PDF
This slide presents a brief report showing analysis of market survey to determine performance of website and efficiency of content marketing. It includes performance of blogs, forums, video content, social media and growth metrics. Showcasing this set of slides titled Marketing Survey Evaluation Performance Report Guidelines PDF. The topics addressed in these templates are Digital Content, Engagement Rate, Social Network, Business Success, Growth. All the content presented in this PPT design is completely editable. Download it and make adjustments in color, background, font etc. as per your unique business setting.
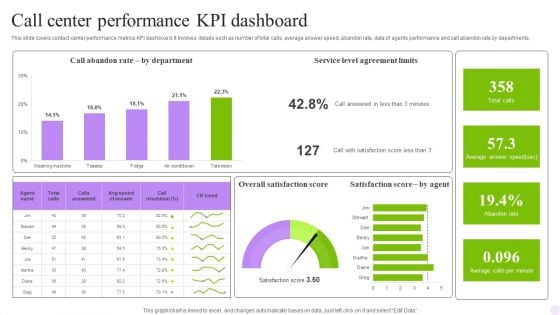
Call Center Performance KPI Dashboard Formats PDF
This slide covers contact center performance metrics KPI dashboard. It involves details such as number of total calls, average answer speed, abandon rate, data of agents performance and call abandon rate by departments. Showcasing this set of slides titled Call Center Performance KPI Dashboard Formats PDF. The topics addressed in these templates are Department, Dashboard, Agreement Limits. All the content presented in this PPT design is completely editable. Download it and make adjustments in color, background, font etc. as per your unique business setting.

Procurement KPI Performance Benchmark Professional PDF
This slide covers the procurement performance benchmarks for the organizations such as spend under management, cost avoidance, vender performance etc. Deliver and pitch your topic in the best possible manner with this Procurement KPI Performance Benchmark Professional PDF. Use them to share invaluable insights on Under Management, Cost Of Ownership, Average Payment and impress your audience. This template can be altered and modified as per your expectations. So, grab it now.
Loyalty Program Performance Tracking Dashboard Topics PDF
This slide covers the KPI dashboard for analyzing customer loyalty campaign results. It includes metrics such as revenue, liability, NQP accrued, transaction count, members, redemption ratio, etc. Deliver an awe inspiring pitch with this creative Loyalty Program Performance Tracking Dashboard Topics PDF bundle. Topics like Loyalty Program Performance, Tracking Dashboard can be discussed with this completely editable template. It is available for immediate download depending on the needs and requirements of the user.
Referral Program Performance Tracking Dashboard Summary PDF
This slide covers the KPI dashboard for analyzing referral campaign results. It includes metrics such as total revenue generated, monthly recurring revenue, new customers, clicks, cancelled customers, paying customers, etc. Deliver and pitch your topic in the best possible manner with this Referral Program Performance Tracking Dashboard Summary PDF. Use them to share invaluable insights on Referral Program Performance, Tracking Dashboard and impress your audience. This template can be altered and modified as per your expectations. So, grab it now.
Dashboard For Tracking Website Performance Professional PDF
This slide covers the KPI dashboard for analyzing the company website. It includes metrics such as conversions, conversion rate, sessions, stickiness, bounce rate, engagement, etc. Deliver and pitch your topic in the best possible manner with this Dashboard For Tracking Website Performance Professional PDF. Use them to share invaluable insights on Dashboard For Tracking, Website Performance and impress your audience. This template can be altered and modified as per your expectations. So, grab it now.
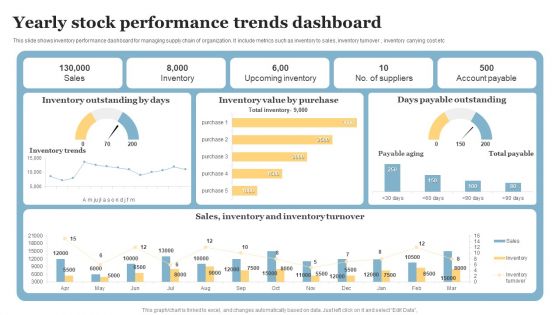
Yearly Stock Performance Trends Dashboard Designs PDF
This slide shows inventory performance dashboard for managing supply chain of organization. It include metrics such as inventory to sales, inventory turnover , inventory carrying cost etc. Showcasing this set of slides titled Yearly Stock Performance Trends Dashboard Designs PDF. The topics addressed in these templates are Inventory Outstanding Days, Days Payable Outstanding, Inventory Value Purchase. All the content presented in this PPT design is completely editable. Download it and make adjustments in color, background, font etc. as per your unique business setting.
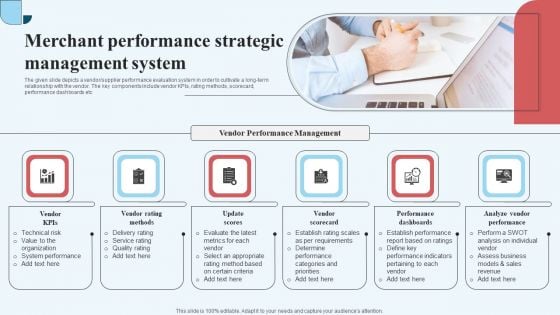
Merchant Performance Strategic Management System Inspiration PDF
The given slide depicts a vendor or supplier performance evaluation system in order to cultivate a long-term relationship with the vendor. The key components include vendor KPIs, rating methods, scorecard, performance dashboards etc. Persuade your audience using this Merchant Performance Strategic Management System Inspiration PDF. This PPT design covers six stages, thus making it a great tool to use. It also caters to a variety of topics including Vendor Scorecard, Performance Dashboards, Analyze Vendor Performance. Download this PPT design now to present a convincing pitch that not only emphasizes the topic but also showcases your presentation skills.
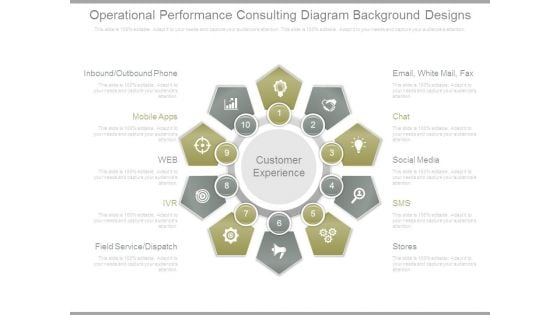
Operational Performance Consulting Diagram Background Designs
This is a operational performance consulting diagram background designs. This is a ten stage process. The stages in this process are email white mail fax, chat, social media, sms, stores, customer experience, inbound outbound phone, mobile apps, web, ivr, field service dispatch.
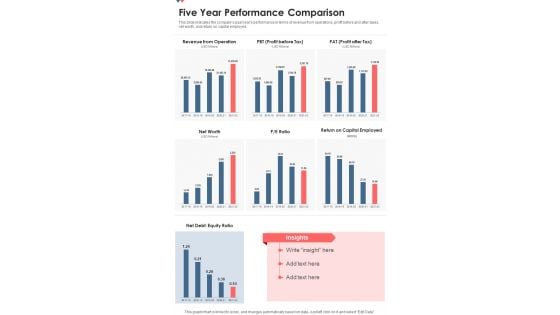
Five Year Performance Comparison One Pager Documents
This slide indicates the companys past years performance in terms of revenue from operations, profit before and after taxes, net worth, and return on capital employed. Presenting you a fantastic Five Year Performance Comparison One Pager Documents. This piece is crafted on hours of research and professional design efforts to ensure you have the best resource. It is completely editable and its design allow you to rehash its elements to suit your needs. Get this Five Year Performance Comparison One Pager Documents A4 One-pager now.
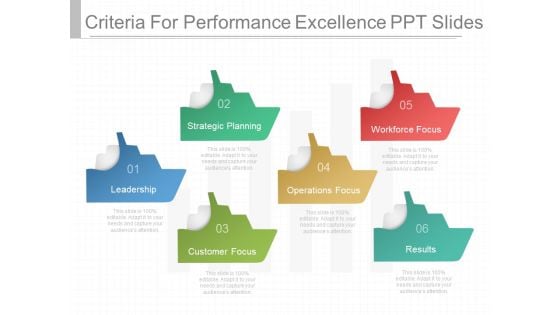
Criteria For Performance Excellence Ppt Slides

Sales Improvement Performance Cycle Diagram Powerpoint Show
This is a sales improvement performance cycle diagram powerpoint show. This is a six stage process. The stages in this process are execution enablement, strategy and operations, accountability, motivation, staffing, capability.
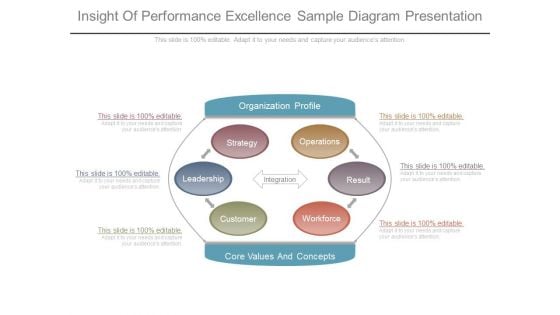
Insight Of Performance Excellence Sample Diagram Presentation
This is a insight of performance excellence sample diagram presentation. This is a six stage process. The stages in this process are organization profile, strategy, leadership, customer, workforce, result, operations, integration.
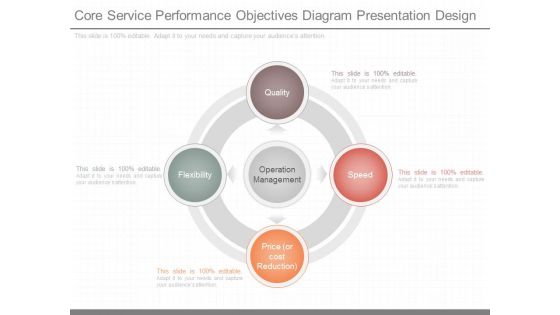
Core Service Performance Objectives Diagram Presentation Design
This is a core service performance objectives diagram presentation design. This is a four stage process. The stages in this process are operation management, quality, flexibility, price or cost reduction, speed.
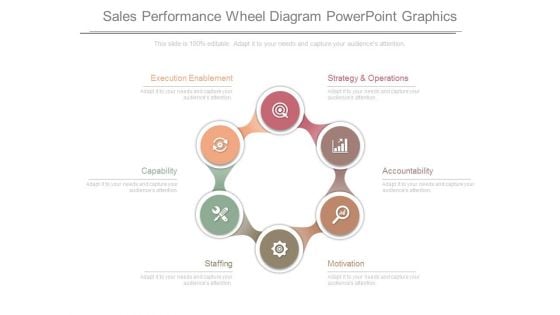
Sales Performance Wheel Diagram Powerpoint Graphics
This is a sales performance wheel diagram powerpoint graphics. This is a six stage process. The stages in this process are strategy and operations, accountability, motivation, staffing, capability, execution enablement.
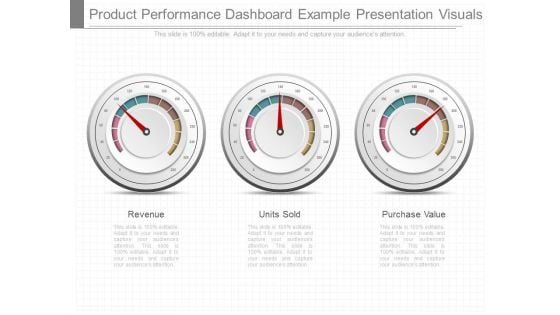
Product Performance Dashboard Example Presentation Visuals
This is a product performance dashboard example presentation visuals. This is a three stage process. The stages in this process are revenue, units sold, purchase value.

Testing Product Performance Ppt PowerPoint Presentation Slides
This is a testing product performance ppt powerpoint presentation slides. This is a three stage process. The stage in this process are venn, business, process, circular, arrows.
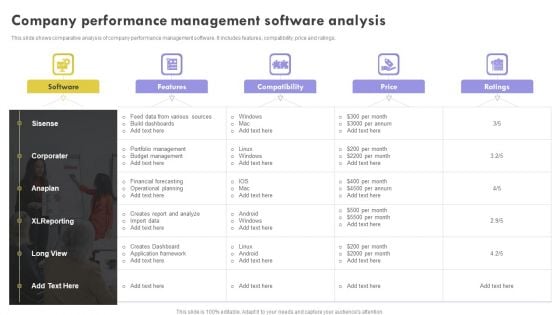
Company Performance Management Software Analysis Pictures PDF
This slide shows comparative analysis of company performance management software. It includes features, compatibility, price and ratings.Presenting Company Performance Management Software Analysis Pictures PDF to dispense important information. This template comprises one stages. It also presents valuable insights into the topics including Build dashboards, Financial forecasting, Operational planning. This is a completely customizable PowerPoint theme that can be put to use immediately. So, download it and address the topic impactfully.
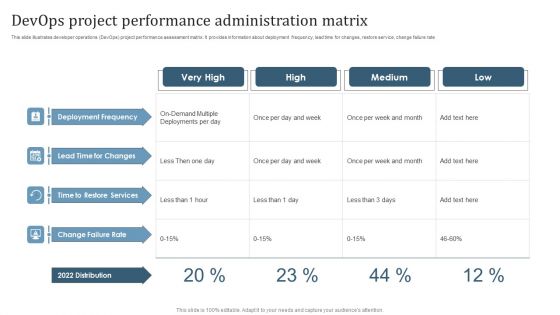
Devops Project Performance Administration Matrix Mockup PDF
This slide illustrates developer operations DevOps project performance assessment matrix. It provides information about deployment frequency, lead time for changes, restore service, change failure rate. Pitch your topic with ease and precision using this Devops Project Performance Administration Matrix Mockup PDF. This layout presents information on Deployment Frequency, Time To Restore Services, Change Failure Rate. It is also available for immediate download and adjustment. So, changes can be made in the color, design, graphics or any other component to create a unique layout.
Performance Benchmark Evaluation Analysis Icon Summary PDF
Presenting Performance Benchmark Evaluation Analysis Icon Summary PDF to dispense important information. This template comprises three stages. It also presents valuable insights into the topics including Performance Benchmark, Evaluation Analysis Icon. This is a completely customizable PowerPoint theme that can be put to use immediately. So, download it and address the topic impactfully.
Overall Brand Performance Tracking Dashboard Microsoft PDF
This slide provides information regarding brand performance tracking dashboard capturing KPIs such as brand metric, brand commitment, advertising metrics, and purchase metrics. Slidegeeks is here to make your presentations a breeze with Overall Brand Performance Tracking Dashboard Microsoft PDF With our easy to use and customizable templates, you can focus on delivering your ideas rather than worrying about formatting. With a variety of designs to choose from, you are sure to find one that suits your needs. And with animations and unique photos, illustrations, and fonts, you can make your presentation pop. So whether you are giving a sales pitch or presenting to the board, make sure to check out Slidegeeks first.
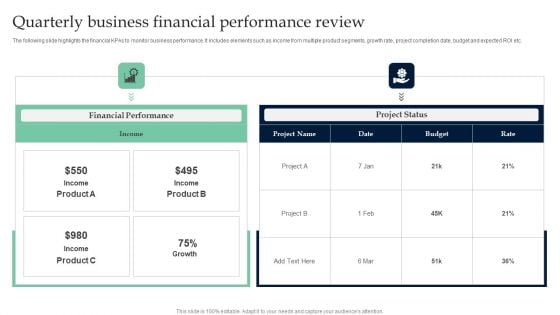
Quarterly Business Financial Performance Review Sample PDF
The following slide highlights the financial KPAs to monitor business performance. It includes elements such as income from multiple product segments, growth rate, project completion date, budget and expected ROI etc. Showcasing this set of slides titled Quarterly Business Financial Performance Review Sample PDF. The topics addressed in these templates are Quarterly Business, Financial Performance Review. All the content presented in this PPT design is completely editable. Download it and make adjustments in color, background, font etc. as per your unique business setting.
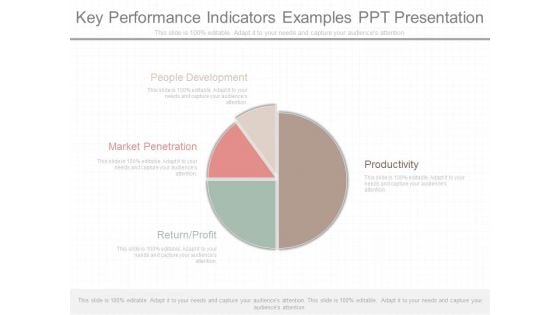
Key Performance Indicators Examples Ppt Presentation
This is a key performance indicators examples ppt presentation. This is a four stage process. The stages in this process are people development, productivity, market penetration, return profit.
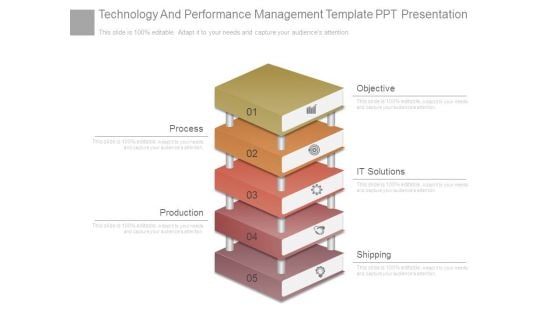
Technology And Performance Management Template Ppt Presentation
This is a technology and performance management template ppt presentation. This is a five stage process. The stages in this process are objective, process, production, it solutions, shipping.
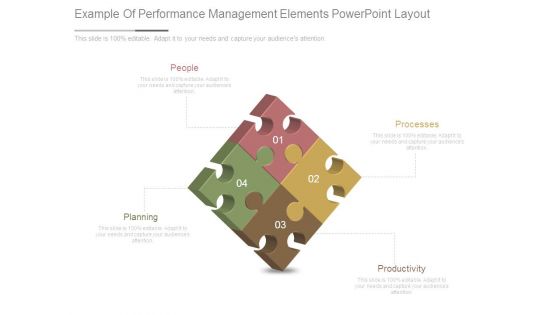
Example Of Performance Management Elements Powerpoint Layout
This is a example of performance management elements powerpoint layout. This is a four stage process. The stages in this process are people, processes, planning, productivity.
Monthly Retail Stock Performance Dashboard Icons PDF
This slide shows monthly inventory performance of retail products for analyzing monthly in stock an out-stock with their values. It include metrics like current inventory available, current inventory value and closing monthly stock etc. Showcasing this set of slides titled Monthly Retail Stock Performance Dashboard Icons PDF. The topics addressed in these templates are Current Inventory Available, Current Inventory Value. All the content presented in this PPT design is completely editable. Download it and make adjustments in color, background, font etc. as per your unique business setting.
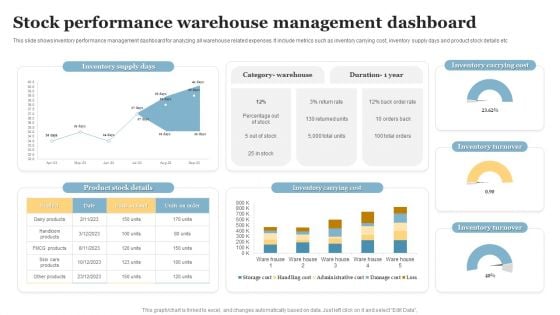
Stock Performance Warehouse Management Dashboard Brochure PDF
This slide shows inventory performance management dashboard for analyzing all warehouse related expenses. It include metrics such as inventory carrying cost, inventory supply days and product stock details etc. Showcasing this set of slides titled Stock Performance Warehouse Management Dashboard Brochure PDF. The topics addressed in these templates are Inventory Supply Days, Inventory Carrying Cost, Inventory Turnover. All the content presented in this PPT design is completely editable. Download it and make adjustments in color, background, font etc. as per your unique business setting.
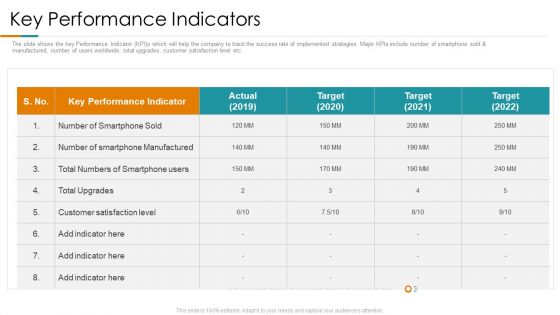
Key Performance Indicators Ppt Inspiration Layouts PDF
The slide shows the key Performance Indicator KPIs which will help the company to track the success rate of implemented strategies. Major KPIs include number of smartphone sold and manufactured, number of users worldwide, total upgrades, customer satisfaction level etc. Deliver an awe-inspiring pitch with this creative key performance indicators ppt inspiration layouts pdf. bundle. Topics like performance, target, manufactured can be discussed with this completely editable template. It is available for immediate download depending on the needs and requirements of the user.
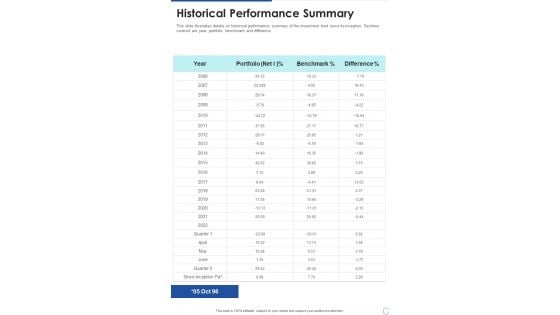
Historical Performance Summary One Pager Documents
This slide illustrates details on historical performance summary of the investment fund since its inception. Sections covered are year, portfolio, benchmark and difference. Presenting you a fantastic Historical Performance Summary One Pager Documents. This piece is crafted on hours of research and professional design efforts to ensure you have the best resource. It is completely editable and its design allow you to rehash its elements to suit your needs. Get this Historical Performance Summary One Pager Documents A4 One-pager now.
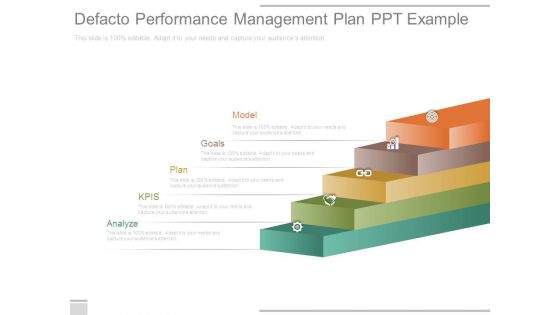
Defacto Performance Management Plan Ppt Example
This is a defacto performance management plan ppt example. This is a five stage process. The stages in this process are model, goals, plan, kpis, analyze.
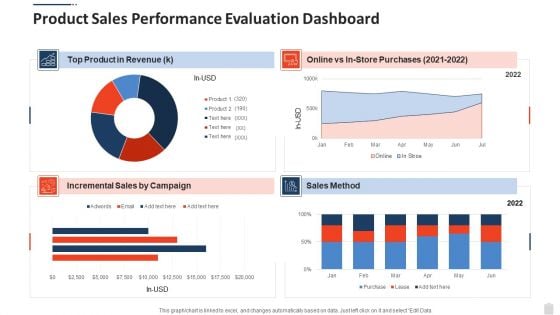
Product Sales Performance Evaluation Dashboard Graphics PDF
Pitch your topic with ease and precision using this product sales performance evaluation dashboard graphics pdf. This layout presents information on product sales performance evaluation dashboard. It is also available for immediate download and adjustment. So, changes can be made in the color, design, graphics or any other component to create a unique layout.
Website Performance Tracking And Monitoring Dashboard Ppt Slides Files PDF
The following slide showcases a dashboard to track and measure website performance. It includes key elements such as visits, average session duration, bounce rate, page views, goal conversion, visits by week, traffic sources, top channels by conversions, etc. Whether you have daily or monthly meetings, a brilliant presentation is necessary. Website Performance Tracking And Monitoring Dashboard Ppt Slides Files PDF can be your best option for delivering a presentation. Represent everything in detail using Website Performance Tracking And Monitoring Dashboard Ppt Slides Files PDF and make yourself stand out in meetings. The template is versatile and follows a structure that will cater to your requirements. All the templates prepared by Slidegeeks are easy to download and edit. Our research experts have taken care of the corporate themes as well. So, give it a try and see the results.
Website Performance Tracking And Monitoring Dashboard Ppt Summary Rules PDF
The following slide showcases a dashboard to track and measure website performance. It includes key elements such as visits, average session duration, bounce rate, page views, goal conversion, visits by week, traffic sources, top channels by conversions, etc. Do you have to make sure that everyone on your team knows about any specific topic I yes, then you should give Website Performance Tracking And Monitoring Dashboard Ppt Summary Rules PDF a try. Our experts have put a lot of knowledge and effort into creating this impeccable Website Performance Tracking And Monitoring Dashboard Ppt Summary Rules PDF. You can use this template for your upcoming presentations, as the slides are perfect to represent even the tiniest detail. You can download these templates from the Slidegeeks website and these are easy to edit. So grab these today.
Website Performance Tracking And Monitoring Dashboard Designs PDF
The following slide showcases a dashboard to track and measure website performance. It includes key elements such as visits, average session duration, bounce rate, page views, goal conversion, visits by week, traffic sources, top channels by conversions, etc. Explore a selection of the finest Website Performance Tracking And Monitoring Dashboard Designs PDF here. With a plethora of professionally designed and pre made slide templates, you can quickly and easily find the right one for your upcoming presentation. You can use our Website Performance Tracking And Monitoring Dashboard Designs PDF to effectively convey your message to a wider audience. Slidegeeks has done a lot of research before preparing these presentation templates. The content can be personalized and the slides are highly editable. Grab templates today from Slidegeeks.
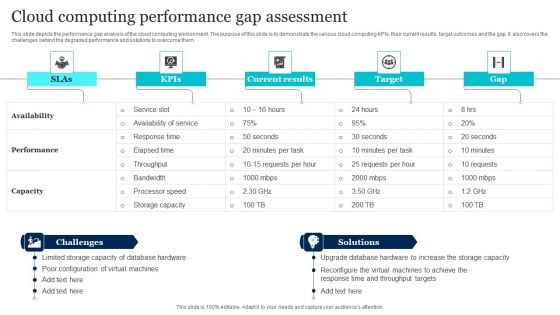
Cloud Computing Performance Gap Assessment Diagrams PDF
This slide depicts the performance gap analysis of the cloud computing environment. The purpose of this slide is to demonstrate the various cloud computing KPIs, their current results, target outcomes and the gap. It also covers the challenges behind the degraded performance and solutions to overcome them. Showcasing this set of slides titled Cloud Computing Performance Gap Assessment Diagrams PDF. The topics addressed in these templates are Performance, Capacity, Target. All the content presented in this PPT design is completely editable. Download it and make adjustments in color, background, font etc. as per your unique business setting.
Search Engine Marketing Develop Campaign Performance Tracking Framework Graphics PDF
The following slide depicts campaign performance management dashboard to measure the results. It includes elements such as conversions funnel, conversion rates, opportunity value, landing pages, sources google, twitter, Facebook etc. This Search Engine Marketing Develop Campaign Performance Tracking Framework Graphics PDF from Slidegeeks makes it easy to present information on your topic with precision. It provides customization options, so you can make changes to the colors, design, graphics, or any other component to create a unique layout. It is also available for immediate download, so you can begin using it right away. Slidegeeks has done good research to ensure that you have everything you need to make your presentation stand out. Make a name out there for a brilliant performance.
Monthly Financial Performance Outcome Reporting Icons PDF
This slide showcases a report showing monthly results financial performance to ensure constant revenue growth. It includes key components such as gross profit margin, operating expenses ratio, operating profit margin, net profit margin, earning before interest and taxes, etc. Showcasing this set of slides titled Monthly Financial Performance Outcome Reporting Icons PDF. The topics addressed in these templates are Operating Expenses, Income Statement, Operating Expenses Ratio. All the content presented in this PPT design is completely editable. Download it and make adjustments in color, background, font etc. as per your unique business setting.
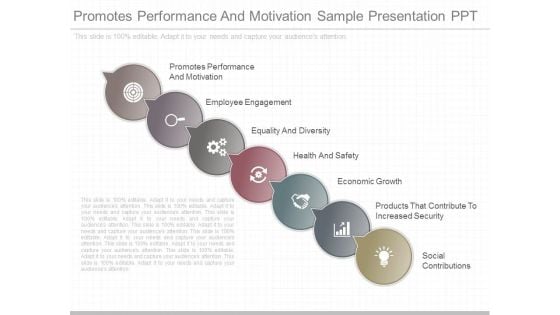
Promotes Performance And Motivation Sample Presentation Ppt
This is a promotes performance and motivation sample presentation ppt. This is a seven stage process. The stages in this process are promotes performance and motivation, employee engagement, equality and diversity, health and safety, economic growth, products that contribute to increased security, social contributions.
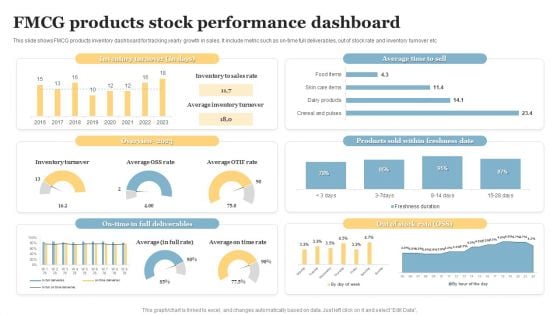
FMCG Products Stock Performance Dashboard Pictures PDF
This slide shows FMCG products inventory dashboard for tracking yearly growth in sales. It include metric such as on-time full deliverables, out of stock rate and inventory turnover etc. Showcasing this set of slides titled FMCG Products Stock Performance Dashboard Pictures PDF. The topics addressed in these templates are Inventory Turnover, Products Sold, Freshness Date. All the content presented in this PPT design is completely editable. Download it and make adjustments in color, background, font etc. as per your unique business setting.

Benchmarks Of High Performance Teams Powerpoint Presentation
This is a benchmarks of high performance teams powerpoint presentation. This is a six stage process. The stages in this process are team effectiveness, empowerment, results, passion, commitment, alignment.

Pharmaceutical Company Key Performance Indicators Clipart PDF
The slide shows the key Performance Indicator KPI s which will help the company to track the success rate of implemented strategies. Major KPIs include number of products sold, pharma products manufactures, research and development expenses per year, total number of patients, etc.Presenting pharmaceutical company key performance indicators clipart pdf to provide visual cues and insights. Share and navigate important information on one stage that need your due attention. This template can be used to pitch topics like research and development, key performance indicator, pharma products manufactured In addtion, this PPT design contains high resolution images, graphics, etc, that are easily editable and available for immediate download.
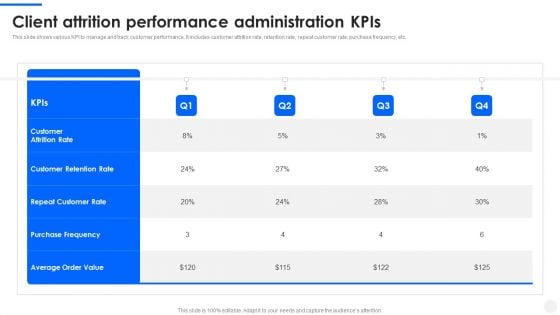
Client Attrition Performance Administration Kpis Topics PDF
This slide shows various KPI to manage and track customer performance. It includes customer attrition rate, retention rate, repeat customer rate, purchase frequency, etc. Pitch your topic with ease and precision using this Client Attrition Performance Administration Kpis Topics PDF. This layout presents information on Customer Retention Rate, Repeat Customer Rate, Purchase Frequency. It is also available for immediate download and adjustment. So, changes can be made in the color, design, graphics or any other component to create a unique layout.
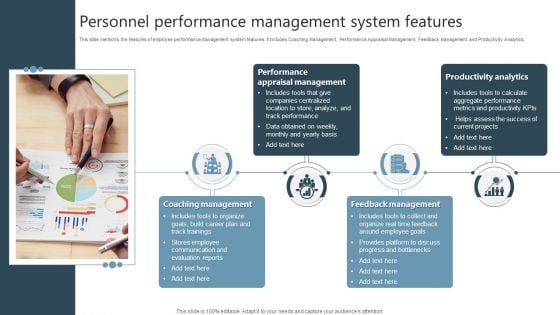
Personnel Performance Management System Features Clipart PDF
This slide mentions the features of employee performance management system features. It includes Coaching Management, Performance Appraisal Management, Feedback Management and Productivity Analytics. Persuade your audience using this Personnel Performance Management System Features Clipart PDF. This PPT design covers four stages, thus making it a great tool to use. It also caters to a variety of topics including Coaching Management, Feedback Management, Productivity Analytics. Download this PPT design now to present a convincing pitch that not only emphasizes the topic but also showcases your presentation skills.
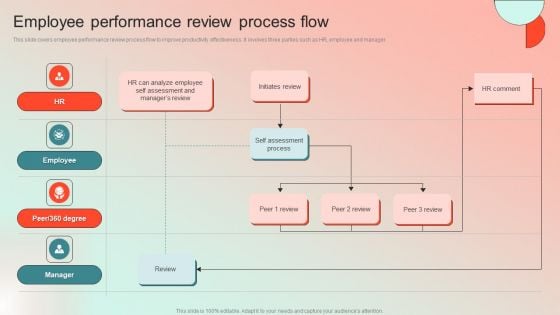
Employee Performance Review Process Flow Mockup PDF
This slide covers employee performance review process flow to improve productivity effectiveness. It involves three parties such as HR, employee and manager. Crafting an eye catching presentation has never been more straightforward. Let your presentation shine with this tasteful yet straightforward Employee Performance Review Process Flow Mockup PDF template. It offers a minimalistic and classy look that is great for making a statement. The colors have been employed intelligently to add a bit of playfulness while still remaining professional. Construct the ideal Employee Performance Review Process Flow Mockup PDF that effortlessly grabs the attention of your audience Begin now and be certain to wow your customers.
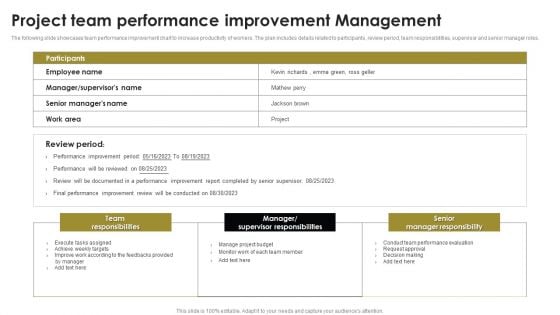
Project Team Performance Improvement Management Sample PDF
The following slide showcases team performance improvement chart to increase productivity of workers. The plan includes details related to participants, review period, team responsibilities, supervisor and senior manager roles. Pitch your topic with ease and precision using this Project Team Performance Improvement Management Sample PDF. This layout presents information on Team Responsibilities, Senior Manager Responsibility, Team Performance Evaluation. It is also available for immediate download and adjustment. So, changes can be made in the color, design, graphics or any other component to create a unique layout.
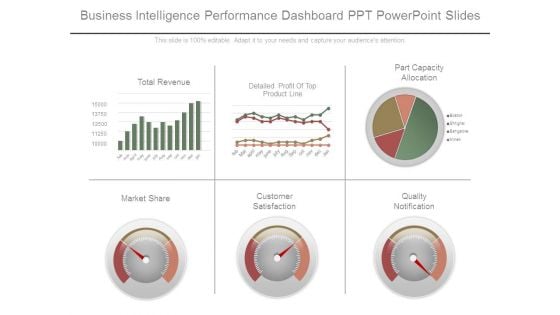
Business Intelligence Performance Dashboard Ppt Powerpoint Slides
This is a business intelligence performance dashboard ppt powerpoint slides. This is a six stage process. The stages in this process are total revenue, detailed profit of top product line, part capacity allocation, market share, customer satisfaction, quality notification.
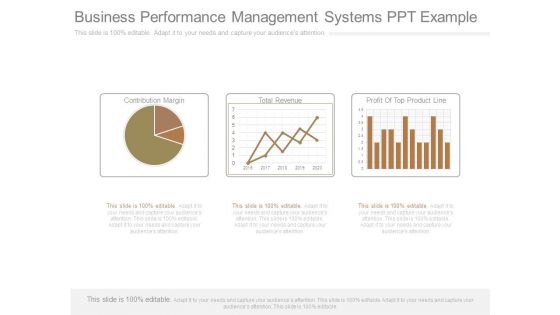
Business Performance Management Systems Ppt Example
This is a business performance management systems ppt example. This is a three stage process. The stages in this process are contribution margin, total revenue, profit of top product line.
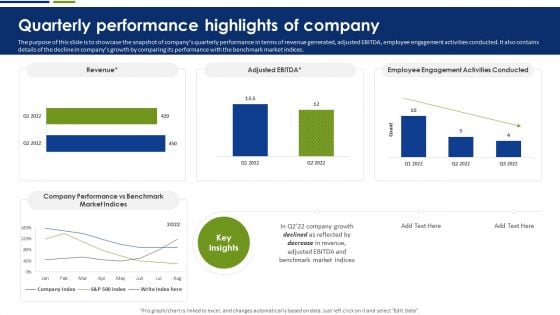
Quarterly Performance Highlights Of Company Brochure PDF
The purpose of this slide is to showcase the snapshot of companys quarterly performance in terms of revenue generated, adjusted EBITDA, employee engagement activities conducted. It also contains details of the decline in companys growth by comparing its performance with the benchmark market indices. This Quarterly Performance Highlights Of Company Brochure PDF is perfect for any presentation, be it in front of clients or colleagues. It is a versatile and stylish solution for organizing your meetings. The Quarterly Performance Highlights Of Company Brochure PDF features a modern design for your presentation meetings. The adjustable and customizable slides provide unlimited possibilities for acing up your presentation. Slidegeeks has done all the homework before launching the product for you. So, do not wait, grab the presentation templates today.
Dashboard For Tracking Website Performance Structure PDF
This slide covers the KPI dashboard for analyzing the company website. It includes metrics such as conversions, conversion rate, sessions, stickiness, bounce rate, engagement, etc. Deliver and pitch your topic in the best possible manner with this Dashboard For Tracking Website Performance Structure PDF. Use them to share invaluable insights on Bounce Rate, Location, Conversions Rate and impress your audience. This template can be altered and modified as per your expectations. So, grab it now.
Loyalty Program Performance Tracking Dashboard Background PDF
This slide covers the KPI dashboard for analyzing customer loyalty campaign results. It includes metrics such as revenue, liability, NQP accrued, transaction count, members, redemption ratio, etc. Deliver an awe inspiring pitch with this creative Loyalty Program Performance Tracking Dashboard Background PDF bundle. Topics like Liability, Revenue, Redemption Ratio can be discussed with this completely editable template. It is available for immediate download depending on the needs and requirements of the user.
Referral Program Performance Tracking Dashboard Elements PDF
This slide covers the KPI dashboard for analyzing referral campaign results. It includes metrics such as total revenue generated, monthly recurring revenue, new customers, clicks, cancelled customers, paying customers, etc. Deliver an awe inspiring pitch with this creative Referral Program Performance Tracking Dashboard Elements PDF bundle. Topics like Dashboard, Monthly Recurring Revenue, Paying Customers can be discussed with this completely editable template. It is available for immediate download depending on the needs and requirements of the user.
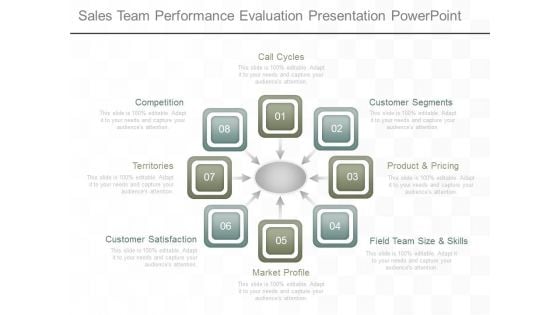
Sales Team Performance Evaluation Presentation Powerpoint
This is a sales team performance evaluation presentation powerpoint. This is a eight stage process. The stages in this process are competition, territories, customer satisfaction, market profile, field team size and skills, product and pricing, customer segments, call cycles.
Sales Performance Analysis Diagram Ppt Icon
This is a sales performance analysis diagram ppt icon. This is a eight stage process. The stages in this process are incentive packages, sales process, personnel factors, management support, competitor activities, price structure, marketing position, product and quality.


 Continue with Email

 Home
Home


