Phase Chart
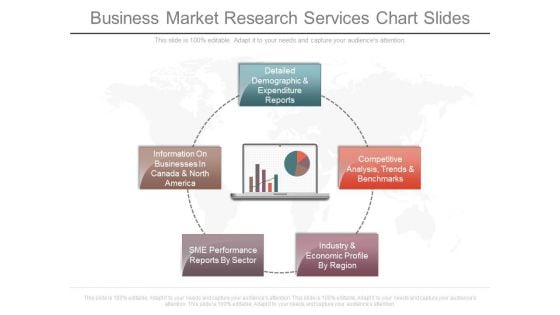
Business Market Research Services Chart Slides
This is a business market research services chart slides. This is a five stage process. The stages in this process are detailed demographic and expenditure reports, competitive analysis trends and benchmarks, industry and economic profile by region, sme performance reports by sector, information on businesses in canada and north america.
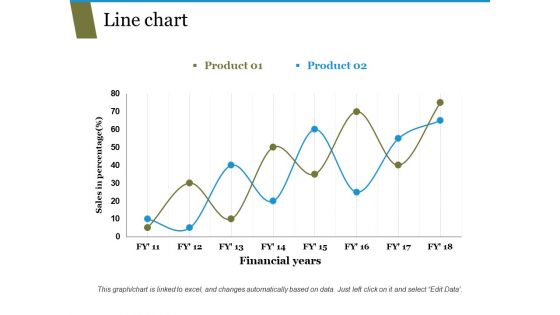
Line Chart Ppt PowerPoint Presentation Pictures Templates
This is a line chart ppt powerpoint presentation pictures templates. This is a two stage process. The stages in this process are sales in percentage, financial years, business, marketing, growth.
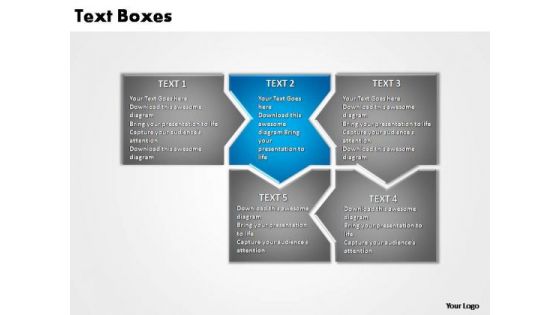
PowerPoint Slide Chart Consecutive Factors Ppt Theme
PowerPoint Slide Chart Consecutive Factors PPT Theme-PowerPoint Slide Graphic Uniform Business PPT Designs-These high quality powerpoint pre-designed slides and powerpoint templates have been carefully created by our professional team to help you impress your audience.-PowerPoint Slide Chart Consecutive Factors PPT Theme Put our PowerPoint Slide Chart Consecutive Factors Ppt Theme under examination. They will come out with flying colours.
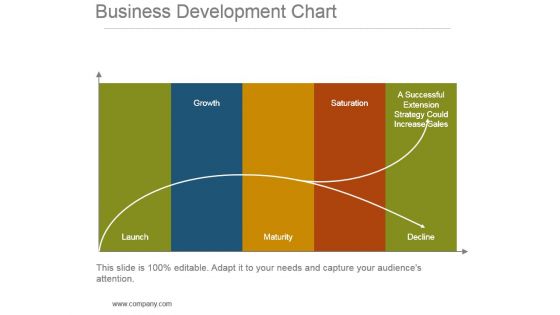
Business Development Chart Powerpoint Slide Ideas
This is a business development chart powerpoint slide ideas. This is a five stage process. The stages in this process are launch, growth, maturity, saturation, a successful extension strategy could increase sales, decline.
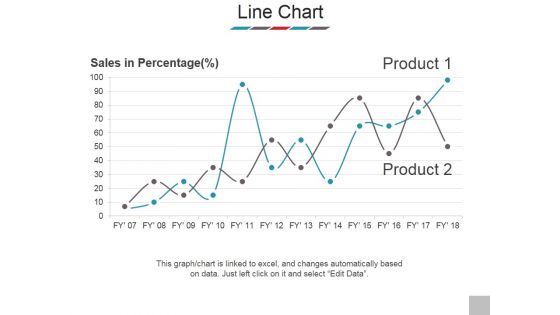
Line Chart Ppt PowerPoint Presentation Outline Samples
This is a line chart ppt powerpoint presentation outline samples. This is a two stage process. The stages in this process are sales in percentage, product, business, marketing, success.
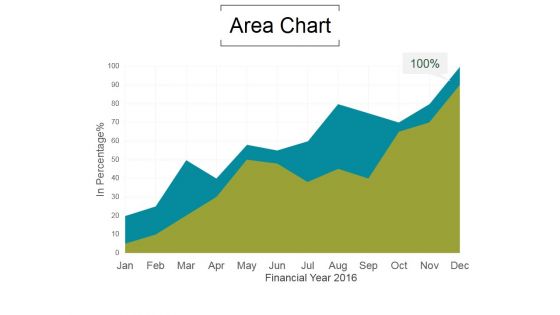
Area Chart Ppt PowerPoint Presentation Topics
This is a area chart ppt powerpoint presentation topics. This is a two stage process. The stages in this process are product, in percentage, jan, feb, mar, apr, may.
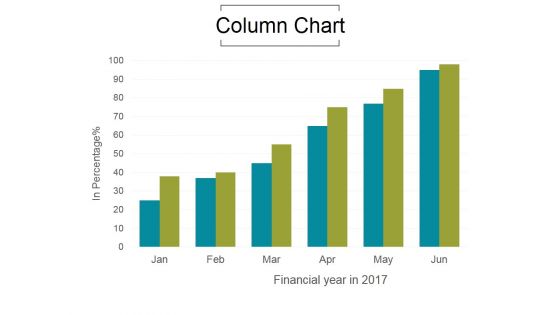
Column Chart Ppt PowerPoint Presentation Show
This is a column chart ppt powerpoint presentation show. This is a six stage process. The stages in this process are product, in percentage, jan, feb, mar, apr, may.
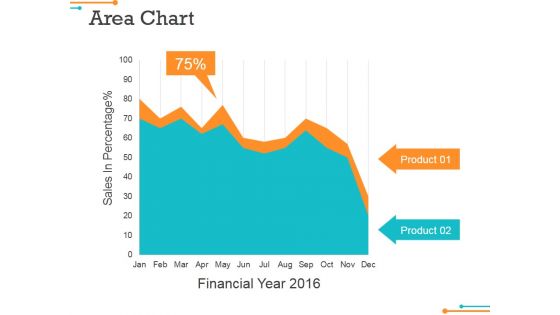
Area Chart Ppt Powerpoint Presentation File Show
This is a area chart ppt powerpoint presentation file show. This is a two stage process. The stages in this process are sales in percentage, financial year, product, financial, business.
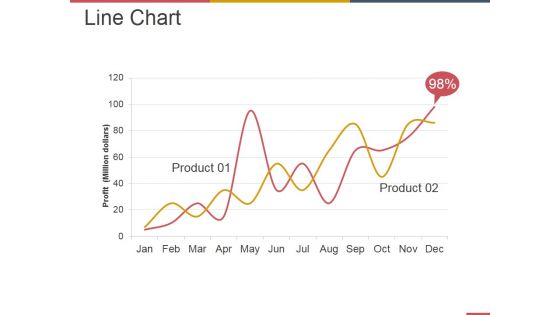
Line Chart Ppt PowerPoint Presentation Summary Information
This is a line chart ppt powerpoint presentation summary information. This is a two stage process. The stages in this process are business, strategy, marketing, analysis, profit million dollars.
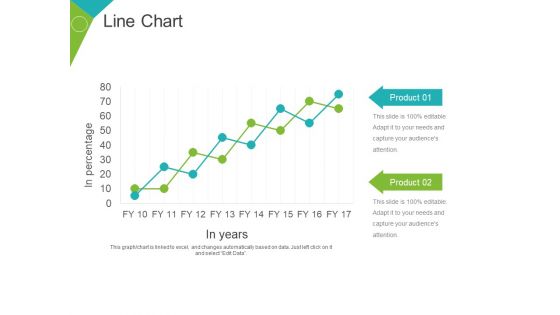
Line Chart Ppt PowerPoint Presentation Gallery Objects
This is a line chart ppt powerpoint presentation gallery objects. This is a two stage process. The stages in this process are product, business, marketing, growth, in years, in percentage.
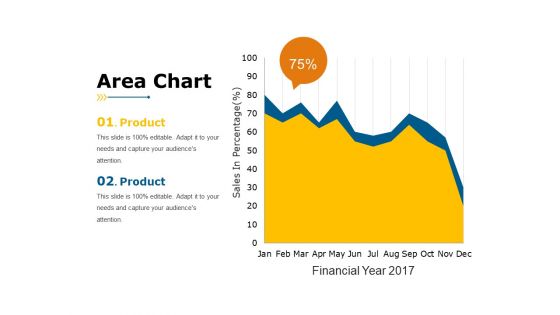
Area Chart Ppt PowerPoint Presentation Slides Rules
This is a area chart ppt powerpoint presentation slides rules. This is a two stage process. The stages in this process are sales in percentage, business, marketing, product, finance.
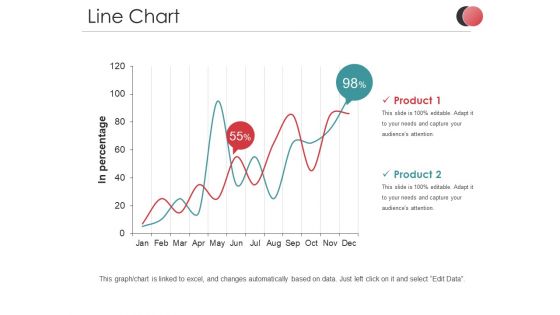
Line Chart Ppt PowerPoint Presentation Professional Ideas
This is a line chart ppt powerpoint presentation professional ideas. This is a two stage process. The stages in this process are in percentage, product, business, marketing, finance, percentage.
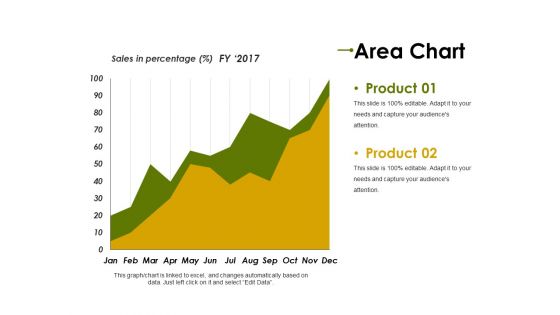
Area Chart Ppt PowerPoint Presentation Summary Objects
This is a area chart ppt powerpoint presentation summary objects. This is a two stage process. The stages in this process are product, sales in percentage, finance, business, marketing.

Column Chart Ppt PowerPoint Presentation Layouts Ideas
This is a column chart ppt powerpoint presentation layouts ideas. This is a two stage process. The stages in this process are dollars in thousands, strategy, business, graph, product.
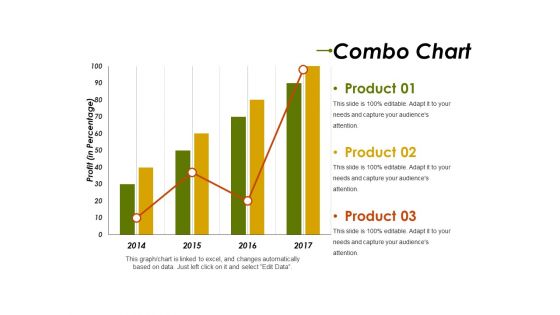
Combo Chart Ppt PowerPoint Presentation Infographics Introduction
This is a combo chart ppt powerpoint presentation infographics introduction. This is a three stage process. The stages in this process are profit in percentage, business, graph, strategy, product.
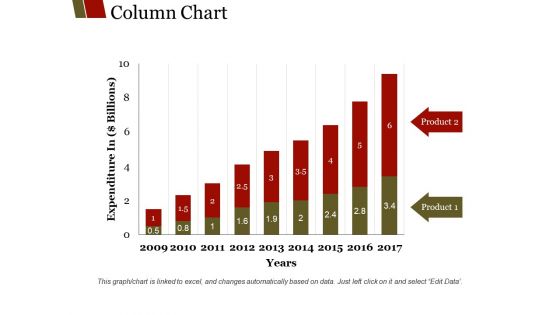
Column Chart Ppt PowerPoint Presentation Summary Graphics
This is a column chart ppt powerpoint presentation summary graphics. This is a nine stage process. The stages in this process are product, years, expenditure in billions, graph, business.
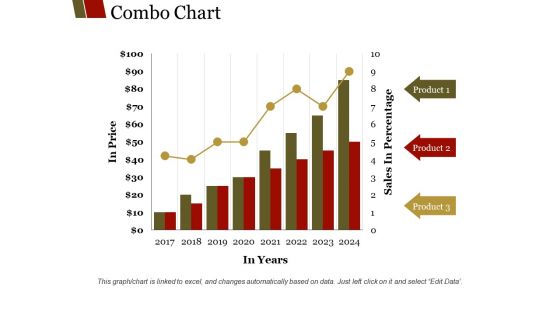
Combo Chart Ppt PowerPoint Presentation Summary Layouts
This is a combo chart ppt powerpoint presentation summary layouts. This is a eight stage process. The stages in this process are product, sales in percentage, in years, in price, graph.
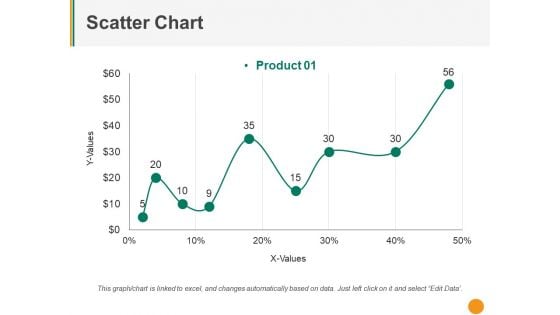
Scatter Chart Ppt PowerPoint Presentation Summary Smartart
This is a scatter chart ppt powerpoint presentation summary smartart. This is a nine stage process. The stages in this process are y values, x values, product, business, graph.
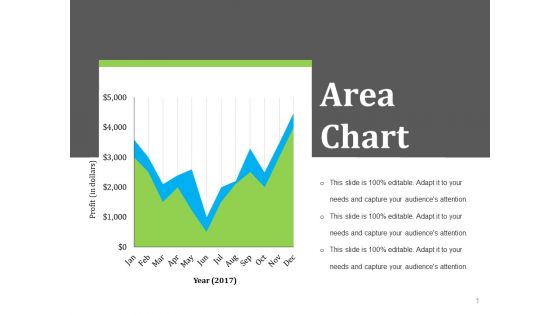
Area Chart Ppt PowerPoint Presentation Model Examples
This is a area chart ppt powerpoint presentation model examples. This is a two stage process. The stages in this process are year profit in dollars, business, strategy, growth.
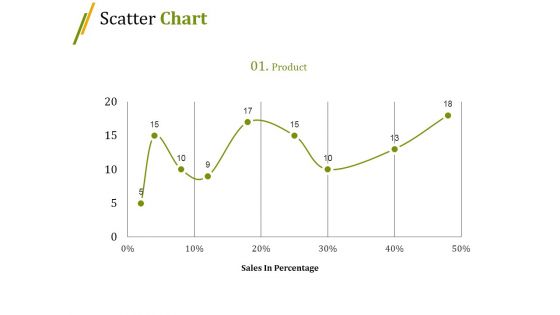
Scatter Chart Ppt PowerPoint Presentation Slides Summary
This is a scatter chart ppt powerpoint presentation slides summary. This is a nine stage process. The stages in this process are sales in percentage, growth, graph, business, marketing.
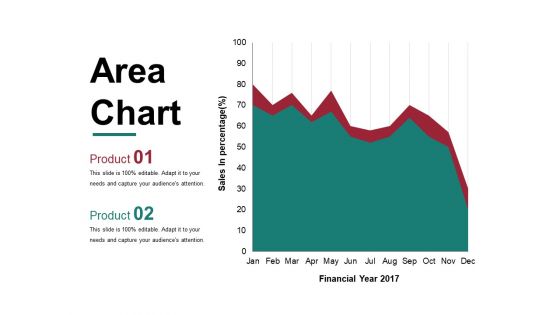
Area Chart Ppt PowerPoint Presentation Layouts Maker
This is a area chart ppt powerpoint presentation layouts maker. This is a two stage process. The stages in this process are financial year, sales in percentage, graph, business, marketing.
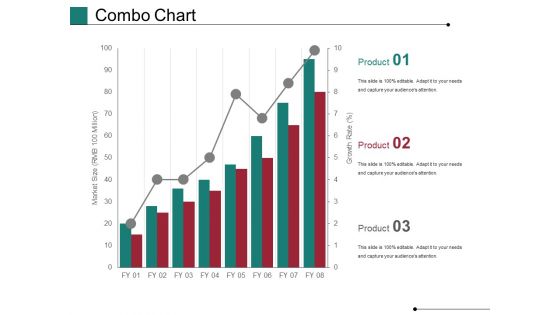
Combo Chart Ppt PowerPoint Presentation Styles Objects
This is a combo chart ppt powerpoint presentation styles objects. This is a three stage process. The stages in this process are market size growth rate, growth, business, marketing, graph.
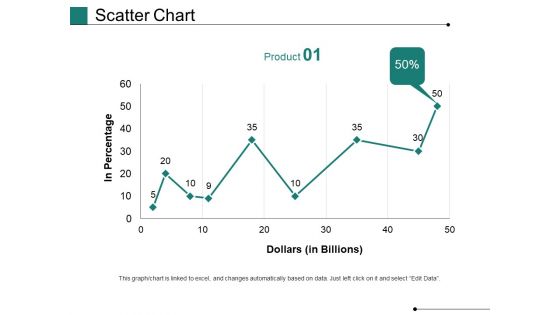
Scatter Chart Ppt PowerPoint Presentation Gallery Show
This is a scatter chart ppt powerpoint presentation gallery show. This is a one stage process. The stages in this process are in percentage, dollars, business, marketing, growth, graph.
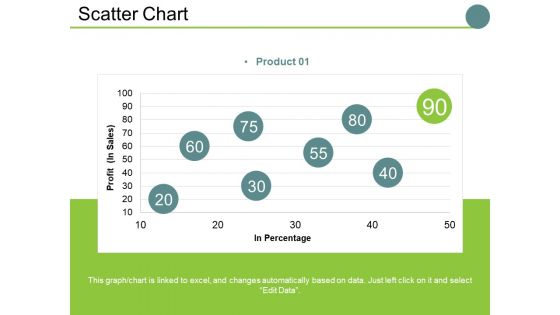
Scatter Chart Ppt PowerPoint Presentation Slides Examples
This is a scatter chart ppt powerpoint presentation slides examples. This is a one stage process. The stages in this process are profit , in percentage, business, marketing, finance, graph.
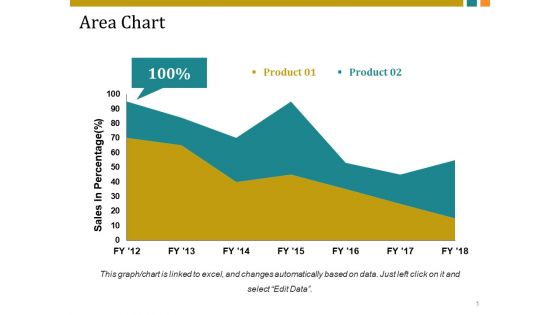
Area Chart Ppt PowerPoint Presentation Professional Brochure
This is a area chart ppt powerpoint presentation professional brochure. This is a two stage process. The stages in this process are sales in percentage, business, marketing, finance, graph.
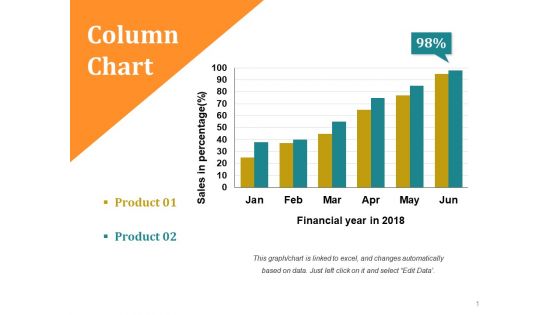
Column Chart Ppt PowerPoint Presentation Slides Smartart
This is a column chart ppt powerpoint presentation slides smartart. This is a two stage process. The stages in this process are sales in percentage, financial year in, business, growth, strategy.
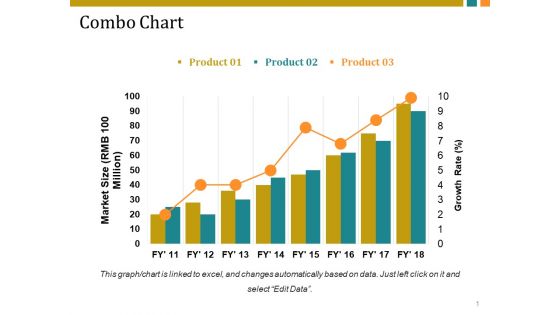
Combo Chart Ppt PowerPoint Presentation Guide
This is a combo chart ppt powerpoint presentation guide. This is a three stage process. The stages in this process are market size, growth rate, business, growth, graph, strategy.
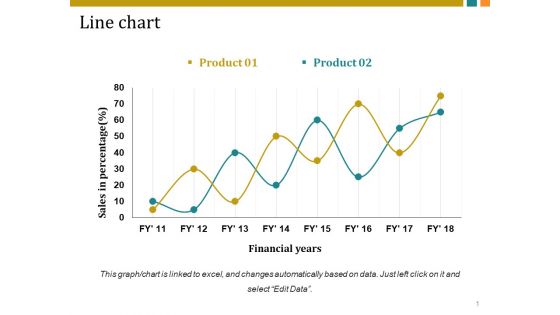
Line Chart Ppt PowerPoint Presentation Inspiration Vector
This is a line chart ppt powerpoint presentation inspiration vector. This is a two stage process. The stages in this process are sales in percentage, financial years, business, marketing, growth.
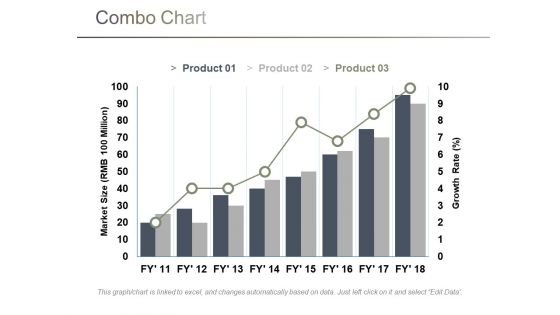
Combo Chart Ppt PowerPoint Presentation Pictures Shapes
This is a combo chart ppt powerpoint presentation pictures shapes. This is a three stage process. The stages in this process are market size, growth rate, business, marketing, graph.
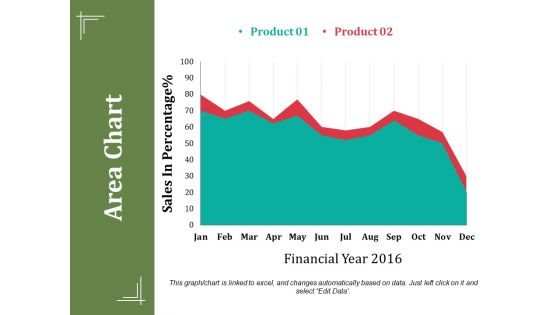
Area Chart Ppt PowerPoint Presentation Summary Show
This is a area chart ppt powerpoint presentation summary show. This is a two stage process. The stages in this process are sales in percentage, financial year, business, marketing, finance.
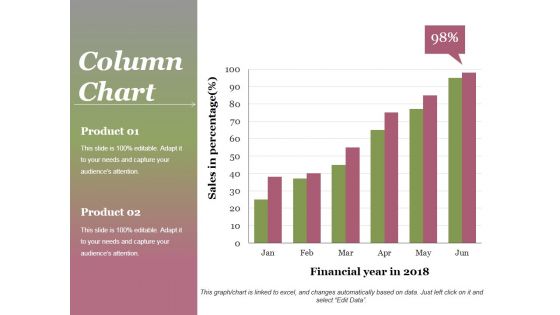
Column Chart Ppt PowerPoint Presentation Gallery Background
This is a column chart ppt powerpoint presentation gallery background. This is a two stage process. The stages in this process are product, sales in percentage, financial year, graph, success.
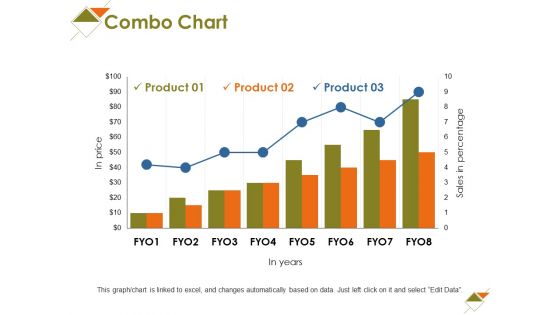
Combo Chart Ppt PowerPoint Presentation Show Elements
This is a combo chart ppt powerpoint presentation show elements. This is a three stage process. The stages in this process are in price, in years, business, marketing, growth.
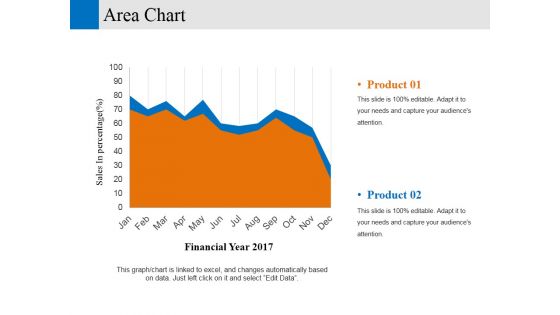
area chart ppt powerpoint presentation professional elements
This is a area chart ppt powerpoint presentation professional elements. This is a two stage process. The stages in this process are financial year sales in percentage, business, marketing, graph.
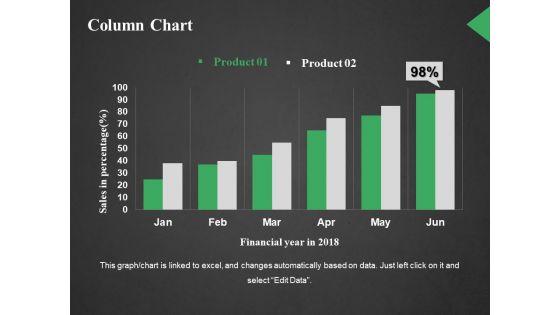
Column Chart Ppt PowerPoint Presentation Outline Styles
This is a column chart ppt powerpoint presentation outline styles. This is a two stage process. The stages in this process are sales in percentage, financial year in, business, marketing, graph.
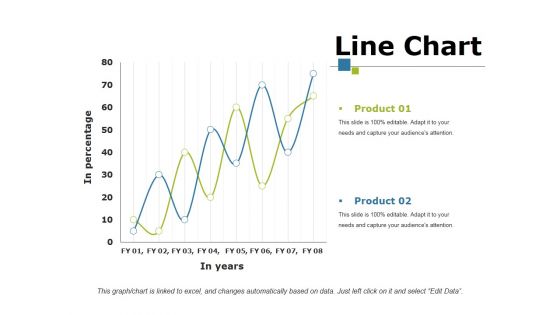
Line Chart Ppt PowerPoint Presentation Portfolio Mockup
This is a line chart ppt powerpoint presentation portfolio mockup. This is a two stage process. The stages in this process are product, in percentage, in year, growth, success.
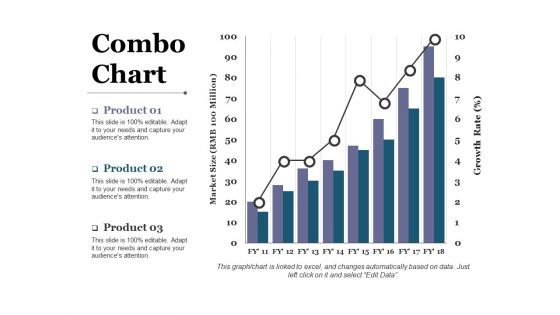
Combo Chart Ppt PowerPoint Presentation Gallery Layout
This is a combo chart ppt powerpoint presentation gallery layout. This is a three stage process. The stages in this process are business, marketing, graph, market size, growth rate.
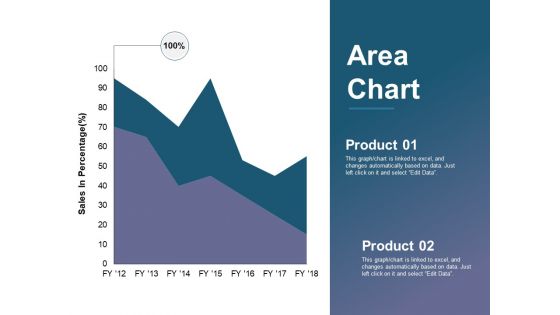
Area Chart Ppt PowerPoint Presentation Summary Information
This is a area chart ppt powerpoint presentation summary information. This is a two stage process. The stages in this process are business, sales in percentage, percentage, marketing, graph.
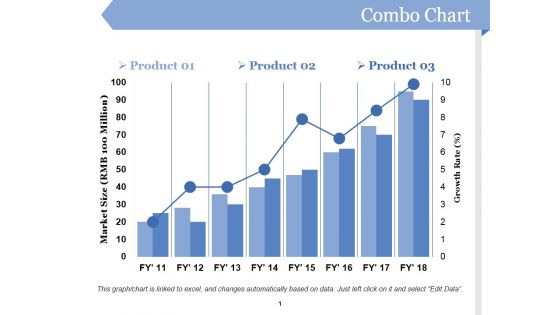
Combo Chart Ppt PowerPoint Presentation Ideas Professional
This is a combo chart ppt powerpoint presentation ideas professional. This is a three stage process. The stages in this process are business, marketing, market size, growth rate, graph.
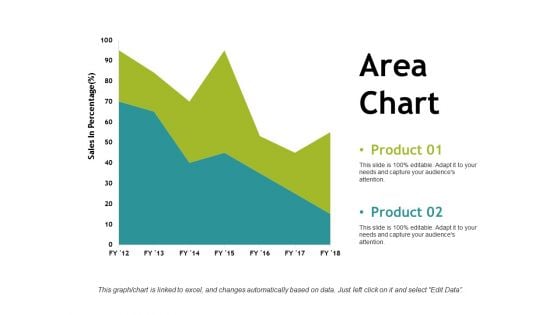
Area Chart Ppt PowerPoint Presentation File Visuals
This is a area chart ppt powerpoint presentation file visuals. This is a two stage process. The stages in this process are business, sales in percentage, marketing, graph, strategy, finance.
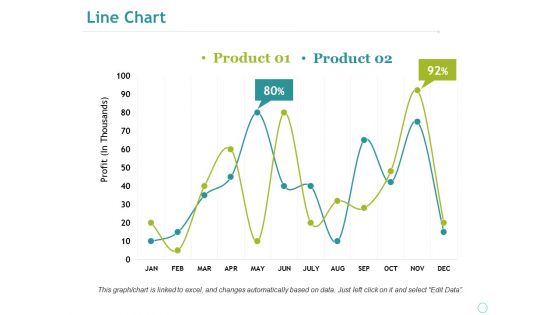
Line Chart Ppt PowerPoint Presentation Professional Portfolio
This is a line chart ppt powerpoint presentation professional portfolio. This is a two stage process. The stages in this process are business, marketing, profit, percentage, graph, strategy, finance.
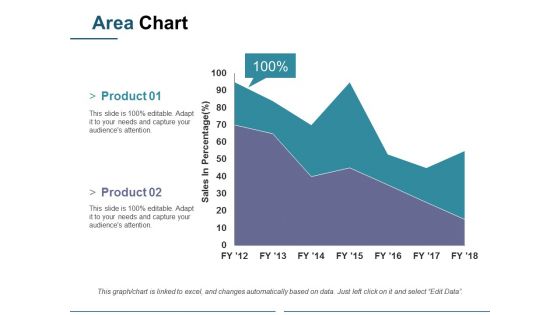
Area Chart Ppt PowerPoint Presentation Pictures Vector
This is a area chart ppt powerpoint presentation pictures vector. This is a two stage process. The stages in this process are sales in percentage, business, marketing, graph, percentage.
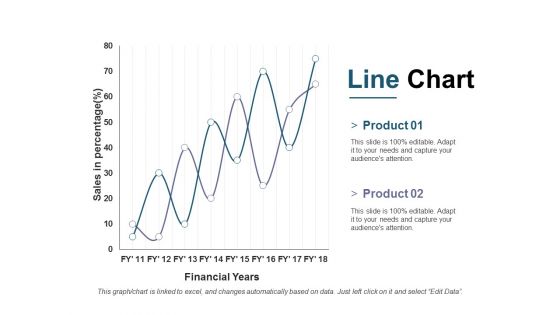
Line Chart Ppt PowerPoint Presentation Outline Ideas
This is a line chart ppt powerpoint presentation outline ideas. This is a two stage process. The stages in this process are business, marketing, financial years, sales in percentage, strategy.
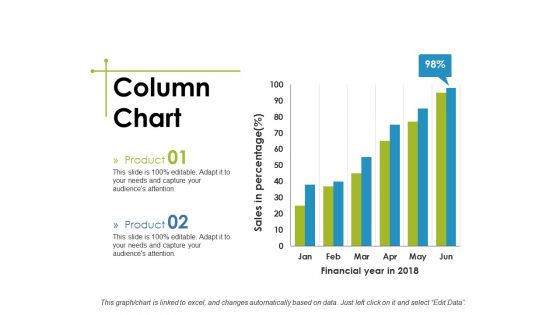
Column Chart Ppt PowerPoint Presentation Show Structure
This is a column chart ppt powerpoint presentation show structure. This is a two stage process. The stages in this process are business, financial year in, sales in percentage, marketing, graph.
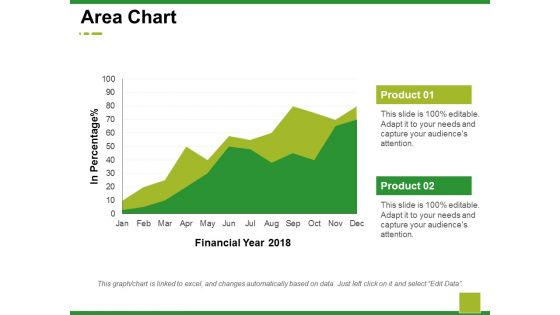
Area Chart Ppt PowerPoint Presentation Model Demonstration
This is a area chart ppt powerpoint presentation model demonstration. This is a two stage process. The stages in this process are business, marketing, financial year, in percentage, graph.
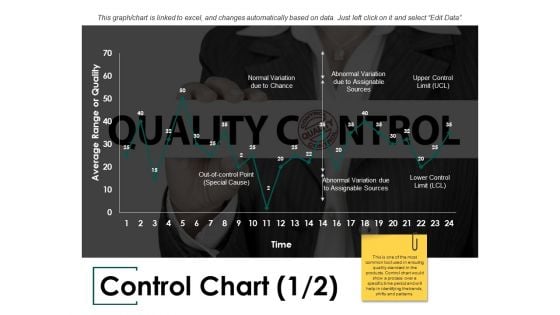
Control Chart Ppt PowerPoint Presentation Infographics Slide
This is a control chart ppt powerpoint presentation infographics slide. This is a two stage process. The stages in this process are normal variation due to chance, abnormal variation due to assignable sources, average range or quality.
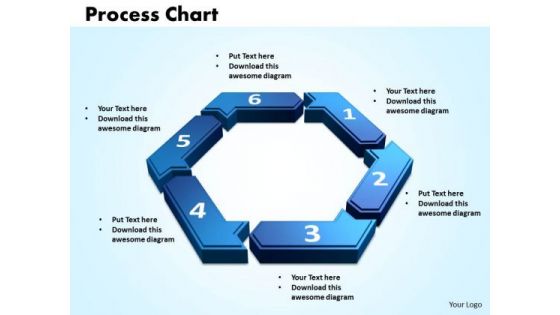
PowerPoint Designs Process Chart Strategy Ppt Slide
PowerPoint Designs process Chart Strategy PPT Slide-This Process Chart can be used as data flow diagram to show the flow of the data as it moves from beginning process to end result.-3d, arrow, art, business, chart, circle, concept, connection, cycle, development, diagram, direction, element, environment, finance, financial, flow, graphic, group, investment, isolated, market,, movement, organization, passive income, perspective, presentation, process chart, recycle, report, sign, step, success, symbol, teamwork-PowerPoint Designs process Chart Strategy PPT Slide Our PowerPoint Designs Process Chart Strategy Ppt Slide have a glossy look. Your thoughts will also acquire a sheen.
Column Chart Ppt PowerPoint Presentation Icon Show
This is a column chart ppt powerpoint presentation icon show. This is a two stage process. The stages in this process are column chart, product, years, bar graph, growth.
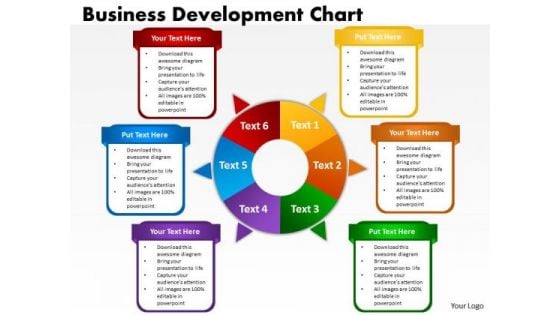
Consulting Diagram Business Development Chart Strategic Management
Document Your Views On Our Consulting Diagram Business Development Chart Strategic Management Powerpoint Templates. They Will Create A Strong Impression.
Bar Arrow Chart PowerPoint Icon C
business bar chart with arrows isolated on a white background. Erase all ambiguity with our Bar Arrow Chart PowerPoint Icon C. They will put your point across in a decisive way.
Marketing Process Chart PowerPoint Icon Cc
Microsoft PowerPoint Template and Background with An image of a marketing business chart. Do the right thing with our Marketing Process Chart PowerPoint Icon Cc. They promote an ethical approach.
Marketing Process Chart PowerPoint Icon F
Microsoft PowerPoint Template and Background with An image of a marketing business chart. Our Marketing Process Chart PowerPoint Icon F are very falcon like. They keep a sharp eye on the target.
Marketing Process Chart PowerPoint Icon R
Microsoft PowerPoint Template and Background with An image of a marketing business chart. Jump over obstacles with our Marketing Process Chart PowerPoint Icon R. Make sure your presentation gets the attention it deserves.
Marketing Process Chart PowerPoint Icon C
Microsoft PowerPoint Template and Background with An image of a marketing business chart. Boil down the argument with our Marketing Process Chart PowerPoint Icon C. Analyse complexities to their barest detail.
Marketing Process Chart PowerPoint Icon S
Microsoft PowerPoint Template and Background with An image of a marketing business chart. Your ideas deserve the best accessories. Our Marketing Process Chart PowerPoint Icon S are a shining example.
Bubble Chart Ppt PowerPoint Presentation Icon Slides
This is a bubble chart ppt powerpoint presentation icon slides. This is a three stage process. The stages in this process are product, finance, business, marketing, bubble chart .
Area Chart Ppt PowerPoint Presentation Icon Show
This is a area chart ppt powerpoint presentation icon show. This is a two stage process. The stages in this process are product, financial year, in percentage, area chart.
Combo Chart Ppt PowerPoint Presentation Icon Introduction
This is a combo chart ppt powerpoint presentation icon introduction. This is a three stage process. The stages in this process are combo chart, product, growth rate, market size, growth.
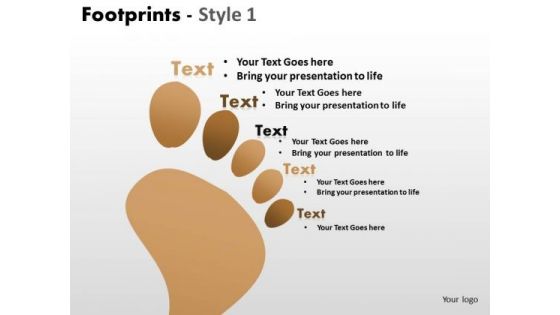
PowerPoint Backgrounds Chart Footprints Ppt Presentation
PowerPoint Backgrounds Chart Footprints PPT Presentation -These high quality powerpoint pre-designed slides and powerpoint templates have been carefully created by our professional team to help you impress your audience. All slides have been created and are 100% editable in powerpoint. Each and every property of any graphic - color, size, orientation, shading, outline etc. can be modified to help you build an effective powerpoint presentation. Any text can be entered at any point in the powerpoint template or slide. Simply DOWNLOAD, TYPE and PRESENT! Do not doubt the effect of your plans. Positive outcomes are a fait accompli with our PowerPoint Backgrounds Chart Footprints Ppt Presentation.
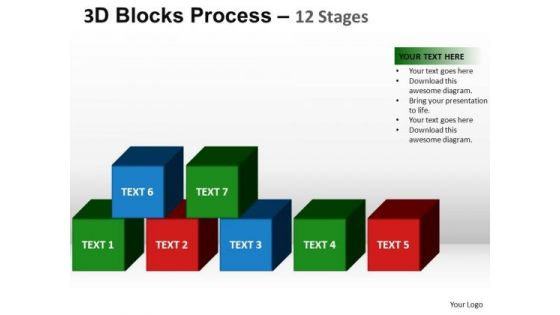
PowerPoint Design Chart Blocks Process Ppt Slides
PowerPoint Design Chart blocks process PPT Slides-These amazing PowerPoint pre-designed slides and PowerPoint templates have been carefully created by our team of experts to help you impress your audience. Our stunning collection of Powerpoint slides are 100% editable and can easily fit in any PowerPoint presentations. By using these animations and graphics in PowerPoint and you can easily make professional presentations. Any text can be entered at any point in the PowerPoint template or slide. Just DOWNLOAD our awesome PowerPoint templates and you are ready to go. Be a master with our PowerPoint Design Chart Blocks Process Ppt Slides. You will come out on top.
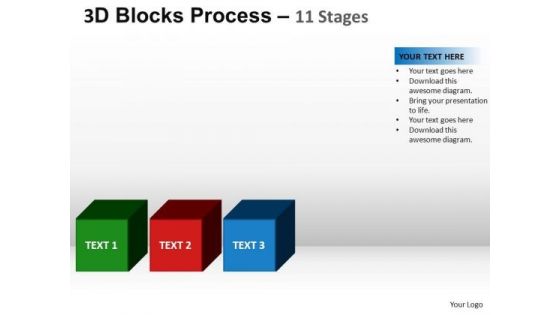
PowerPoint Design Chart Blocks Process Ppt Template
PowerPoint Design Chart blocks process PPT Template-These amazing PowerPoint pre-designed slides and PowerPoint templates have been carefully created by our team of experts to help you impress your audience. Our stunning collection of Powerpoint slides are 100% editable and can easily fit in any PowerPoint presentations. By using these animations and graphics in PowerPoint and you can easily make professional presentations. Any text can be entered at any point in the PowerPoint template or slide. Just DOWNLOAD our awesome PowerPoint templates and you are ready to go. Your ideas will never go out of fashion. Our PowerPoint Design Chart Blocks Process Ppt Template will keep them contemporary.


 Continue with Email

 Home
Home


