Phase Chart
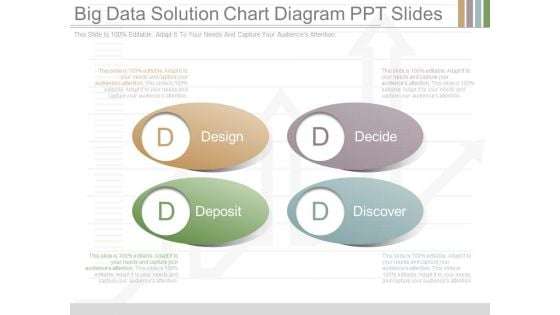
Big Data Solution Chart Diagram Ppt Slides
This is a big data solution chart diagram ppt slides. This is a four stage process. The stages in this process are design, decide, deposit, discover.
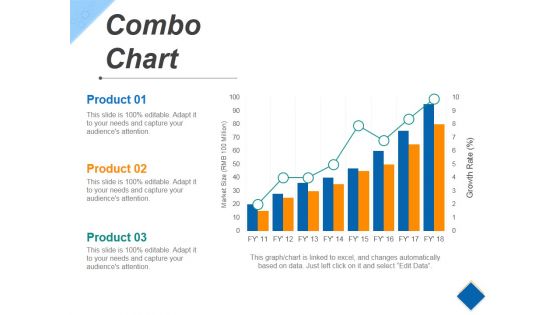
Combo Chart Ppt PowerPoint Presentation Diagram Images
This is a combo chart ppt powerpoint presentation diagram images. This is a eight stage process. The stages in this process are growth, success, business, marketing, product.
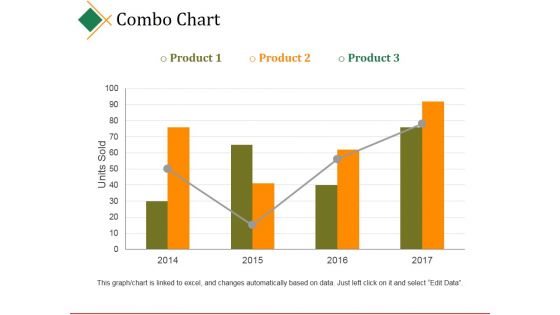
Combo Chart Ppt PowerPoint Presentation Slides Diagrams
This is a combo chart ppt powerpoint presentation slides diagrams. This is a four stage process. The stages in this process are units sold, business, product, marketing, graph.
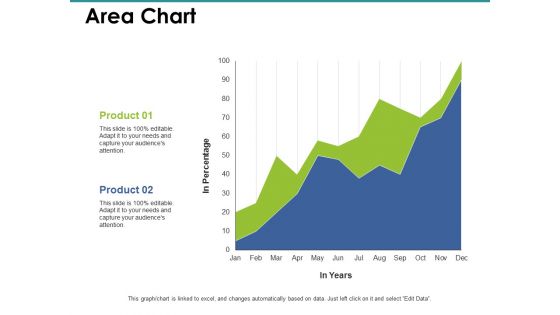
Area Chart Ppt PowerPoint Presentation Gallery Diagrams
This is a area chart ppt powerpoint presentation gallery diagrams. This is a two stage process. The stages in this process are finance, marketing, management, investment, analysis.
Pie Chart Ppt PowerPoint Presentation Professional Icons
This is a pie chart ppt powerpoint presentation professional icons. This is a five stage process. The stages in this process are process, percentage, product, business, marketing.
Radar Chart Ppt PowerPoint Presentation Icon Guide
This is a radar chart ppt powerpoint presentation icon guide. This is a three stage process. The stages in this process are business, finance, management, strategy, planning.
Area Chart Ppt PowerPoint Presentation Icon Good
This is a area chart ppt powerpoint presentation icon good. This is a two stage process. The stages in this process are business, marketing, growth, planning, strategy.
Puzzle Chart Wheel PowerPoint Icon C
Microsoft PowerPoint Template and Background with Jigsaw puzzle pieces over white Your effort has brought you along. Go further with our Puzzle Chart Wheel PowerPoint Icon C.
Puzzle Chart Wheel PowerPoint Icon S
Microsoft PowerPoint Template and Background with Jigsaw puzzle pieces over white Be a self-starter with our Puzzle Chart Wheel PowerPoint Icon S. They will make you look good.
Operating Expenses Analysis Pie Chart Ppt Icon
This is a operating expenses analysis pie chart ppt icon. This is a seven stage process. The stages in this process are finance, success, business, marketing, percentage.
Combo Chart Ppt PowerPoint Presentation Icon
This is a combo chart ppt powerpoint presentation icon. This is a three stage process. The stages in this process are business, strategy, marketing, analysis, growth.
Scatter Chart Ppt PowerPoint Presentation Icon
This is a scatter chart ppt powerpoint presentation icon. This is a two stage process. The stages in this process are product, growth, business, marketing.
Hierarchy Chart Ppt PowerPoint Presentation Icon Skills
This is a hierarchy chart ppt powerpoint presentation icon skills. This is a four stage process. The stages in this process are director, manager, accountant, producer, supervisor.
Line Chart Ppt PowerPoint Presentation Icon Deck
This is a line chart ppt powerpoint presentation icon deck. This is a two stage process. The stages in this process are business, management, growth, product, finance.
Donut Chart Ppt Powerpoint Presentation Layouts Icons
This is a donut chart ppt powerpoint presentation layouts icons. This is a six stage process. The stages in this process are finance, marketing, management, donut circle.
Scatter Chart Ppt PowerPoint Presentation Icon Visuals
This is a scatter chart ppt powerpoint presentation icon visuals. This is a nine stage process. The stages in this process are business, growth, finance, success, marketing.
Area Chart Ppt PowerPoint Presentation Icon Brochure
This is a area chart ppt powerpoint presentation icon brochure. This is a two stage process. The stages in this process are product, sales in percentage, growth, success.
Stock Chart Ppt PowerPoint Presentation Icon Microsoft
This is a stock chart ppt powerpoint presentation icon microsoft. This is a five stage process. The stages in this process are product, high, volume, low.
Combo Chart Ppt PowerPoint Presentation Icon Rules
This is a combo chart ppt powerpoint presentation icon rules. This is a ten stage process. The stages in this process are cumulative, value, sales, graph, business.
Line Chart Ppt PowerPoint Presentation Styles Icons
This is a line chart ppt powerpoint presentation styles icons. This is a three stage process. The stages in this process are profit, dollar, product, business, marketing.
Pie Chart Ppt PowerPoint Presentation Layouts Icons
This is a pie chart ppt powerpoint presentation layouts icons. This is a three stage process. The stages in this process are business, finance, analysis, marketing, strategy.
Scatter Chart Ppt PowerPoint Presentation Icon Mockup
This is a scatter chart ppt powerpoint presentation icon mockup. This is a nine stage process. The stages in this process are product, in percentage, dollars, percentage, finance.
Stock Chart Ppt PowerPoint Presentation Inspiration Icon
This is a stock chart ppt powerpoint presentation inspiration icon. This is a two stage process. The stages in this process are high, volume, low, product, close.
Stock Chart Ppt PowerPoint Presentation Icon Format
This is a stock chart ppt powerpoint presentation icon format. This is a two stage process. The stages in this process are product, close, high, volume, low.
Area Chart Ppt PowerPoint Presentation Summary Icon
This is a area chart ppt powerpoint presentation summary icon. This is a two stage process. The stages in this process are finance, marketing, management, investment, analysis.
PowerPoint Slides Chart Pedestal Shinning Ppt Theme
PowerPoint Slides Chart pedestal shinning PPT Theme-These high quality powerpoint pre-designed slides and powerpoint templates have been carefully created by our professional team to help you impress your audience. All slides have been created and are 100% editable in powerpoint. Each and every property of any graphic - color, size, orientation, shading, outline etc. can be modified to help you build an effective powerpoint presentation. Any text can be entered at any point in the powerpoint template or slide. Simply DOWNLOAD, TYPE and PRESENT! Put your customer in the spotlight with your thoughts. Centre it on him with our PowerPoint Slides Chart Pedestal Shinning Ppt Theme.
Project Requirements Triangle Chart Ppt Examples Slides
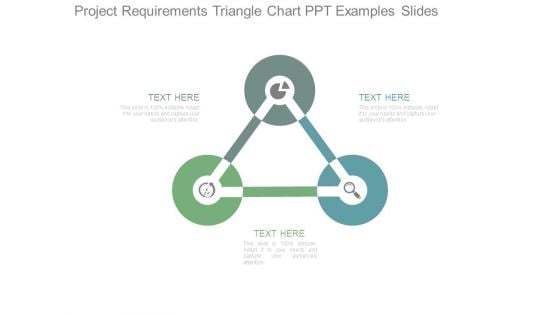
This is a project requirements triangle chart ppt examples slides. This is a three stage process. The stages in this process are triangle, business, marketing, management, icons, diagram.
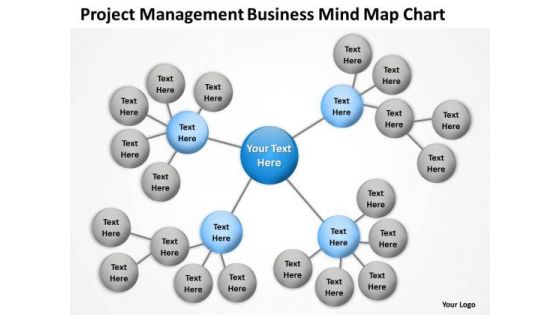
Timeline Project Management Business Mind Map Chart
You have all the ingredients to create the taste of sucess. Garnish your recipe with our Timeline Project Management Business Mind Map Chart and enhance its flavour. Our Timeline Project Management Business Mind Map Chart are created by innovative young minds. Gauranteed to fit presentations of all kinds.
Infographic Chart For Statistical Analysis Powerpoint Template
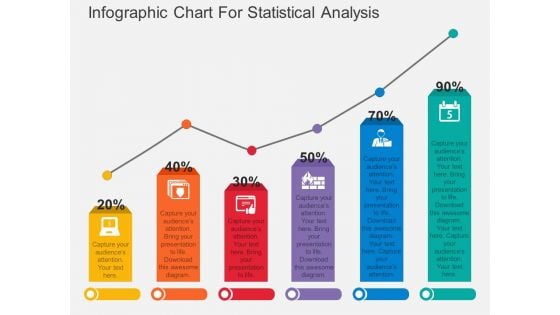
Download this exclusive business diagram to display statistical analysis. This PowerPoint template contains bar chart with percentage values. This diagram is useful for business presentations.
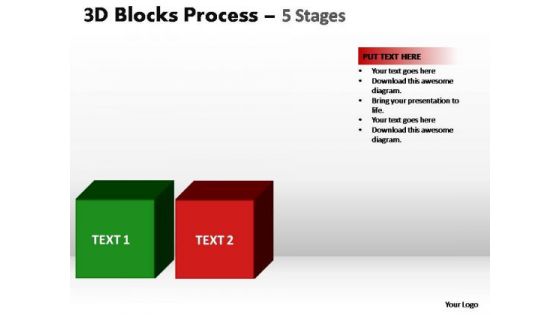
PowerPoint Slidelayout Chart Blocks Process Ppt Theme
PowerPoint Slidelayout Chart blocks process PPT Theme-These Fabulous PowerPoint slides and PowerPoint templates have been delicately designed by our professional team to leave long-lasting impressions on your audiences Audience comprehension is highly desirable. Our PowerPoint Slidelayout Chart Blocks Process Ppt Theme make it feasible.
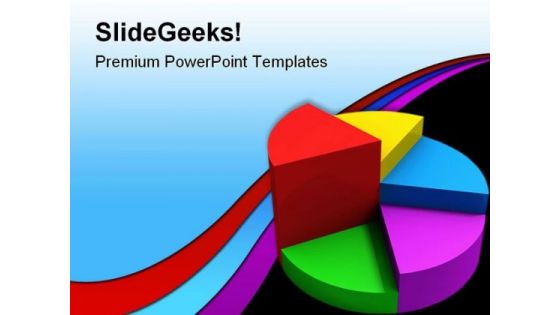
Pie Chart Business PowerPoint Template 0910
color pie diagram 3D graphic shape up improvement marketing steps Crunch the data with our Pie Chart Business PowerPoint Template 0910. Derive accurate conclusions with your ideas.
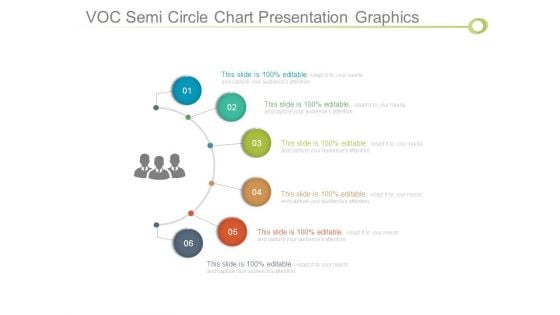
Voc Semi Circle Chart Presentation Graphics
This is a voc semi circle chart presentation graphics. This is a six stage process. The stages in this process are business, marketing, management, success, diagram.
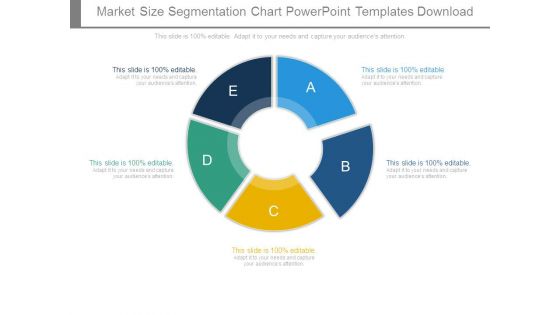
Market Size Segmentation Chart Powerpoint Templates Download
This is a market size segmentation chart powerpoint templates download. This is a five stage process. The stages in this process are business, marketing, process, management, diagram.
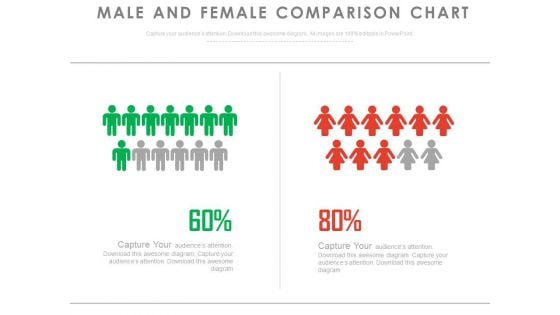
Male Female Ratio Compare Chart Powerpoint Slides
This PPT slide displays compare chart of male and female population ratio. This PowerPoint template can be customized as per requirements of business education or any other theme.
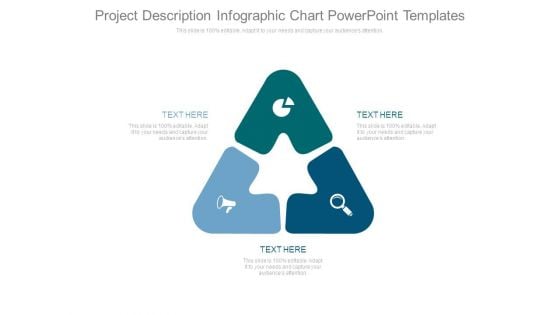
Project Description Infographic Chart Powerpoint Templates
This is a project description infographic chart powerpoint templates. This is a three stage process. The stages in this process are icons, strategy, business, marketing, triangle.
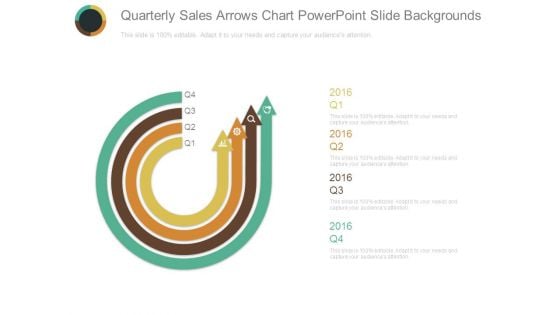
Quarterly Sales Arrows Chart Powerpoint Slide Backgrounds
This is a quarterly sales arrows chart powerpoint slide backgrounds. This is a four stage process. The stages in this process are arrows, business, management, marketing, icons.
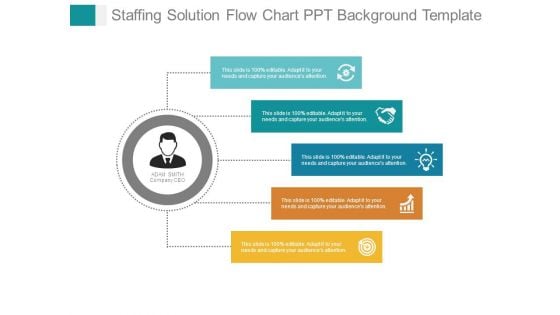
Staffing Solution Flow Chart Ppt Background Template
This is a staffing solution flow chart ppt background template. This is a five stage process. The stages in this process are business, success, strategy, management, icons.
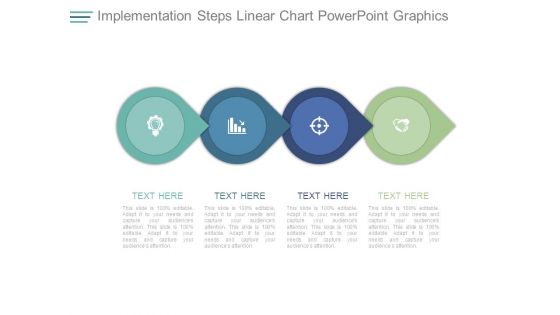
Implementation Steps Linear Chart Powerpoint Graphics
This is a implementation steps linear chart powerpoint graphics. This is a four stage process. The stages in this process are business, marketing, icons, strategy, management.
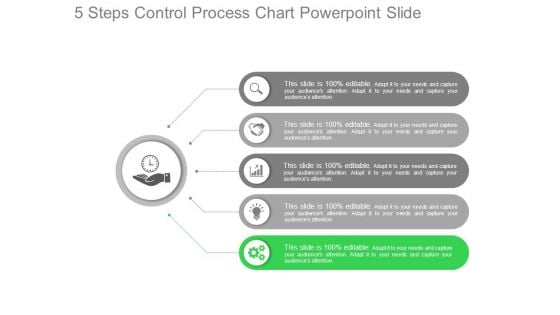
5 Steps Control Process Chart Powerpoint Slide
This is a 5 steps control process chart powerpoint slide. This is a five stage process. The stages in this process are business, marketing, icons, strategy.
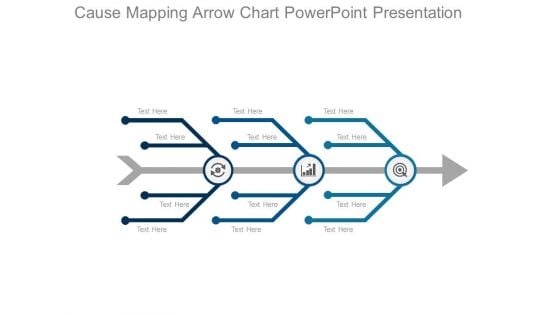
Cause Mapping Arrow Chart Powerpoint Presentation
This is a cause mapping arrow chart powerpoint presentation. This is a three stage process. The stages in this process are arrows, icons, business, marketing, management.
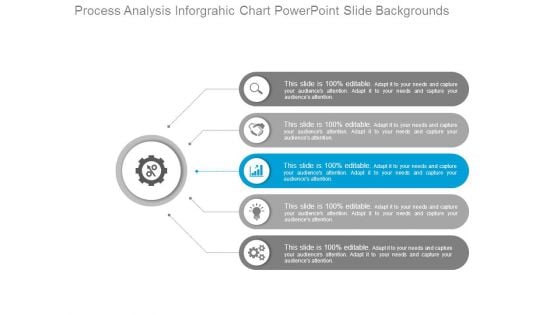
Process Analysis Inforgrahic Chart Powerpoint Slide Backgrounds
This is a process analysis inforgrahic chart powerpoint slide backgrounds. This is a five stage process. The stages in this process are customer business, marketing, icons, strategy.
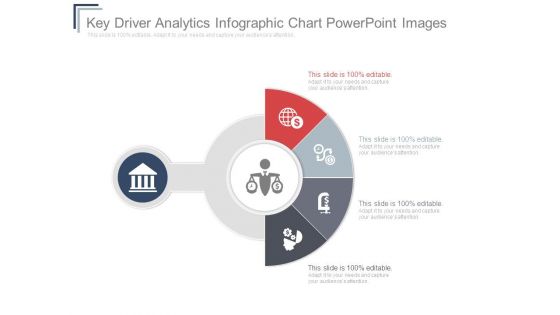
Key Driver Analytics Infographic Chart Powerpoint Images
This is a key driver analytics infographic chart powerpoint images. This is a five stage process. The stages in this process are business, marketing, semicircle, icons, strategy.
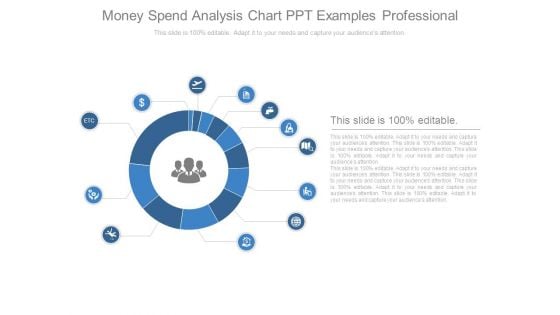
Money Spend Analysis Chart Ppt Examples Professional
This is a money spend analysis chart ppt examples professional. This is a twelve stage process. The stages in this process are marketing, business, icon, process, management.
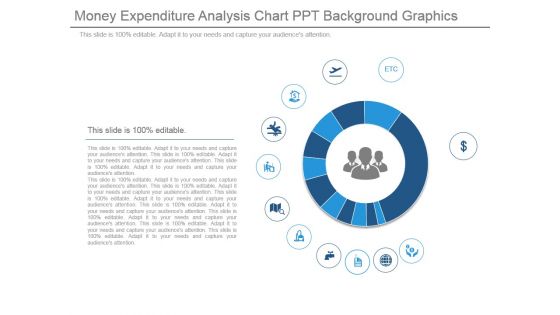
Money Expenditure Analysis Chart Ppt Background Graphics
This is a money expenditure analysis chart ppt background graphics. This is a twelve stage process. The stages in this process are icons, strategy, business, marketing, presentation.
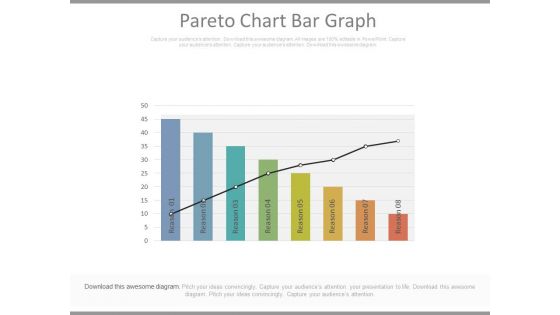
Pareto Chart Bar Graph Ppt Slides
This is a pareto chart bar graph ppt slides. This is a eight stage process. The stages in this process are business, marketing, success.\n
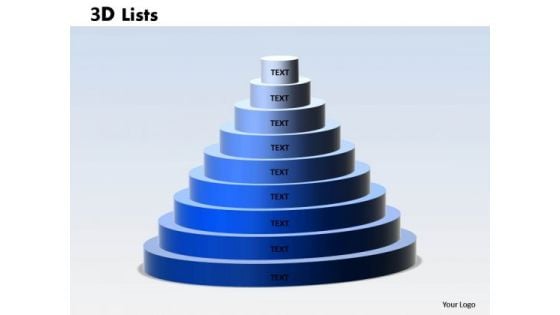
PowerPoint Designs List Chart Ppt Template
PowerPoint Designs List Chart PPT Template-Use to awesome List and text boxes powerpoint templates to create awesome marketing and sales priority lists or any other types of lists.-PowerPoint Designs List Chart PPT Template-3d, Adhesive, Appliance, Background, Big, Blank, Blue, Chrome, Classic, Clean, Closed, Cold, Cool, Cooler, Copyspace, Design, Domestic, Door, Equipment, Freezer, Fridge, Handle, Household, Illustration, Kitchen, Large, List, Memo, Message, Metal, Nobody, Note, Object Exhibit your talent with our PowerPoint Designs List Chart Ppt Template. Let the audience see your dexterity.

Comparison Chart For Performance Analysis Ppt Design
This is a comparison chart for performance analysis ppt design. This is a two stage process. The stages in this process are compare, scale, measurement, business, marketing.
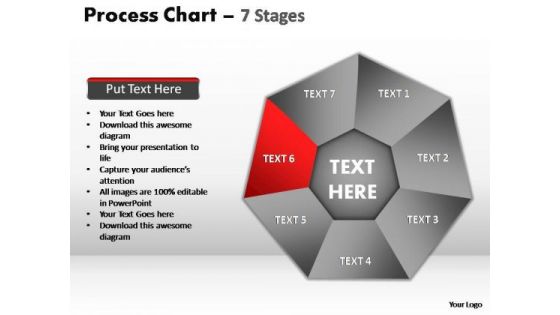
PowerPoint Slidelayout Diagram Process Chart Ppt Template
PowerPoint Slidelayout Diagram process chart PPT Template-These Fabulous PowerPoint slides and PowerPoint templates have been delicately designed by our professional team to leave long-lasting impressions on your audiences Convincing others can be an exacting business. Address their doubts with our PowerPoint Slidelayout Diagram Process Chart Ppt Template.
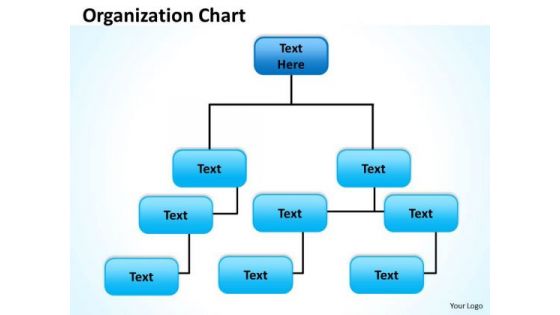
Sales Diagram Origanization Chart Business Framework Model
Discover Decisive Moments With Our sales diagram Origanization Chart Business Framework Model Powerpoint Templates. They Help Make That Crucial Difference. Our sales diagram Origanization Chart Business Framework Model Powerpoint Templates Will Help Make Your Dreams Come True. Your Thoughts Will Weave The Magic For You.
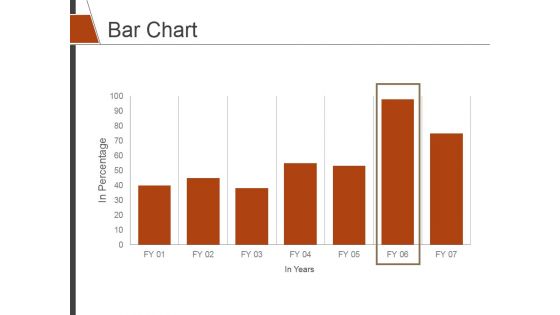
Bar Chart Ppt PowerPoint Presentation Slides Shapes
This is a bar chart ppt powerpoint presentation slides shapes. This is a seven stage process. The stages in this process are bar graph, finance, marketing, strategy, analysis.
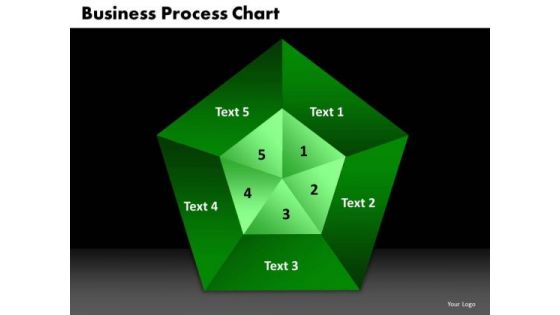
PowerPoint Backgrounds Process Chart Marketing Ppt Templates
PowerPoint Backgrounds Process Chart Marketing PPT Templates-The Circle of Life - a concept emmbedded in our minds and hence easy to comprehend. Life and Business is made up of processes comprising stages that flow from one to another. An excellent graphic to attract the attention of and understanding by your audience to improve earnings-PowerPoint Backgrounds Process Chart Marketing PPT Templates-This ppt can be used for presentations relating to-Arrow, Bond, Business, Button, Buying, Career, Change, Chart, Children, Circle, College, Death, Diagram, Education, Financial, Future, Graphic, House, Illustration, Investing, Investment, Marriage, Menu, Personal, Plan, Process Test out the effect of your thoughts. Our PowerPoint Backgrounds Process Chart Marketing Ppt Templates will assist in the experiment.
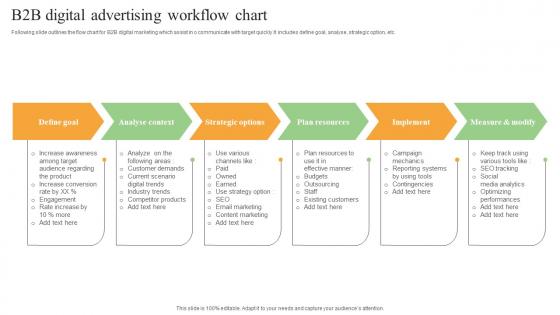
B2B Digital Advertising Workflow Chart Introduction Pdf
Following slide outlines the flow chart for B2B digital marketing which assist in o communicate with target quickly It includes define goal, analyse, strategic option, etc. Pitch your topic with ease and precision using this B2B Digital Advertising Workflow Chart Introduction Pdf. This layout presents information on Define Goal, Analyse Context, Strategic Options. It is also available for immediate download and adjustment. So, changes can be made in the color, design, graphics or any other component to create a unique layout. Following slide outlines the flow chart for B2B digital marketing which assist in o communicate with target quickly It includes define goal, analyse, strategic option, etc.
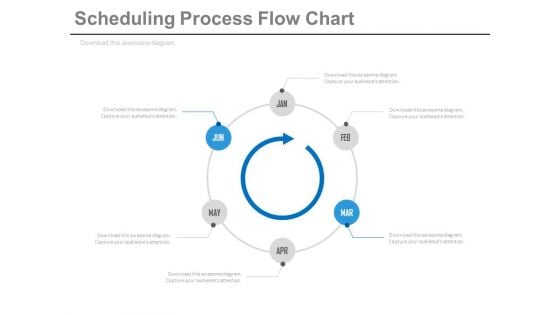
Scheduling Process Flow Chart Ppt Slides
This is a scheduling process flow chart ppt slides. This is a six stage process. The stages in this process are business, time planning, marketing, process and flows.

Product Pricing List Chart Ppt Slides
This is a product pricing list chart ppt slides. This is a four stage process. The stages in this process are arrows, business, marketing.
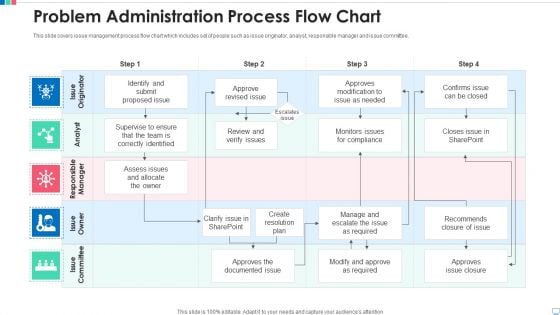
Problem Administration Process Flow Chart Pictures PDF
This slide covers issue management process flow chart which includes set of people such as issue originator, analyst, responsible manager and issue committee. Pitch your topic with ease and precision using this problem administration process flow chart pictures pdf. This layout presents information on problem administration process flow chart. It is also available for immediate download and adjustment. So, changes can be made in the color, design, graphics or any other component to create a unique layout.
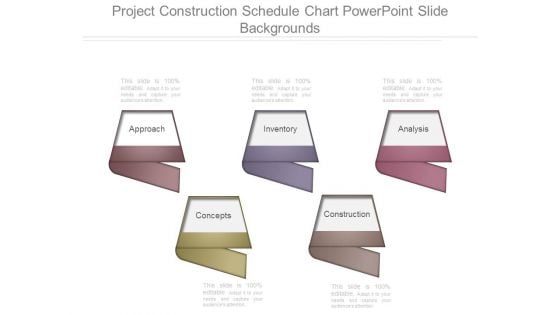
Project Construction Schedule Chart Powerpoint Slide Backgrounds
This is a project construction schedule chart powerpoint slide backgrounds. This is a five stage process. The stages in this process are approach, inventory, analysis, construction, concepts.
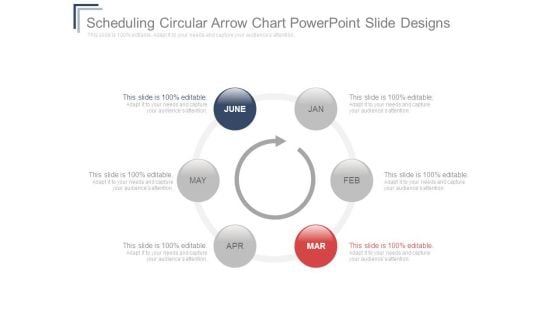
Scheduling Circular Arrow Chart Powerpoint Slide Designs
This is a scheduling circular arrow chart powerpoint slide designs. This is a six stage process. The stages in this process are june, may, apr, mar, feb, jan.
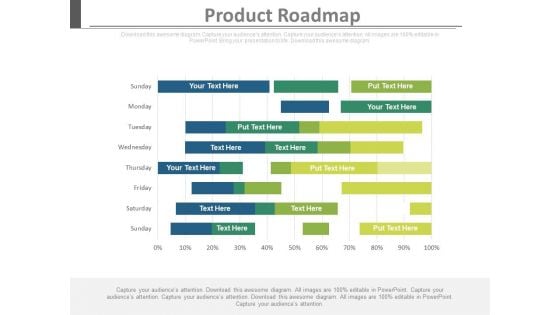
Product Roadmap Analysis Chart Ppt Slides
This is a product roadmap analysis chart ppt slides. This is a one stage process. The stages in this process are success, business, marketing.
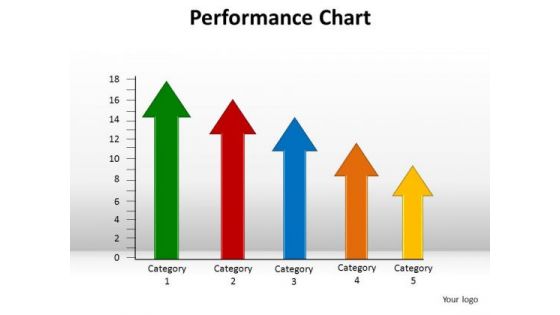
PowerPoint Layouts Graphic Performance Chart Ppt Design
PowerPoint Layouts Graphic Performance Chart PPT Design-Explore the various directions and layers existing in your in your plans and processes. Unravel the desired and essential elements of your overall strategy. Explain the relevance of the different layers and stages and directions in getting down to your core competence, ability and desired result. Step on it with our PowerPoint Layouts Graphic Performance Chart Ppt Design. Escalate the process with our PowerPoint Layouts Graphic Performance Chart Ppt Design.
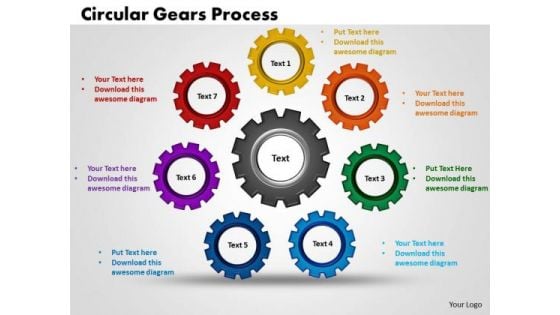
PowerPoint Process Gears Process Chart Ppt Template
PowerPoint Process Gears Process Chart PPT Template-You can use this gears process PPT template to make presentations on business, business strategy, lean manufacturing as well as other presentations requiring gears for industry and manufacturing but also for brain and creative thinking.-PowerPoint Process Gears Process Chart PPT Template Our PowerPoint Process Gears Process Chart Ppt Template will exhort you on. Establish new boundaries with your ideas.


 Continue with Email

 Home
Home


