Phase Chart
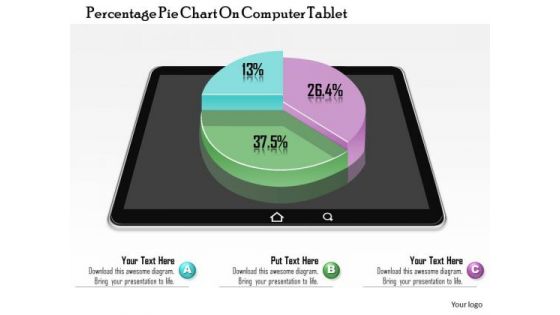
Business Diagram Percentage Pie Chart On Computer Tablet Presentation Template
This image slide displays business consulting diagram of percentage pie chart on computer tablet. This image has been made with 3d colorful graphic of pie chart on black tablet. Use this PowerPoint template, in your presentations to express various views like growth, achievements, success in business. This image slide will make your presentations outshine.
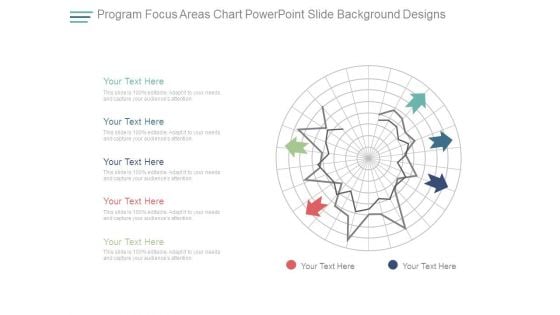
Program Focus Areas Chart Powerpoint Slide Background Designs
This is a program focus areas chart powerpoint slide background designs. This is a five stage process. The stages in this process are arrows, business, marketing, management.
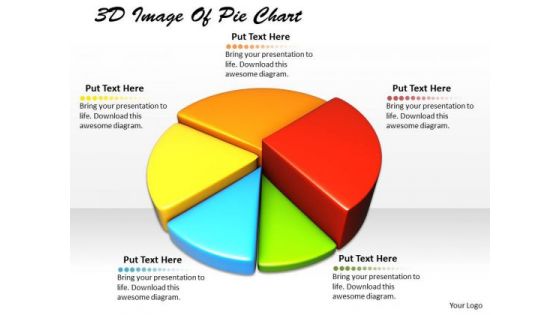
Stock Photo 3d Image Of Pie Chart Ppt Template
Document The Process On Our Stock Photo 3d Image Of Pie Chart PPT template Powerpoint Templates. Make A Record Of Every Detail.
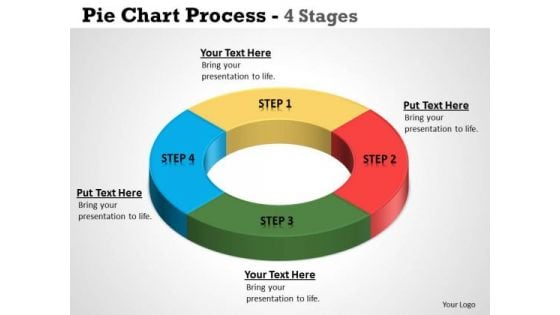
Business Framework Model Pie Chart Process 4 Stages Strategic Management
Document The Process On Our Business Framework Model Pie Chart Process 4 Stages Strategic Management Powerpoint Templates. Make A Record Of Every Detail.
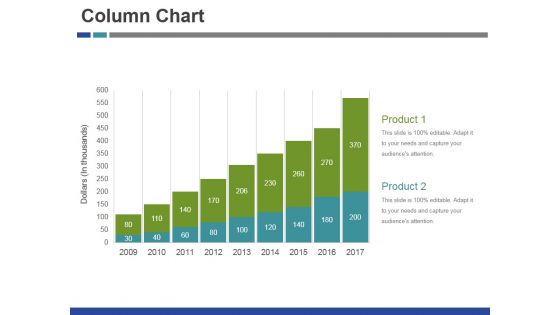
Column Chart Ppt PowerPoint Presentation Infographic Template Layouts
This is a column chart ppt powerpoint presentation infographic template layouts. This is a nine stage process. The stages in this process are product, growth, success, business, graph.

Scatter Chart Ppt PowerPoint Presentation Infographic Template Objects
This is a scatter chart ppt powerpoint presentation infographic template objects. This is a nine stage process. The stages in this process are product, growth, success, graph.
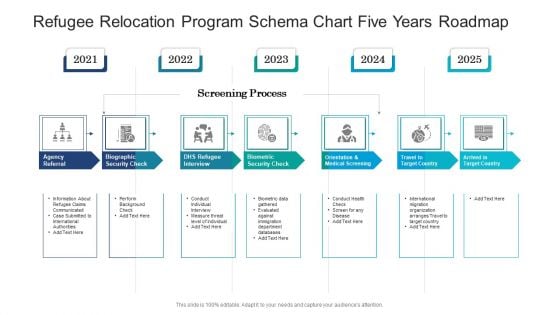
Refugee Relocation Program Schema Chart Five Years Roadmap Introduction
Presenting our innovatively structured refugee relocation program schema chart five years roadmap introduction Template. Showcase your roadmap process in different formats like PDF, PNG, and JPG by clicking the download button below. This PPT design is available in both Standard Screen and Widescreen aspect ratios. It can also be easily personalized and presented with modified font size, font type, color, and shapes to measure your progress in a clear way.
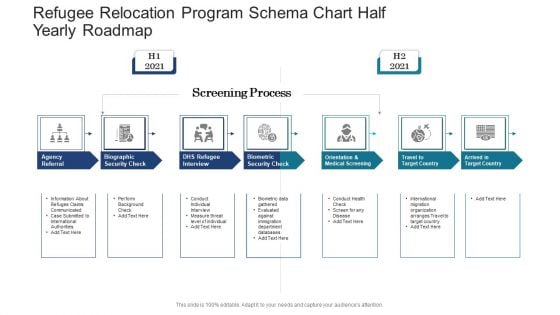
Refugee Relocation Program Schema Chart Half Yearly Roadmap Slides
Introducing our refugee relocation program schema chart half yearly roadmap slides. This PPT presentation is Google Slides compatible, therefore, you can share it easily with the collaborators for measuring the progress. Also, the presentation is available in both standard screen and widescreen aspect ratios. So edit the template design by modifying the font size, font type, color, and shapes as per your requirements. As this PPT design is fully editable it can be presented in PDF, JPG and PNG formats.
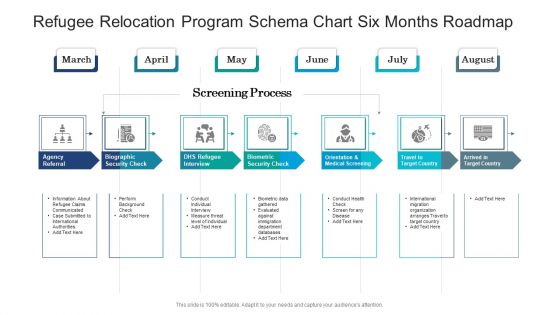
Refugee Relocation Program Schema Chart Six Months Roadmap Professional
Presenting our jaw dropping refugee relocation program schema chart six months roadmap professional. You can alternate the color, font size, font type, and shapes of this PPT layout according to your strategic process. This PPT presentation is compatible with Google Slides and is available in both standard screen and widescreen aspect ratios. You can also download this well researched PowerPoint template design in different formats like PDF, JPG, and PNG. So utilize this visually appealing design by clicking the download button given below.
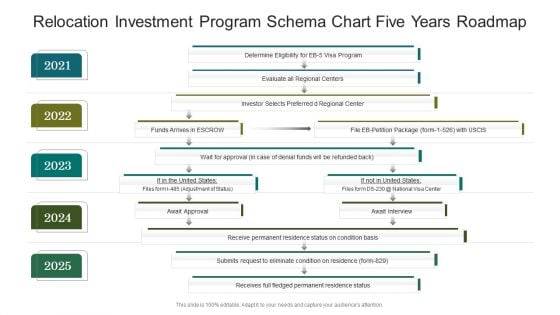
Relocation Investment Program Schema Chart Five Years Roadmap Portrait
Presenting our innovatively structured relocation investment program schema chart five years roadmap portrait Template. Showcase your roadmap process in different formats like PDF, PNG, and JPG by clicking the download button below. This PPT design is available in both Standard Screen and Widescreen aspect ratios. It can also be easily personalized and presented with modified font size, font type, color, and shapes to measure your progress in a clear way.
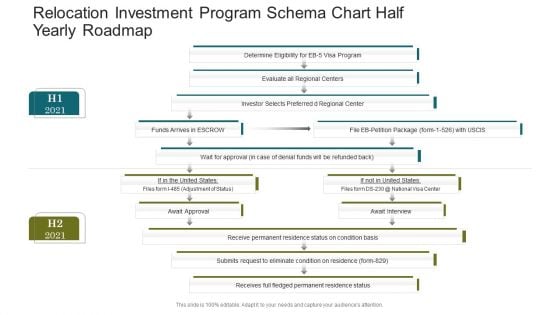
Relocation Investment Program Schema Chart Half Yearly Roadmap Topics
Introducing our relocation investment program schema chart half yearly roadmap topics. This PPT presentation is Google Slides compatible, therefore, you can share it easily with the collaborators for measuring the progress. Also, the presentation is available in both standard screen and widescreen aspect ratios. So edit the template design by modifying the font size, font type, color, and shapes as per your requirements. As this PPT design is fully editable it can be presented in PDF, JPG and PNG formats.
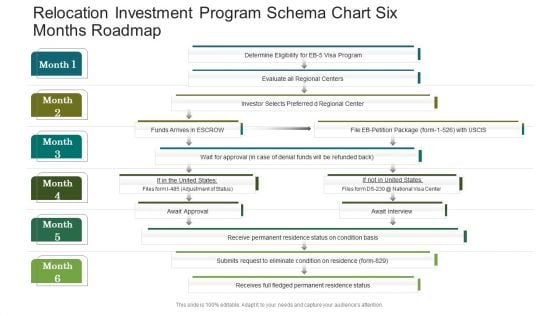
Relocation Investment Program Schema Chart Six Months Roadmap Topics
Presenting our jaw dropping relocation investment program schema chart six months roadmap topics. You can alternate the color, font size, font type, and shapes of this PPT layout according to your strategic process. This PPT presentation is compatible with Google Slides and is available in both standard screen and widescreen aspect ratios. You can also download this well researched PowerPoint template design in different formats like PDF, JPG, and PNG. So utilize this visually appealing design by clicking the download button given below.
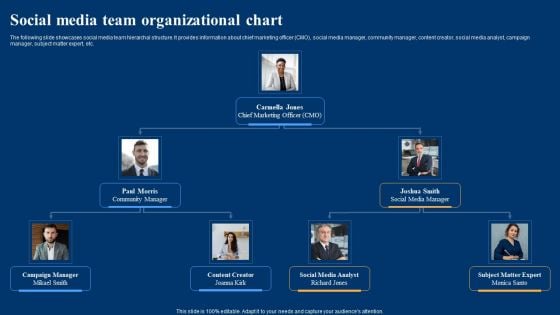
Optimizing Social Networks Social Media Team Organizational Chart Brochure PDF
The following slide showcases social media team hierarchal structure. It provides information about chief marketing officer CMO, social media manager, community manager, content creator, social media analyst, campaign manager, subject matter expert, etc. Slidegeeks has constructed Optimizing Social Networks Social Media Team Organizational Chart Brochure PDF after conducting extensive research and examination. These presentation templates are constantly being generated and modified based on user preferences and critiques from editors. Here, you will find the most attractive templates for a range of purposes while taking into account ratings and remarks from users regarding the content. This is an excellent jumping-off point to explore our content and will give new users an insight into our top-notch PowerPoint Templates.
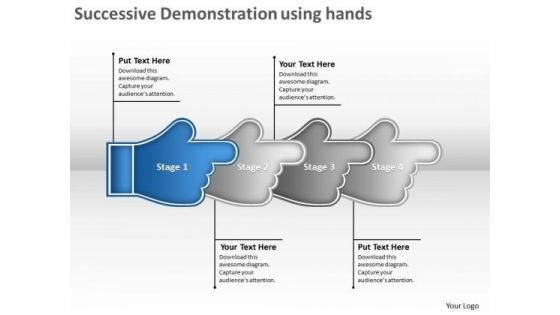
Successive Demonstration Using Hands Production Planning Flow Chart PowerPoint Templates
We present our successive demonstration using hands production planning flow chart PowerPoint templates. Use our Symbol PowerPoint Templates because; In any endeavor people matter most. Use our Business PowerPoint Templates because, Marketing Strategy Business Template:- Maximizing sales of your product is the intended destination. Use our Metaphor PowerPoint Templates because; educate your staff on the means to provide the required support for speedy recovery. Use our Abstract PowerPoint Templates because; Use our creative template to lay down your views. Use our Process and Flows PowerPoint Templates because, Our PowerPoint templates designed for your ideas to sell. Use these PowerPoint slides for presentations relating to Description using hands steps, Business, Collection, Connection, Cursor, Decoration, Design, Dimensional, Direction, Element, Icon, Illustration, Information, Modern, Motion, Paper, Perspective, Plastic, Pointer, Pointing, Process, Recycle, Recycling, Reflective, Set, Shape, Shiny, Sign, Symbol, Technology. The prominent colors used in the PowerPoint template are Blue, Gray, and Black Dwell on your exploits with our Successive Demonstration Using Hands Production Planning Flow Chart PowerPoint Templates. Bring out the courage of your actions.
Monetary Incentive Icon In Programs Chart Ideas PDF
Persuade your audience using this Monetary Incentive Icon In Programs Chart Ideas PDF. This PPT design covers three stages, thus making it a great tool to use. It also caters to a variety of topics including Monetary Incentive Icon, Programs Chart. Download this PPT design now to present a convincing pitch that not only emphasizes the topic but also showcases your presentation skills.
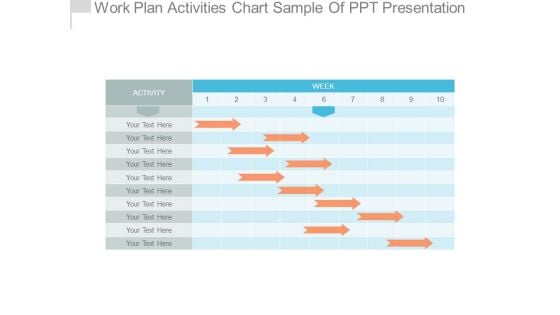
Work Plan Activities Chart Sample Of Ppt Presentation
This is a work plan activities chart sample of ppt presentation. This is a ten stage process. The stages in this process are table, management, business, strategy, presentation.
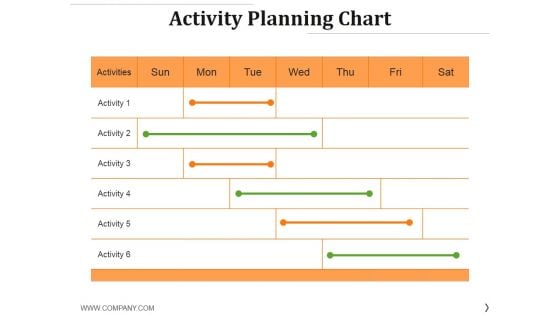
Activity Planning Chart Ppt PowerPoint Presentation Show Layout
This is a activity planning chart ppt powerpoint presentation show layout. This is a six stage process. The stages in this process are activities, activity, business, table, management.
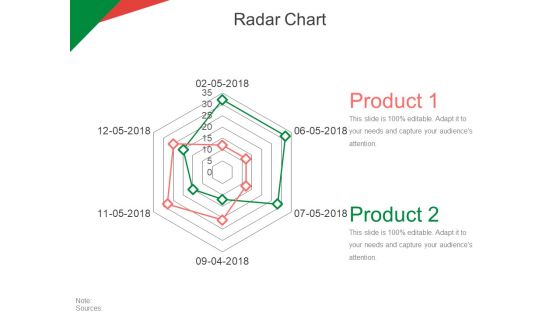
Radar Chart Ppt PowerPoint Presentation Infographic Template Slides
This is a radar chart ppt powerpoint presentation infographic template slides. This is a two stage process. The stages in this process are product, business, marketing, management, planning.
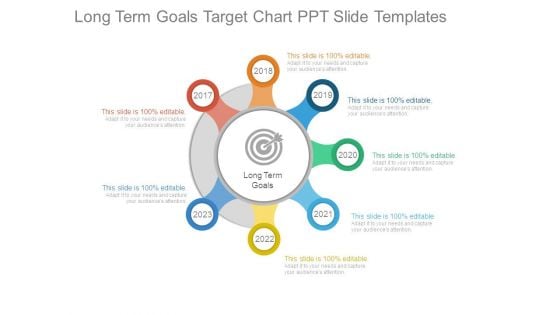
Long Term Goals Target Chart Ppt Slide Templates
This is a long term goals target chart ppt slide templates. This is a seven stage process. The stages in this process are long term goals.
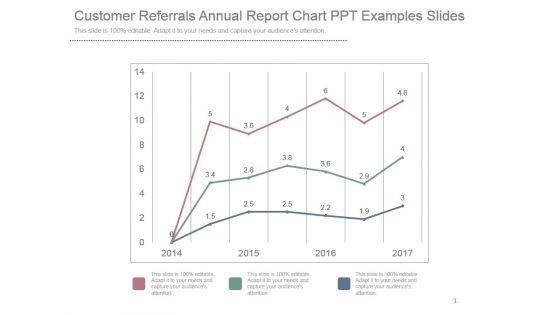
Customer Referrals Annual Report Chart Ppt Examples Slides
This is a customer referrals annual report chart ppt examples slides. This is a three stage process. The stages in this process are business, marketing, graph, success, years.
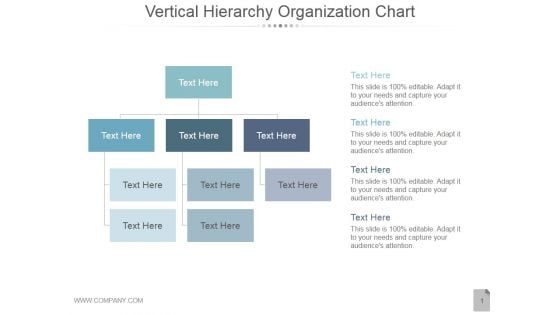
Vertical Hierarchy Organization Chart Ppt PowerPoint Presentation Layouts
This is a vertical hierarchy organization chart ppt powerpoint presentation layouts. This is a four stage process. The stages in this process are text, marketing, business, success, tables.
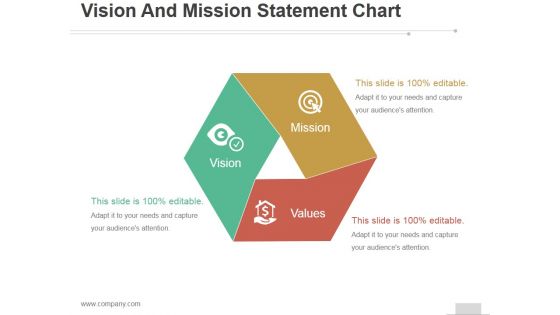
Vision And Mission Statement Chart Ppt PowerPoint Presentation Background Images
This is a vision and mission statement chart ppt powerpoint presentation background images. This is a three stage process. The stages in this process are mission, vision, values.

Organization Chart Template Ppt PowerPoint Presentation Gallery Microsoft
This is a organization chart template ppt powerpoint presentation gallery microsoft. This is a two stage process. The stages in this process are carter, parker, engineer, marketing, manager.
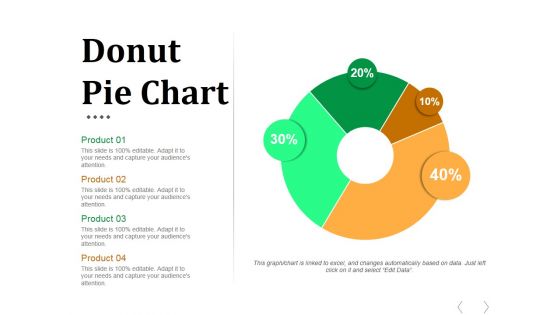
Donut Pie Chart Ppt PowerPoint Presentation Infographics Graphics
This is a donut pie chart ppt powerpoint presentation infographics graphics. This is a four stage process. The stages in this process are business, marketing, donut, finance, management.
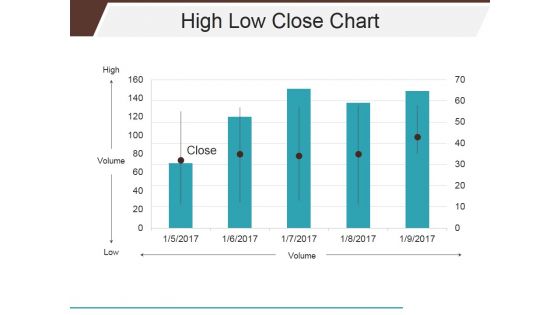
High Low Close Chart Ppt PowerPoint Presentation Infographics Shapes
This is a high low close chart ppt powerpoint presentation infographics shapes. This is a five stage process. The stages in this process are close, volume, high, low.
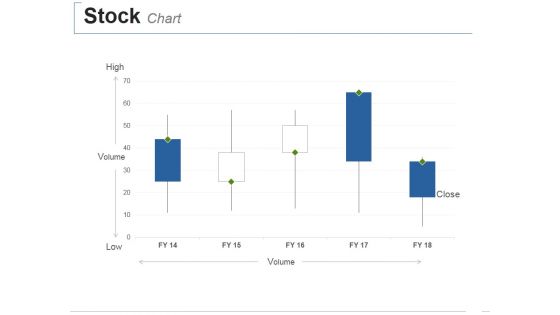
Stock Chart Ppt PowerPoint Presentation Styles Visual Aids
This is a stock chart ppt powerpoint presentation styles visual aids. This is a three stage process. The stages in this process are high, volume, low, close.
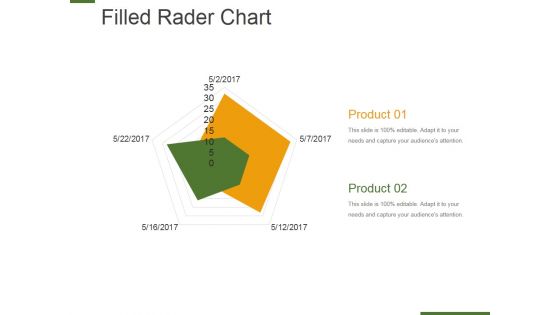
Filled Rader Chart Ppt PowerPoint Presentation Outline Inspiration
This is a filled rader chart ppt powerpoint presentation outline inspiration. This is a two stage process. The stages in this process are product, business, marketing, process, success.
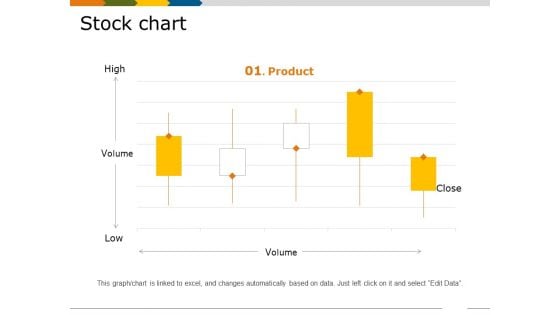
Stock Chart Ppt PowerPoint Presentation Pictures Graphics Tutorials
This is a stock chart ppt powerpoint presentation pictures graphics tutorials. This is a five stage process. The stages in this process are high, volume, low, product, business.
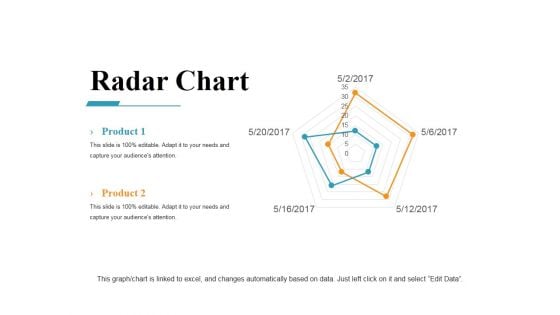
Radar Chart Ppt PowerPoint Presentation Ideas Master Slide
This is a radar chart ppt powerpoint presentation ideas master slide. This is a five stage process. The stages in this process are radar, business, marketing, strategy, finance.
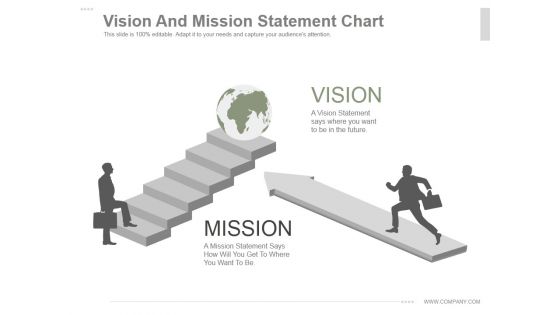
Vision And Mission Statement Chart Ppt PowerPoint Presentation Ideas
This is a vision and mission statement chart ppt powerpoint presentation ideas. This is a two stage process. The stages in this process are vision, mission.
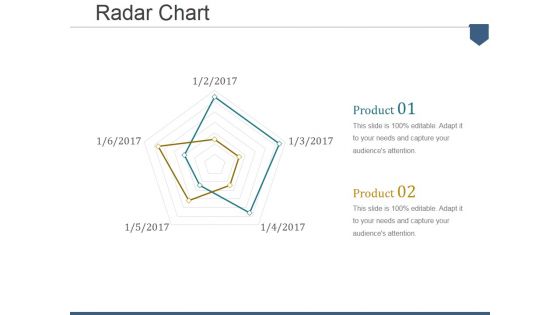
Radar Chart Ppt PowerPoint Presentation Inspiration Clipart Images
This is a radar chart ppt powerpoint presentation inspiration clipart images. This is a two stage process. The stages in this process are business, management, strategy, marketing, planning.
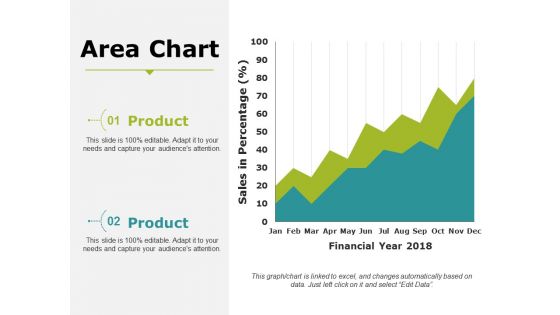
Area Chart Ppt PowerPoint Presentation Infographic Template Portrait
This is a area chart ppt powerpoint presentation infographic template portrait. This is a two stage process. The stages in this process are business, marketing, strategy, planning, finance.
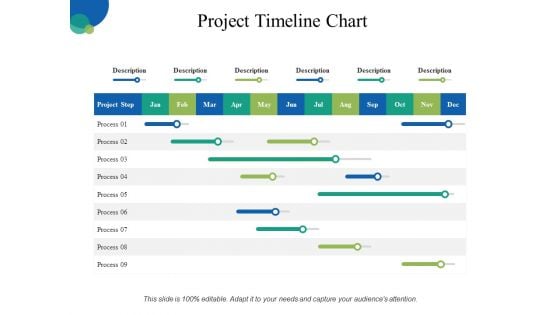
Project Timeline Chart Ppt PowerPoint Presentation Slides Graphics
This is a project timeline chart ppt powerpoint presentation slides graphics. This is a six stage process. The stages in this process are process, marketing, planning, strategy, timeline.
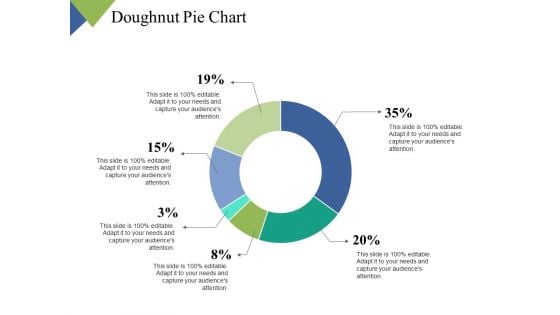
Doughnut Pie Chart Ppt PowerPoint Presentation Model Skills
This is a doughnut pie chart ppt powerpoint presentation model skills. This is a six stage process. The stages in this process are business, management, planning, strategy, marketing.
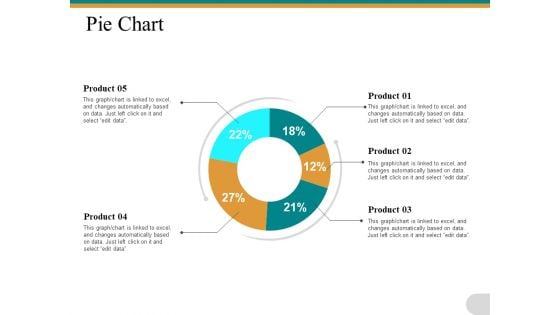
Pie Chart Ppt PowerPoint Presentation File Slide Download
This is a pie chart ppt powerpoint presentation file slide download. This is a five stage process. The stages in this process are business, management, strategy, analysis, planning.
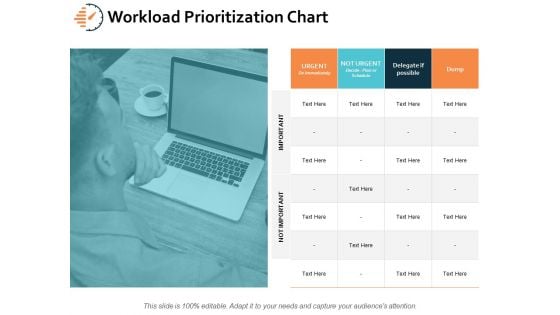
Workload Prioritization Chart Ppt PowerPoint Presentation Styles Designs
This is a workload prioritization chart ppt powerpoint presentation styles designs. This is a four stage process. The stages in this process are technology, business, planning, marketing, knowledge.
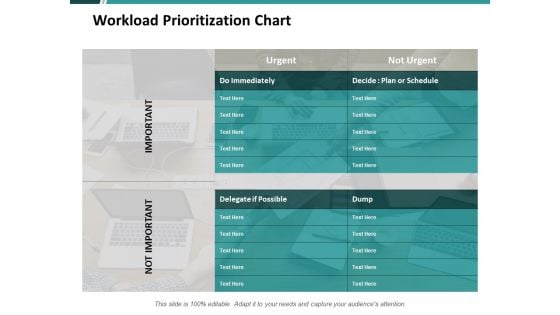
Workload Prioritization Chart Ppt PowerPoint Presentation Pictures Show
This is a workload prioritization chart ppt powerpoint presentation pictures show. This is a two stage process. The stages in this process are compare, marketing, business, management, planning.
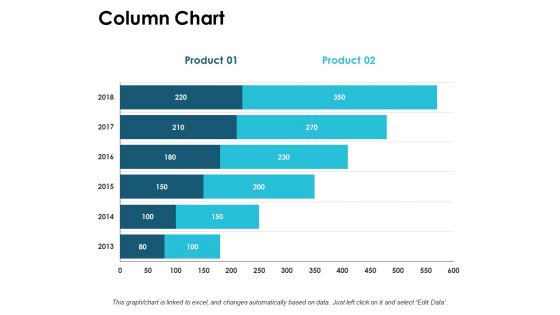
Column Chart Graph Ppt PowerPoint Presentation Outline Information
This is a column chart graph ppt powerpoint presentation outline information. This is a three stage process. The stages in this process are compare, marketing, business, management, planning.
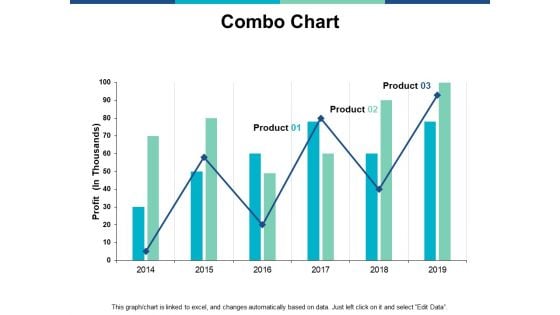
Combo Chart Graph Ppt PowerPoint Presentation Infographics Guide
This is a combo chart graph ppt powerpoint presentation infographics guide. This is a two stage process. The stages in this process are marketing, business, management, planning, strategy.
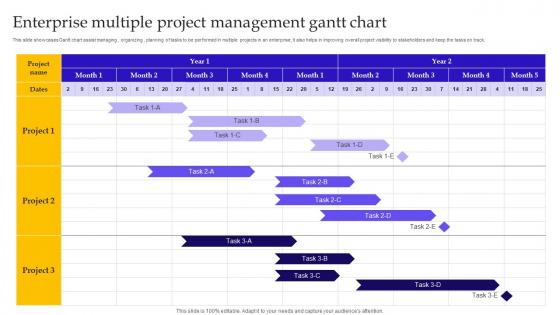
Enterprise Multiple Project Management Gantt Chart Elements Pdf
This slide showcases Gantt chart assist managing, organizing, planning of tasks to be performed in multiple projects in an enterprise, it also helps in improving overall project visibility to stakeholders and keep the tasks on track. Showcasing this set of slides titled Enterprise Multiple Project Management Gantt Chart Elements Pdf. The topics addressed in these templates are Enterprise Multiple Project, Management Gantt Chart, Planning Of Tasks. All the content presented in this PPT design is completely editable. Download it and make adjustments in color, background, font etc. as per your unique business setting. This slide showcases Gantt chart assist managing, organizing, planning of tasks to be performed in multiple projects in an enterprise, it also helps in improving overall project visibility to stakeholders and keep the tasks on track.
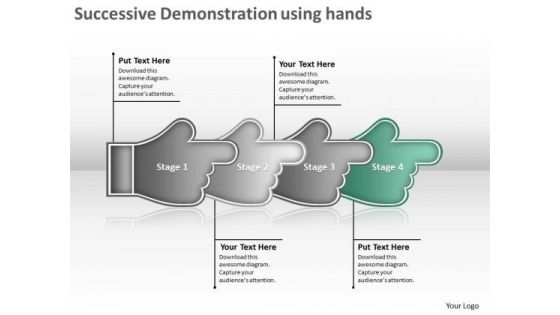
Successive Demonstration Using Hands Flow Chart Creator PowerPoint Templates
We present our successive demonstration using hands flow chart creator PowerPoint templates. Use our Symbol PowerPoint Templates because, are the tools that helped most of us evolve. Use our Business PowerPoint Templates because, Marketing Strategy Business Template:- Maximizing sales of your product is the intended destination. Use our Metaphor PowerPoint Templates because, Profit fairly earned is what you believe in. Use our Abstract PowerPoint Templates because, Forward thinking is the way to go. Use our Process and Flows PowerPoint Templates because, Original thinking is the need of the hour. Use these PowerPoint slides for presentations relating to Description using hands steps, Business, Collection, Connection, Cursor, Decoration, Design, Dimensional, Direction, Element, Icon, Illustration, Information, Modern, Motion, Paper, Perspective, Plastic, Pointer, Pointing, Process, Recycle, Recycling, Reflective, Set, Shape, Shiny, Sign, Symbol, Technology. The prominent colors used in the PowerPoint template are Green, Gray, and Black Drive your organization with our Successive Demonstration Using Hands Flow Chart Creator PowerPoint Templates. Download without worries with our money back guaranteee.
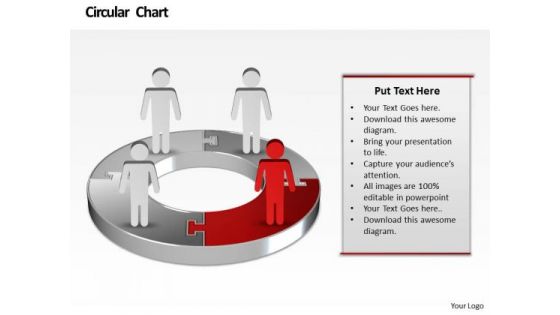
Ppt Illustration Of Financial Pie Chart Marketing Presentation PowerPoint Templates
PPT illustration of financial pie chart marketing presentation powerpoint Templates-You have the people in place, selected the team leaders and all are raring to go. You have the plans ready for them to absorb and understand. Educate your team with your thoughts and logic. -PPT illustration of financial pie chart marketing presentation powerpoint Templates-Abstract, Access, Arrow, Background, Business, Chart, Circle, Concept, Conceptual, Connection, Corporate, Creative, Cycle, Design, Different, Element, Empty, Form, Frame, Graphic, Group, Idea, Illustration, Part, Piece, Place, Process, Red, Shapes, Solution, Special, Speech, Strategy, Symbol Our Ppt Illustration Of Financial Pie Chart Marketing Presentation PowerPoint Templates can be aesthetically appealing. Expose your audience to the art of beauty.
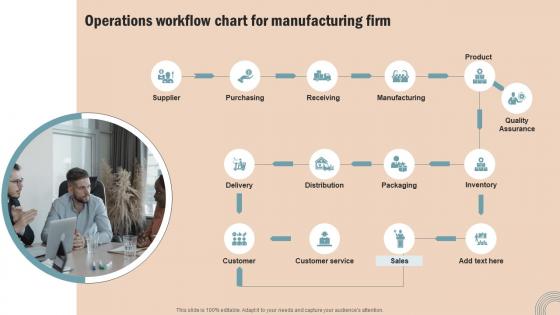
Operations Workflow Chart Operations Strategy Improve Business Productivity Slides Pdf
Presenting this PowerPoint presentation, titled Operations Workflow Chart Operations Strategy Improve Business Productivity Slides Pdf, with topics curated by our researchers after extensive research. This editable presentation is available for immediate download and provides attractive features when used. Download now and captivate your audience. Presenting this Operations Workflow Chart Operations Strategy Improve Business Productivity Slides Pdf. Our researchers have carefully researched and created these slides with all aspects taken into consideration. This is a completely customizable Operations Workflow Chart Operations Strategy Improve Business Productivity Slides Pdf that is available for immediate downloading. Download now and make an impact on your audience. Highlight the attractive features available with our PPTs. Our Operations Workflow Chart Operations Strategy Improve Business Productivity Slides Pdf are topically designed to provide an attractive backdrop to any subject. Use them to look like a presentation pro.
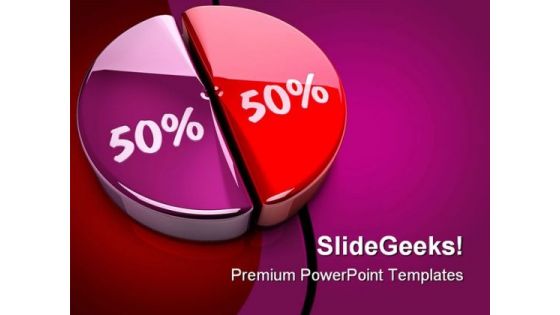
Pie Chart Percent Business PowerPoint Templates And PowerPoint Backgrounds 0911
Microsoft PowerPoint Template and Background with pie chart with fifty fifty percent Encourage your community to take action. Get them to back the cause you champion.
Business Strategy Examples 3d Man With Growth Chart Concepts
Good Camaraderie Is A Key To Teamwork. Our business strategy examples 3d man with growth chart concepts Powerpoint Templates Can Be A Cementing Force.
Business Strategy 3d Man With Alphabetic Chart Adaptable Concepts
Get Out Of The Dock With Our business strategy 3d man with alphabetic chart adaptable concepts Powerpoint Templates. Your Mind Will Be Set Free.
Marketing Concepts 3d Confused Man Front Of Bar Chart Characters
Drum It Up With Our marketing concepts 3d confused man front of bar chart characters Powerpoint Templates. Your Thoughts Will Raise The Tempo.
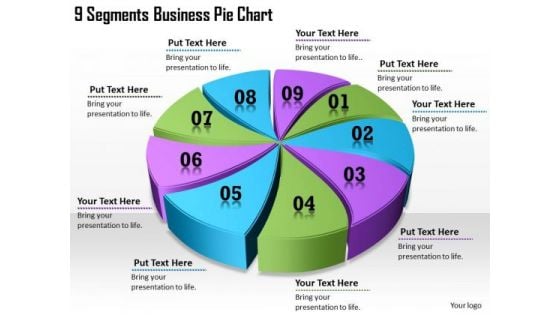
Timeline Ppt Template 9 Segments Business Pie Chart
Our Timeline Ppt Template 9 Segments Business Pie Chart Powerpoint Templates Leave No One In Doubt. Provide A Certainty To Your Views.
Business Strategy Execution Stand With Result Pie Chart Basic Concepts
Double The Impact With Our business strategy execution stand with result pie chart basic concepts Powerpoint Templates. Your Thoughts Will Have An Imposing Effect.
Innovative Marketing Concepts 3d Team Discussion Pie Chart Basic Business
Our innovative marketing concepts 3d team discussion pie chart basic business Powerpoint Templates Leave No One In Doubt. Provide A Certainty To Your Views.
Modern Marketing Concepts 3d Team Meeting Budget Pie Chart Characters
Good Camaraderie Is A Key To Teamwork. Our modern marketing concepts 3d team meeting budget pie chart characters Powerpoint Templates Can Be A Cementing Force.
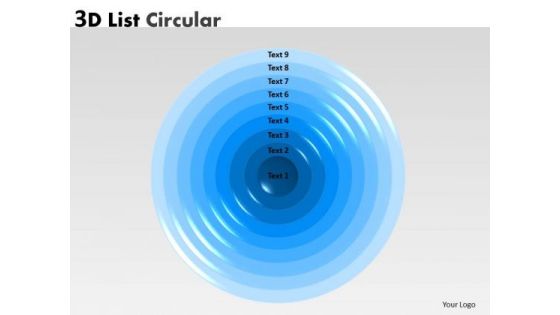
Business Framework Model 9 Staged Circular Chart Strategic Management
Document Your Views On Our Business Framework Model 9 Staged Circular Chart Strategic Management Powerpoint Templates. They Will Create A Strong Impression.
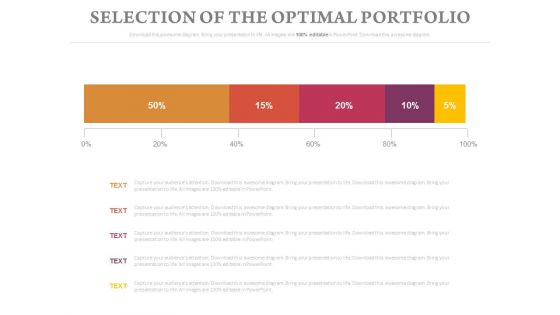
Selection Of The Optimal Portfolio Chart Ppt Slides
This is a selection of the optimal portfolio chart ppt slides. This is a five stage process. The stages in this process are business, finance, marketing.
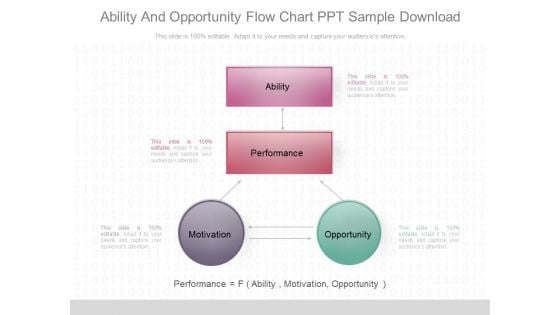
Ability And Opportunity Flow Chart Ppt Sample Download
This is a ability and opportunity flow chart ppt sample download. This is a four stage process. The stages in this process are ability, performance, motivation, opportunity.
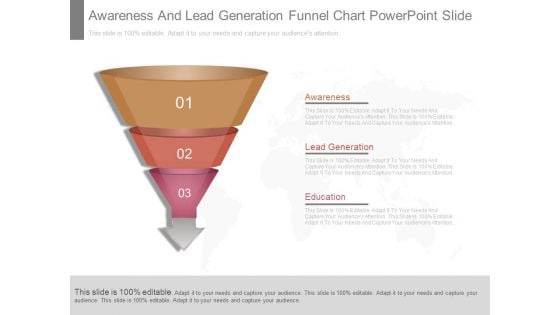
Awareness And Lead Generation Funnel Chart Powerpoint Slide
This is a awareness and lead generation funnel chart powerpoint slide. This is a three stage process. The stages in this process are awareness, lead generation, education.
Management Information Systems Chart Powerpoint Slide Presentation Tips
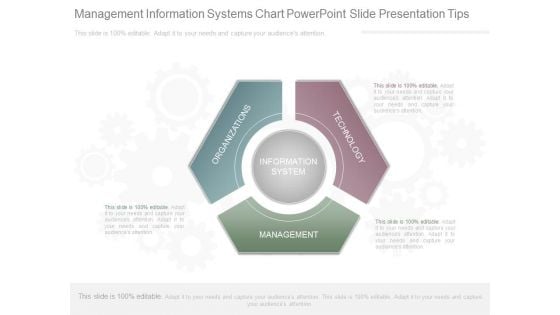
This is a management information systems chart powerpoint slide presentation tips. This is a three stage process. The stages in this process are organizations, technology, management, information system.
Keys To Successful Positioning Chart Powerpoint Slide Designs
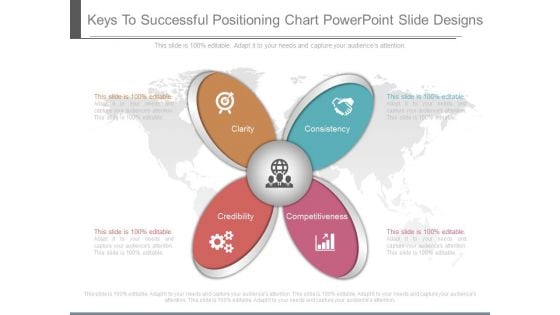
This is a keys to successful positioning chart powerpoint slide designs. This is a four stage process. The stages in this process are clarity, consistency, credibility, competitiveness.
Budget Calculator Chart Layout Powerpoint Slides Designs Download
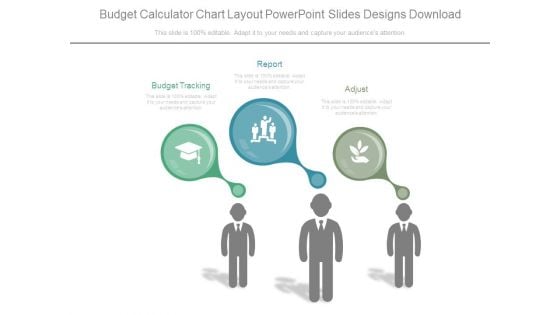
This is a budget calculator chart layout powerpoint slides designs download. This is a three stage process. The stages in this process are budget tracking, report, adjust.
Activities And Functional Process Chart Powerpoint Slide Images
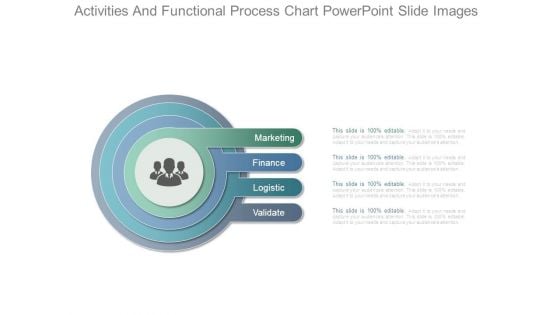
This is a activities and functional process chart powerpoint slide images. This is a four stage process. The stages in this process are marketing, finance, logistic, validate.
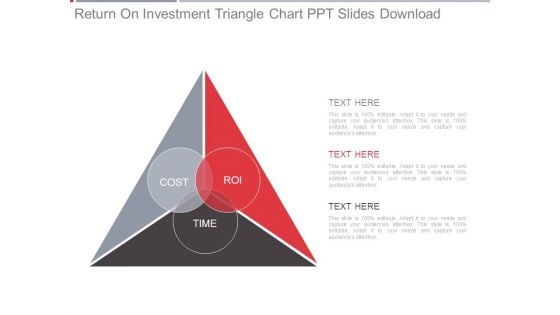
Return On Investment Triangle Chart Ppt Slides Download
This is a return on investment triangle chart ppt slides download. This is a three stage process. The stages in this process are cost, roi, time.


 Continue with Email

 Home
Home


