Phase Chart
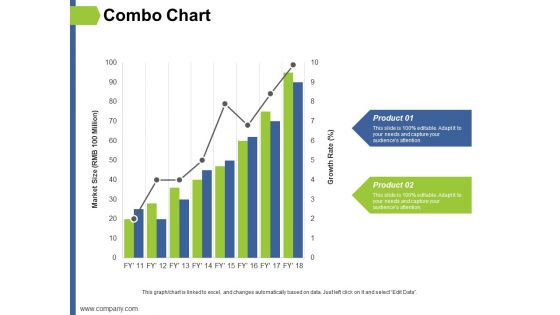
Combo Chart Ppt PowerPoint Presentation Layouts Example Topics
This is a combo chart ppt powerpoint presentation layouts example topics. This is a two stage process. The stages in this process are finance, marketing, management, investment, analysis.
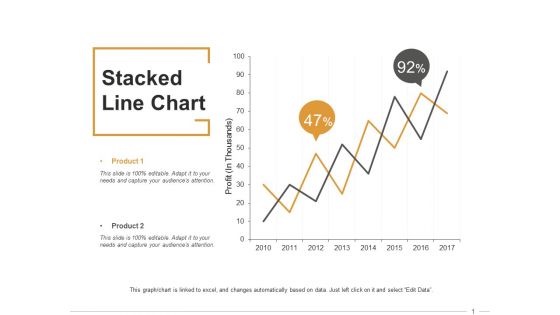
Stacked Line Chart Ppt PowerPoint Presentation Inspiration Format
This is a stacked line chart ppt powerpoint presentation inspiration format. This is a two stage process. The stages in this process are finance, marketing, management, investment, analysis.
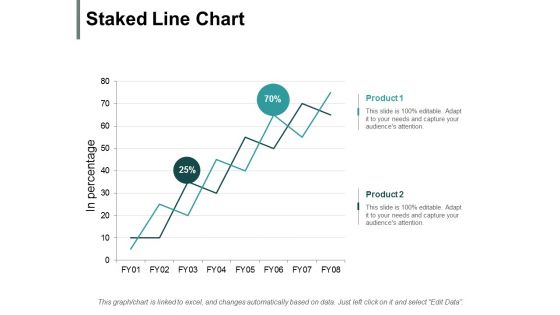
Staked Line Chart Ppt PowerPoint Presentation Ideas Influencers
This is a staked line chart ppt powerpoint presentation ideas influencers. This is a two stage process. The stages in this process are finance, marketing, management, investment, analysis.
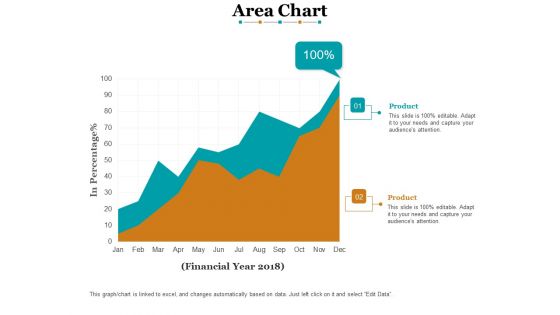
Area Chart Finance Ppt PowerPoint Presentation Model Ideas
This is a area chart finance ppt powerpoint presentation model ideas. This is a two stage process. The stages in this process are finance, marketing, analysis, business, investment.
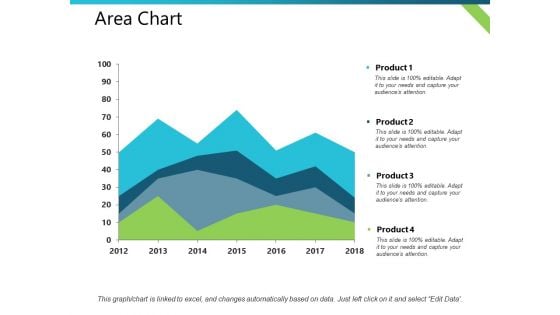
Area Chart Product Finance Ppt PowerPoint Presentation Guide
This is a area chart product finance ppt powerpoint presentation guide. This is a four stage process. The stages in this process are business, management, financial, marketing, sales.
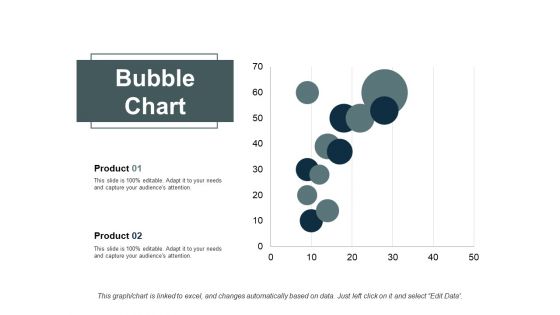
Bubble Chart Finance Ppt PowerPoint Presentation Slides Show
This is a bubble chart finance ppt powerpoint presentation slides show. This is a two stage process. The stages in this process are finance, marketing, analysis, business, investment.
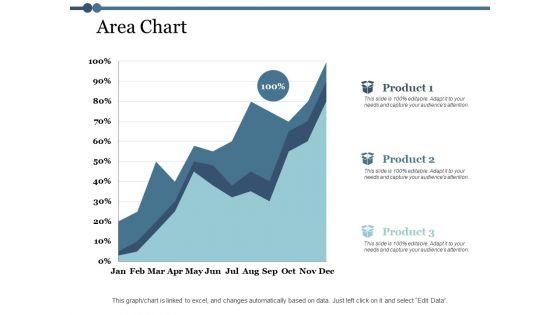
Area Chart Finance Ppt PowerPoint Presentation Outline Design Templates
This is a area chart finance ppt powerpoint presentation outline design templates. This is a three stage process. The stages in this process arefinance, marketing, management, investment, analysis.
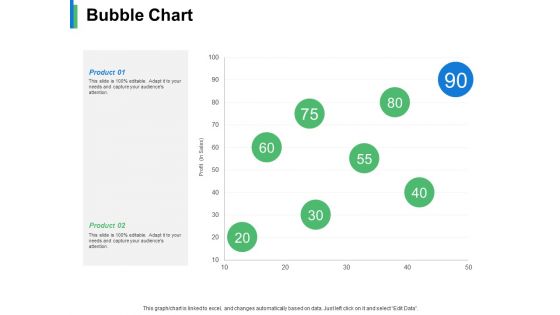
Bubble Chart Product Ppt PowerPoint Presentation Infographics Backgrounds
This is a bubble chart product ppt powerpoint presentation infographics backgrounds. This is a two stage process. The stages in this process are business, management, strategy, marketing, sales.
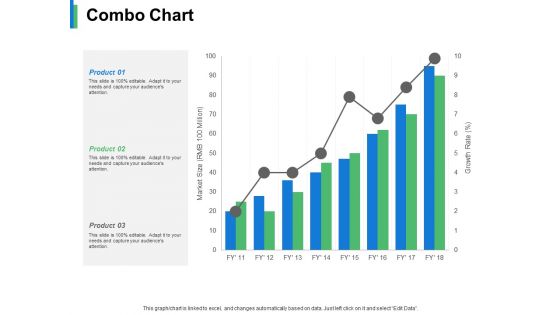
Combo Chart Product Ppt PowerPoint Presentation Slides Aids
This is a combo chart product ppt powerpoint presentation slides aids. This is a three stage process. The stages in this process are business, management, marketing, strategy, sales.
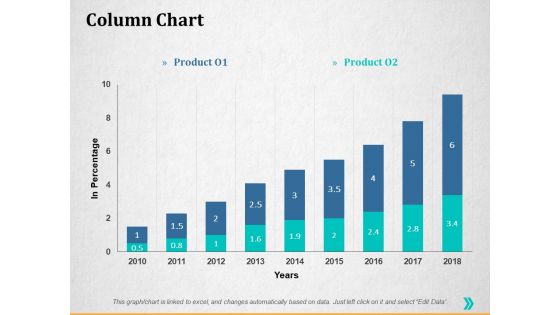
Column Chart Ppt PowerPoint Presentation Infographics Graphics Template
This is a column chart ppt powerpoint presentation infographics graphics template. This is a two stage process. The stages in this process are percentage, product, business, management, marketing.
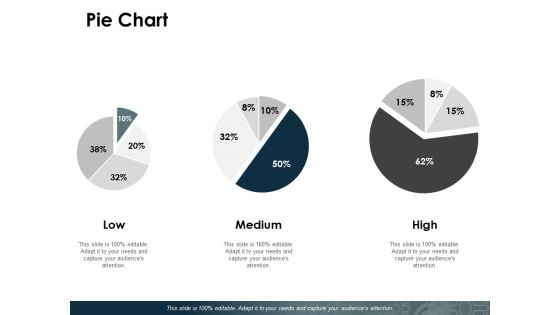
Pie Chart Ppt PowerPoint Presentation Infographic Template Topics
This is a pie chart ppt powerpoint presentation infographic template topics. This is a three stage process. The stages in this process are percentage, management, marketing, business.
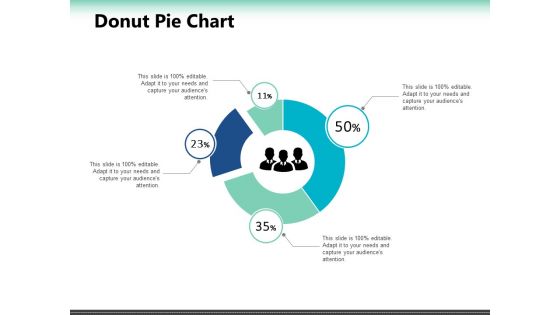
Donut Pie Chart Ppt PowerPoint Presentation Outline Deck
This is a donut pie chart ppt powerpoint presentation outline deck. This is a four stage process. The stages in this process are finance, business, marketing, management, percentage.
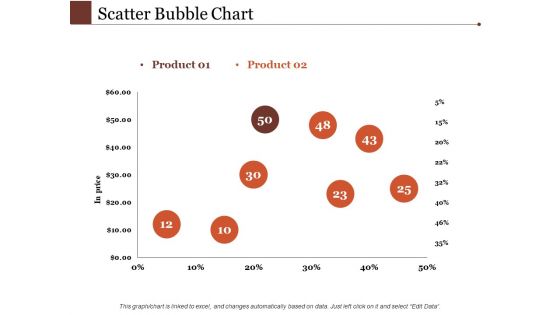
Scatter Bubble Chart Ppt PowerPoint Presentation Inspiration Demonstration
This is a scatter bubble chart ppt powerpoint presentation inspiration demonstration. This is a two stage process. The stages in this process are percentage, product, business, management, marketing.

Pie Chart Finance Ppt PowerPoint Presentation Outline Pictures
This is a pie chart finance ppt powerpoint presentation outline pictures. This is a three stage process. The stages in this process are finance, analysis, business, investment, marketing.
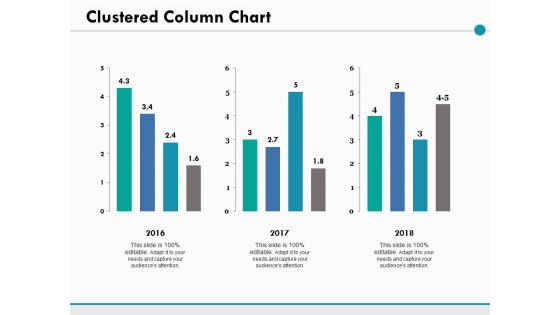
Clustered Column Chart Ppt PowerPoint Presentation Ideas Picture
This is a clustered column chart ppt powerpoint presentation ideas picture. This is a three stage process. The stages in this process are percentage, product, management, marketing.
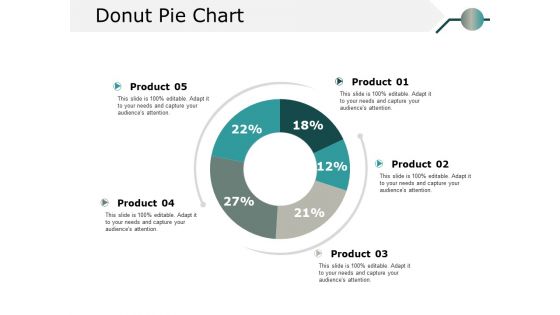
Donut Pie Chart Ppt PowerPoint Presentation Model Information
This is a donut pie chart ppt powerpoint presentation model information. This is a five stage process. The stages in this process are percentage, product, business.
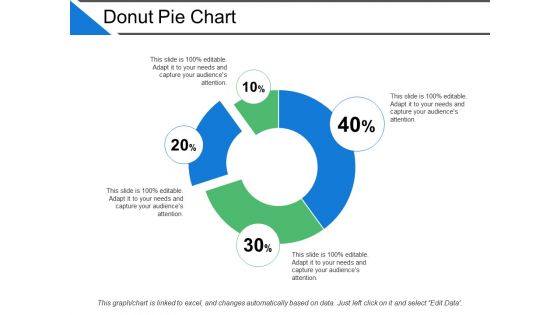
Donut Pie Chart Ppt PowerPoint Presentation Model Outline
This is a donut pie chart ppt powerpoint presentation model outline. This is a four stage process. The stages in this process are percentage, product, business.
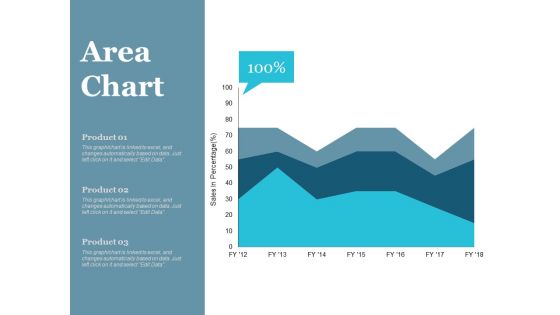
Area Chart Finance Ppt PowerPoint Presentation Infographics Deck
This is a area chart finance ppt powerpoint presentation infographics deck. This is a three stage process. The stages in this process are finance, marketing, management, investment, analysis.
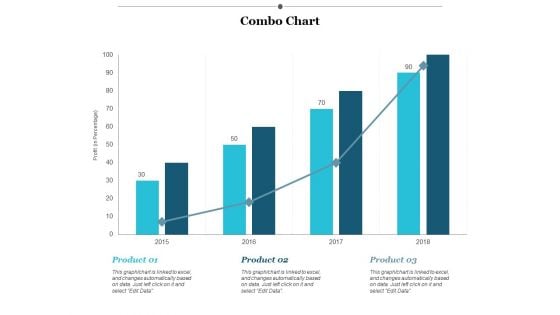
Combo Chart Finance Ppt PowerPoint Presentation Styles Example
This is a combo chart finance ppt powerpoint presentation styles example. This is a three stage process. The stages in this process are finance, marketing, management, investment, analysis.
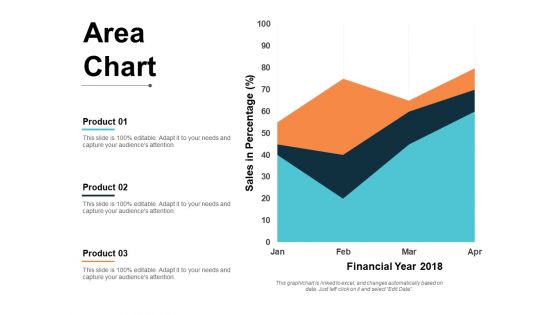
area chart finance ppt powerpoint presentation pictures format
This is a area chart finance ppt powerpoint presentation pictures format. This is a three stage process. The stages in this process are finance, marketing, management, investment, analysis.
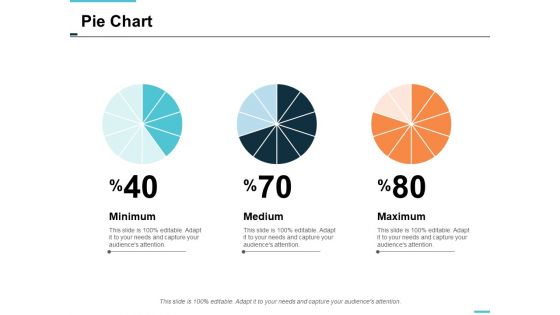
pie chart finance ppt powerpoint presentation styles skills
This is a pie chart finance ppt powerpoint presentation styles skills. This is a three stage process. The stages in this process are finance, marketing, management, investment, analysis.
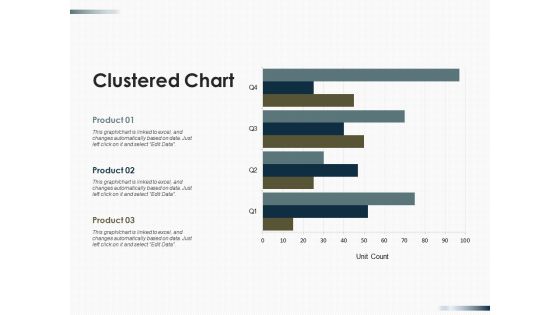
Clustered Chart Finance Ppt PowerPoint Presentation Summary Guide
This is a clustered chart finance ppt powerpoint presentation summary guide. This is a three stage process. The stages in this process are finance, marketing, management, investment, analysis.

Combo Chart Finance Ppt PowerPoint Presentation Portfolio Guidelines
This is a combo chart finance ppt powerpoint presentation portfolio guidelines. This is a three stage process. The stages in this process are finance, marketing, management, investment, analysis.
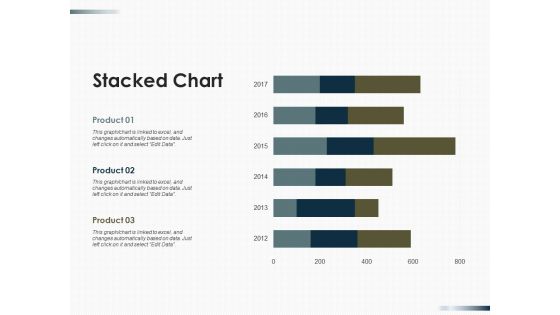
Stacked Chart Finance Ppt PowerPoint Presentation Outline Infographics
This is a stacked chart finance ppt powerpoint presentation outline infographics. This is a three stage process. The stages in this process are finance, marketing, management, investment, analysis.
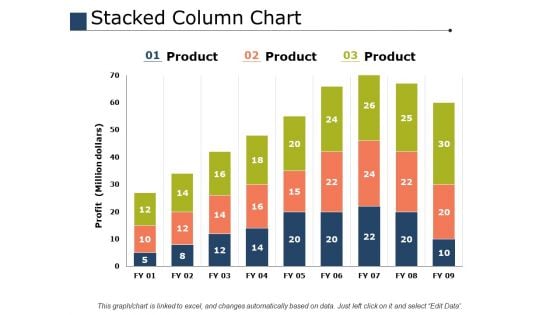
Stacked Column Chart Ppt PowerPoint Presentation Slides Files
This is a stacked column chart ppt powerpoint presentation slides files. This is a three stage process. The stages in this process are percentage, product, business, marketing.
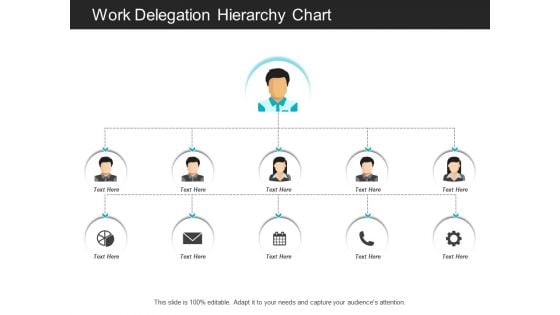
Work Delegation Hierarchy Chart Ppt PowerPoint Presentation File Graphic Images
This is a work delegation hierarchy chart ppt powerpoint presentation file graphic images. This is a five stage process. The stages in this process are delegation, deputation, delegacy.
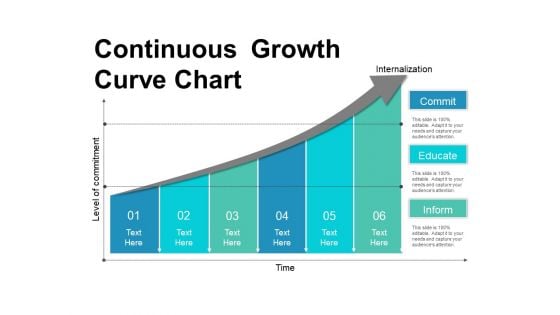
Continuous Growth Curve Chart Ppt PowerPoint Presentation Inspiration Portrait
This is a continuous growth curve chart ppt powerpoint presentation inspiration portrait. This is a six stage process. The stages in this process are circular, continuity, continuum.
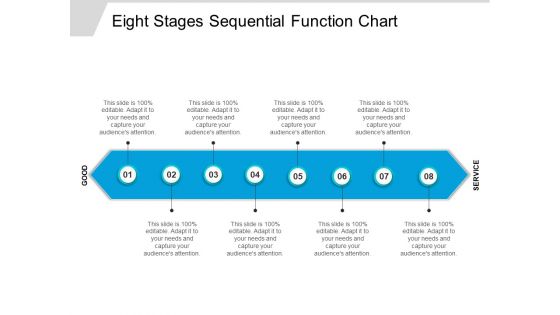
Eight Stages Sequential Function Chart Ppt PowerPoint Presentation Professional Maker
This is a eight stages sequential function chart ppt powerpoint presentation professional maker. This is a eight stage process. The stages in this process are circular, continuity, continuum.
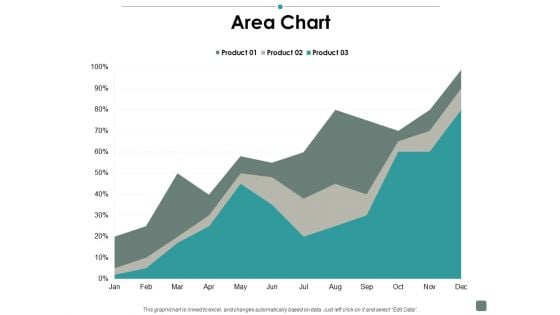
Area Chart Contribution Ppt PowerPoint Presentation Gallery Structure
This is a area chart contribution ppt powerpoint presentation gallery structure. This is a three stage process. The stages in this process are business, management, strategy, analysis, marketing.
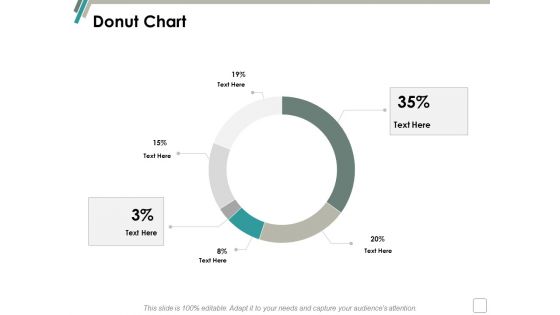
Donut Chart Management Ppt Powerpoint Presentation Slides Aids
This is a donut chart management ppt powerpoint presentation slides aids. This is a six stage process. The stages in this process are finance, marketing, management, investment, analysis.
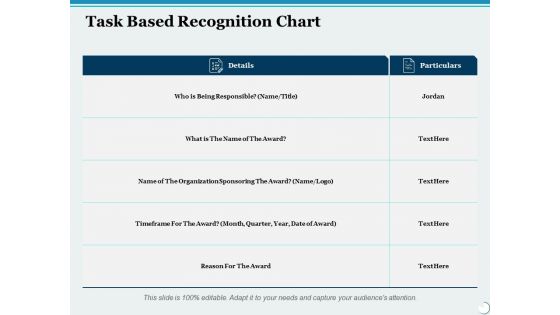
Task Based Recognition Chart Ppt PowerPoint Presentation Inspiration Outline
This is a task based recognition chart ppt powerpoint presentation inspiration outline. This is a two stage process. The stages in this process are compare, management, marketing, business.
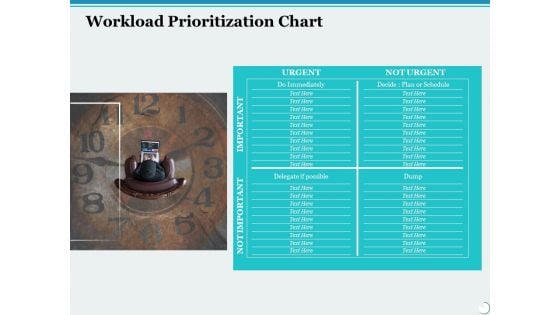
Workload Prioritization Chart Ppt PowerPoint Presentation Infographic Template Images
This is a workload prioritization chart ppt powerpoint presentation infographic template images. This is a four stage process. The stages in this process are business, management, marketing.
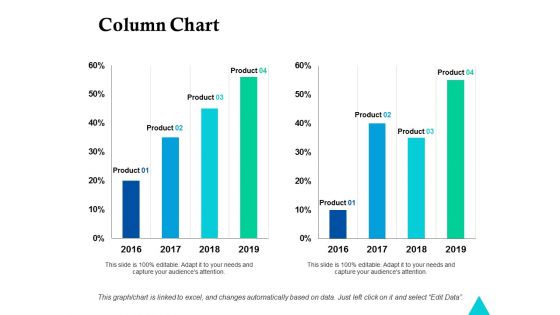
Column Chart Finance Ppt Powerpoint Presentation Summary Visuals
This is a column chart finance ppt powerpoint presentation summary visuals. This is a four stage process. The stages in this process are finance, marketing, management, investment, analysis.

area chart finance ppt powerpoint presentation layouts ideas
This is a area chart finance ppt powerpoint presentation layouts ideas. This is a three stage process. The stages in this process are finance, marketing, management, investment, analysis.
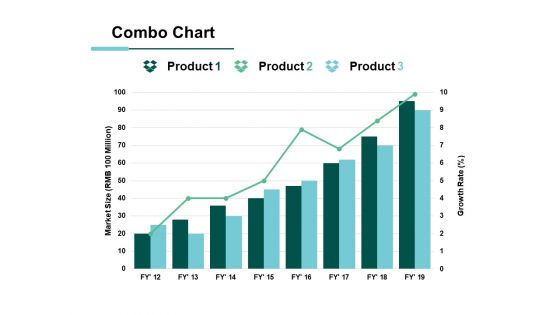
Combo Chart Product Ppt PowerPoint Presentation Ideas Styles
This is a combo chart product ppt powerpoint presentation ideas styles. This is a three stage process. The stages in this process are business, management, marketing, percentage, product.
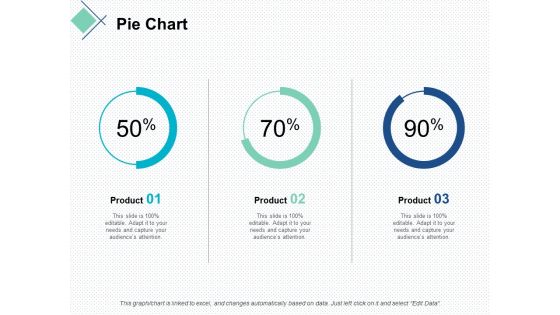
pie chart finance marketing ppt powerpoint presentation slides demonstration
This is a pie chart finance marketing ppt powerpoint presentation slides demonstration. This is a stage process. The stages in this process are finance, marketing, management, investment, analysis.
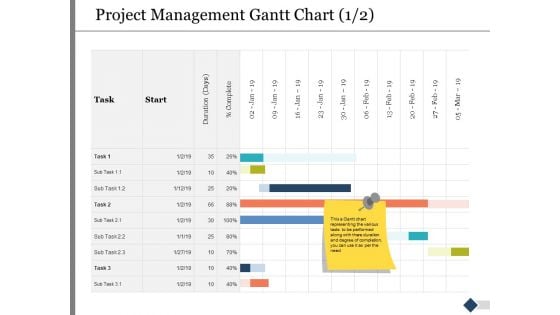
Project Management Gantt Chart Ppt PowerPoint Presentation Summary Images
This is a project management gantt chart ppt powerpoint presentation summary images. This is a two stage process. The stages in this process are marketing, business, management, compare.
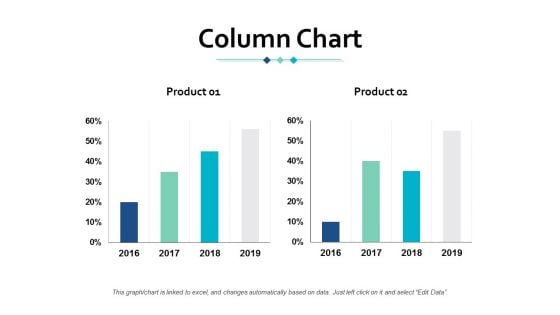
Column Chart Finance Ppt Powerpoint Presentation Gallery Maker
This is a column chart finance ppt powerpoint presentation gallery maker. This is a two stage process. The stages in this process are finance, marketing, management, investment, analysis.
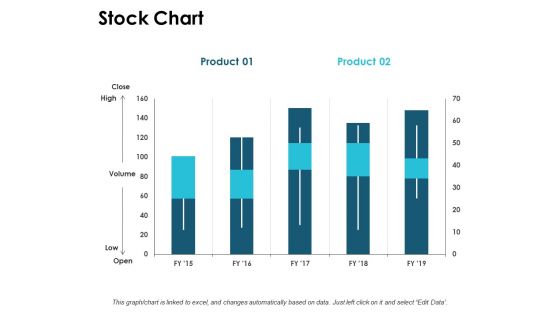
Stock Chart Graph Ppt PowerPoint Presentation Ideas Demonstration
This is a stock chart graph ppt powerpoint presentation ideas demonstration. This is a three stage process. The stages in this process are finance, marketing, management, investment, analysis.
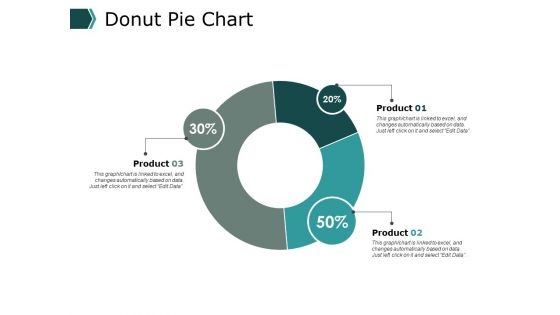
Donut Pie Chart Ppt PowerPoint Presentation Model Deck
This is a donut pie chart ppt powerpoint presentation model deck. This is a three stage process. The stages in this process are finance, marketing, management, investment, analysis.

Stacked Column Chart Ppt PowerPoint Presentation Professional Show
This is a stacked column chart ppt powerpoint presentation professional show. This is a three stage process. The stages in this process are business, management, marketing, growth.
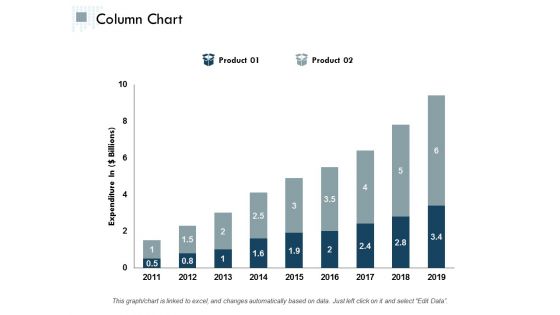
Column Chart Finance Ppt Powerpoint Presentation Styles Examples
This is a column chart finance ppt powerpoint presentation styles examples. This is a two stage process. The stages in this process are finance, marketing, management, investment, analysis.
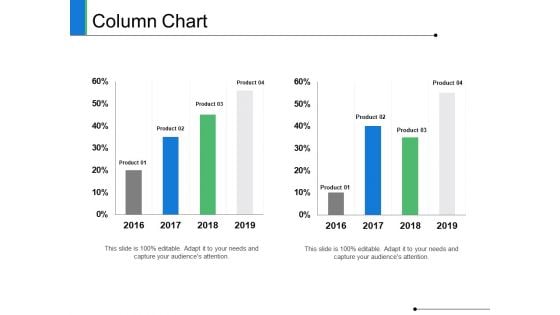
Column Chart Finance Ppt PowerPoint Presentation Summary Grid
This is a column chart finance ppt powerpoint presentation summary grid. This is a three stage process. The stages in this process are finance, marketing, management, investment, analysis.
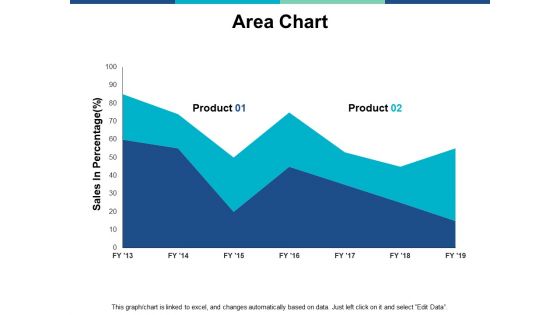
Area Chart Finance Ppt PowerPoint Presentation Summary Structure
This is a area chart finance ppt powerpoint presentation summary structure. This is a two stage process. The stages in this process are finance, marketing, management, investment, analysis.
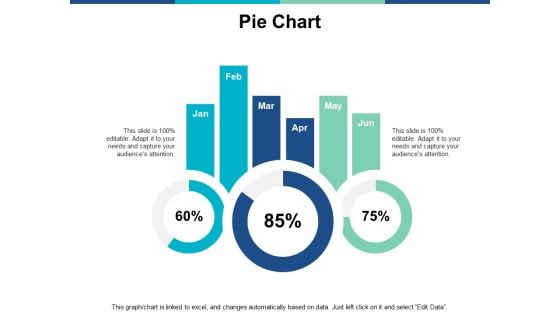
Pie Chart Finance Ppt PowerPoint Presentation Ideas Templates
This is a pie chart finance ppt powerpoint presentation ideas templates. This is a three stage process. The stages in this process are finance, marketing, management, investment, analysis.
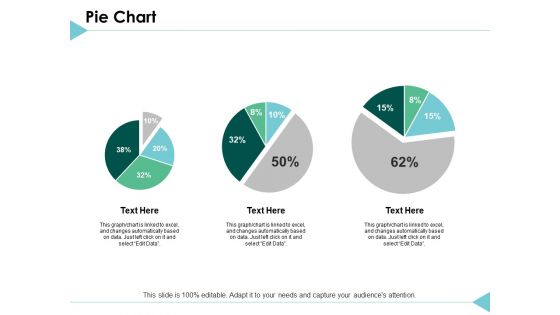
Pie Chart Finance Ppt PowerPoint Presentation Styles Templates
This is a pie chart finance ppt powerpoint presentation styles templates. This is a three stage process. The stages in this process are finance, marketing, analysis, investment, million.
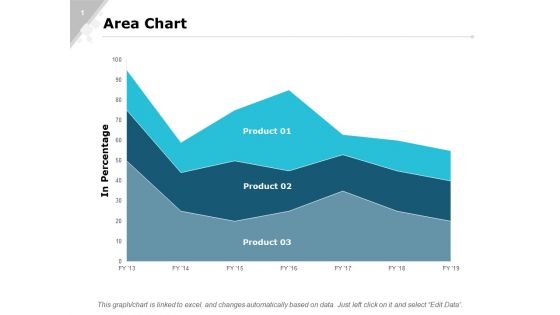
Area Chart Finance Ppt PowerPoint Presentation Outline Structure
This is a area chart finance ppt powerpoint presentation outline structure. This is a three stage process. The stages in this process are finance, marketing, analysis, investment, million.
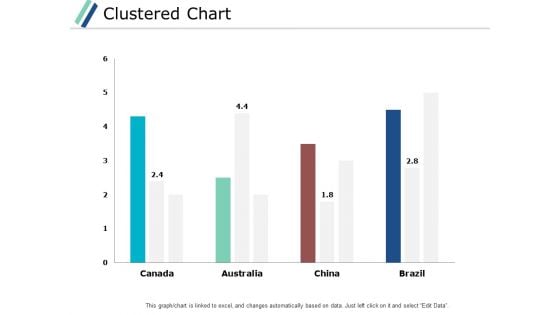
Clustered Chart Graph Ppt PowerPoint Presentation Gallery Backgrounds
This is a clustered chart graph ppt powerpoint presentation gallery backgrounds. This is a three stage process. The stages in this process are finance, marketing, analysis, investment, million.
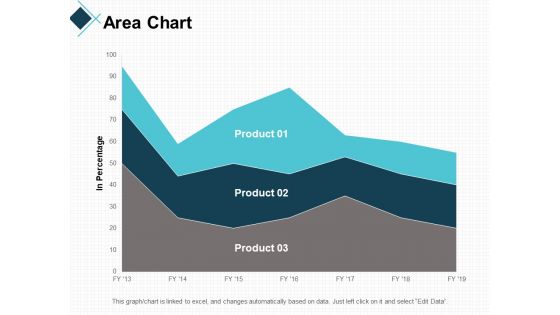
Area Chart Finance Ppt PowerPoint Presentation Gallery Information
This is a area chart finance ppt powerpoint presentation gallery information. This is a three stage process. The stages in this process are finance, marketing, analysis, investment, million.
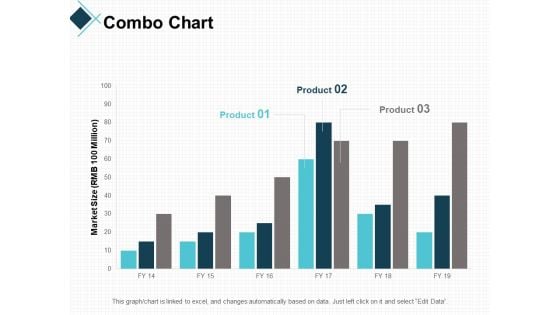
Combo Chart Graph Ppt PowerPoint Presentation Professional Guidelines
This is a combo chart graph ppt powerpoint presentation professional guidelines. This is a three stage process. The stages in this process are finance, marketing, analysis, investment, million.
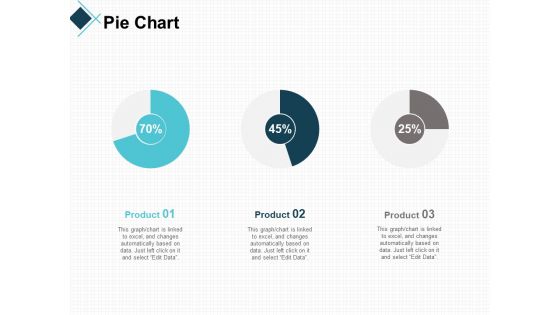
Pie Chart Bar Ppt PowerPoint Presentation Layouts Examples
This is a pie chart bar ppt powerpoint presentation layouts examples. This is a three stage process. The stages in this process are finance, marketing, analysis, investment, million.
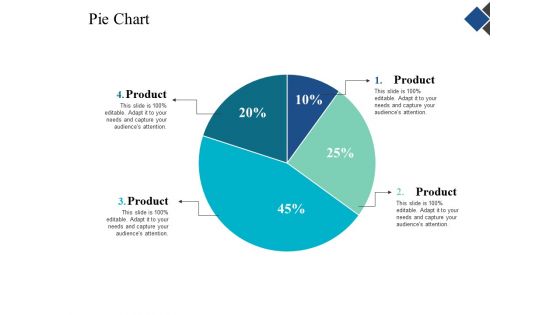
Pie Chart Finance Ppt Powerpoint Presentation Gallery Templates
This is a pie chart finance ppt powerpoint presentation gallery templates. This is a four stage process. The stages in this process are finance, marketing, management, investment, analysis.
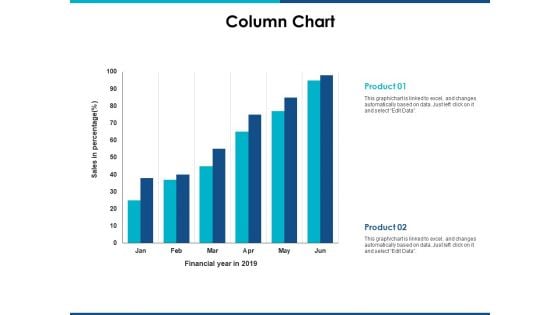
Column Chart Finance Ppt Powerpoint Presentation Inspiration Images
This is a column chart finance ppt powerpoint presentation inspiration images. This is a two stage process. The stages in this process are finance, marketing, management, investment, analysis.
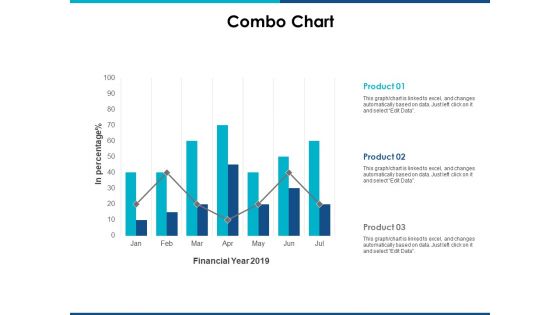
Combo Chart Finance Ppt Powerpoint Presentation Ideas Slides
This is a combo chart finance ppt powerpoint presentation ideas slides. This is a three stage process. The stages in this process are finance, marketing, management, investment, analysis.
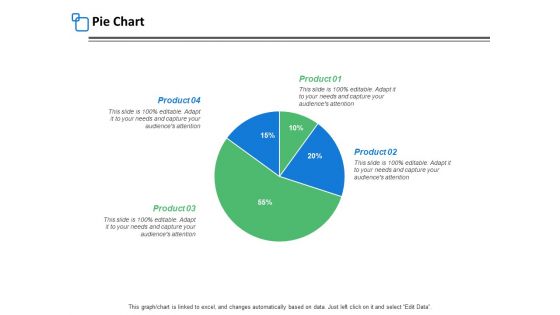
Pie Chart Finance Ppt PowerPoint Presentation Inspiration Templates
This is a pie chart finance ppt powerpoint presentation inspiration templates. This is a four stage process. The stages in this process are finance, marketing, management, investment, analysis.
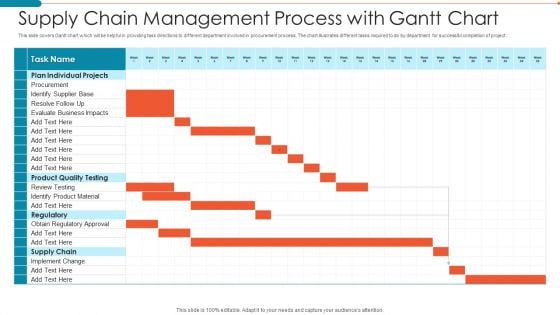
Supply Chain Management Process With Gantt Chart Ideas PDF
This slide covers Gantt chart which will be helpful in providing task directions to different department involved in procurement process. The chart illustrates different tasks required to do by department for successful completion of project.Showcasing this set of slides titled Supply Chain Management Process With Gantt Chart Ideas PDF. The topics addressed in these templates are Supply Chain Management Process With Gantt Chart. All the content presented in this PPT design is completely editable. Download it and make adjustments in color, background, font etc. as per your unique business setting.
Half Yearly Gantt Chart Icon With Arrow Structure PDF
Showcasing this set of slides titled Half Yearly Gantt Chart Icon With Arrow Structure PDF. The topics addressed in these templates are Half Yearly Gantt Chart, Icon With Arrow. All the content presented in this PPT design is completely editable. Download it and make adjustments in color, background, font etc. as per your unique business setting.
Project Management Half Yearly Gantt Chart Icon Formats PDF
Showcasing this set of slides titled Project Management Half Yearly Gantt Chart Icon Formats PDF. The topics addressed in these templates are Yearly Gantt Chart Icon, Project Management Half. All the content presented in this PPT design is completely editable. Download it and make adjustments in color, background, font etc. as per your unique business setting.
Pre And Post Report Analysis Bar Chart Icon Pictures PDF
Showcasing this set of slides titled Pre And Post Report Analysis Bar Chart Icon Pictures PDF. The topics addressed in these templates are Pre And Post Report Analysis, Bar Chart Icon. All the content presented in this PPT design is completely editable. Download it and make adjustments in color, background, font etc. as per your unique business setting.

Five Years Relocation Schema Chart Roadmap For Permanent Residence Graphics
Presenting our innovatively structured five years relocation schema chart roadmap for permanent residence graphics Template. Showcase your roadmap process in different formats like PDF, PNG, and JPG by clicking the download button below. This PPT design is available in both Standard Screen and Widescreen aspect ratios. It can also be easily personalized and presented with modified font size, font type, color, and shapes to measure your progress in a clear way.


 Continue with Email

 Home
Home


