Phase Chart
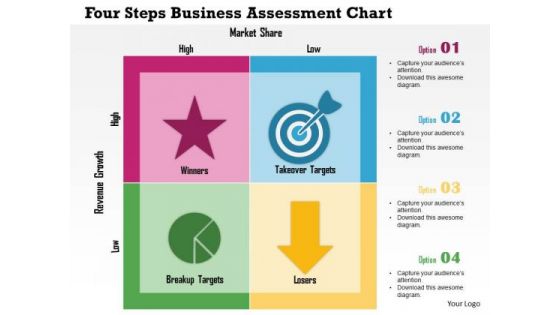
Business Diagram Four Steps Business Assessment Chart Presentation Template
Graphic of four steps assessment chart has been used to design this power point template. This PPT contains the concept of business assessment process. This PPT is suitable for business and marketing related presentations.
Half Yearly Gantt Chart Icon With Calendar Topics PDF
Persuade your audience using this Half Yearly Gantt Chart Icon With Calendar Topics PDF. This PPT design covers four stages, thus making it a great tool to use. It also caters to a variety of topics including Half Yearly Gantt Chart, Icon With Calendar. Download this PPT design now to present a convincing pitch that not only emphasizes the topic but also showcases your presentation skills.
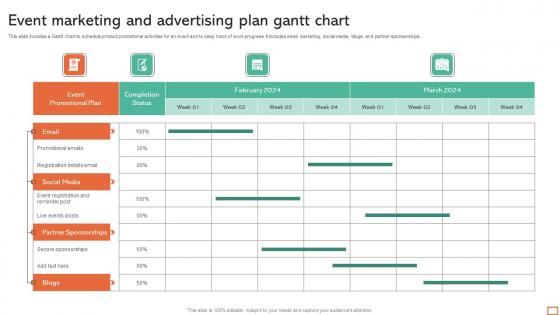
Event Marketing And Advertising Plan Gantt Chart Professional Pdf
This slide includes a Gantt chart to schedule product promotional activities for an event and to keep track of work progress. It includes email marketing, social media, blogs, and partner sponsorships. Pitch your topic with ease and precision using this Event Marketing And Advertising Plan Gantt Chart Professional Pdf. This layout presents information on Social Media, Partner Sponsorships. It is also available for immediate download and adjustment. So, changes can be made in the color, design, graphics or any other component to create a unique layout. This slide includes a Gantt chart to schedule product promotional activities for an event and to keep track of work progress. It includes email marketing, social media, blogs, and partner sponsorships.
Org Chart Beauty Brand Capital Raising Pitch Deck Icons Pdf
This slide shows diagram representing the organizational structure of the company which can be used to understand the positions of key members. Crafting an eye catching presentation has never been more straightforward. Let your presentation shine with this tasteful yet straightforward Org Chart Beauty Brand Capital Raising Pitch Deck Icons Pdf template. It offers a minimalistic and classy look that is great for making a statement. The colors have been employed intelligently to add a bit of playfulness while still remaining professional. Construct the ideal Org Chart Beauty Brand Capital Raising Pitch Deck Icons Pdf that effortlessly grabs the attention of your audience. Begin now and be certain to wow your customers. This slide shows diagram representing the organizational structure of the company which can be used to understand the positions of key members.

PowerPoint Theme Chart World Of Web Ppt Presentation
PowerPoint Theme Chart World Of Web PPT Presentation-These high quality powerpoint pre-designed slides and powerpoint templates have been carefully created by our professional team to help you impress your audience. All slides have been created and are 100% editable in powerpoint. Each and every property of any graphic - color, size, orientation, shading, outline etc. can be modified to help you build an effective powerpoint presentation. Any text can be entered at any point in the powerpoint template or slide. Simply DOWNLOAD, TYPE and PRESENT! Assist them in making the right choice. Open up all the cards with our PowerPoint Theme Chart World Of Web Ppt Presentation.
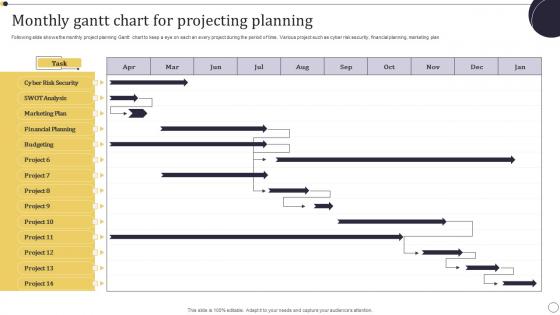
Monthly Gantt Chart For Projecting Planning Information Pdf
Following slide shows the monthly project planning Gantt chart to keep a eye on each an every project during the period of time. Various project such as cyber risk security, financial planning, marketing plan Showcasing this set of slides titled Monthly Gantt Chart For Projecting Planning Information Pdf. The topics addressed in these templates are Marketing Plan, Financial Planning, Cyber Risk Security . All the content presented in this PPT design is completely editable. Download it and make adjustments in color, background, font etc. as per your unique business setting. Following slide shows the monthly project planning Gantt chart to keep a eye on each an every project during the period of time. Various project such as cyber risk security, financial planning, marketing plan
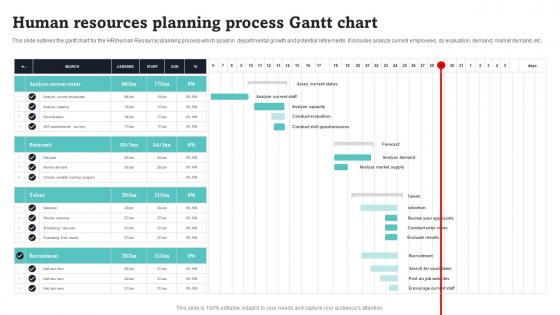
Human Resources Planning Process Gantt Chart Portrait Pdf
This slide outlines the gantt chart for the HRhuman Resource planning process which assist in departmental growth and potential retirements. It includes analyze current employees, do evaluation, demand, market demand, etc. Pitch your topic with ease and precision using this Human Resources Planning Process Gantt Chart Portrait Pdf. This layout presents information on Analyze Current Status, Forecast, Talent. It is also available for immediate download and adjustment. So, changes can be made in the color, design, graphics or any other component to create a unique layout. This slide outlines the gantt chart for the HRhuman Resource planning process which assist in departmental growth and potential retirements. It includes analyze current employees, do evaluation, demand, market demand, etc.
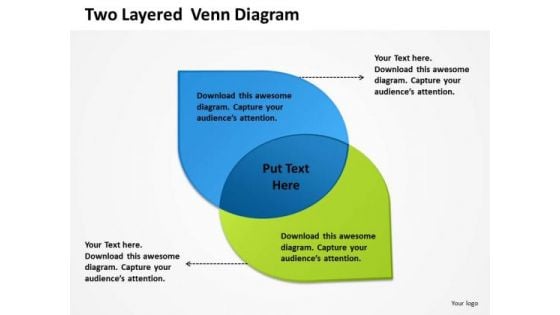
Two Layered Venn Diagram Cycle Chart PowerPoint Slides
We present our two layered venn diagram Cycle Chart PowerPoint Slides.Use our Marketing PowerPoint Templates because Our PowerPoint Templates and Slides will let you Clearly mark the path for others to follow. Present our Business PowerPoint Templates because maximising sales of your product is the intended destination. Use our Shapes PowerPoint Templates because you know what it takes to keep it fit and healthy. Use our Finance PowerPoint Templates because you envisage some areas of difficulty in the near future. The overall financial situation could be a source of worry. Download our Symbol PowerPoint Templates because this helps you to put all your brilliant views to your audience.Use these PowerPoint slides for presentations relating to Background, Black, Blue, Business, Chart, Circle, Diagram, Drop, Financial, Green, Icon, Isolated, Overlapping, Process, Red, Round, Shadow, Shape, Three, Transparency, Vector, Venn, White. The prominent colors used in the PowerPoint template are Blue, Green, Black. We assure you our two layered venn diagram Cycle Chart PowerPoint Slides are Awesome. Customers tell us our Diagram PowerPoint templates and PPT Slides are Attractive. The feedback we get is that our two layered venn diagram Cycle Chart PowerPoint Slides are Luxuriant. We assure you our Business PowerPoint templates and PPT Slides are Amazing. People tell us our two layered venn diagram Cycle Chart PowerPoint Slides are Excellent. We assure you our Blue PowerPoint templates and PPT Slides are Tasteful. Factor all aspects into the equation. Our Two Layered Venn Diagram Cycle Chart PowerPoint Slides will equate their values.
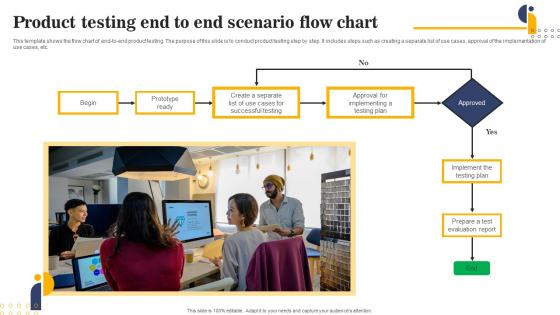
Product Testing End To End Scenario Flow Chart Download Pdf
This template shows the flow chart of end-to-end product testing. The purpose of this slide is to conduct product testing step by step. It includes steps such as creating a separate list of use cases, approval of the implementation of use cases, etc.Pitch your topic with ease and precision using this Product Testing End To End Scenario Flow Chart Download Pdf This layout presents information on Successful Testing, Prototype Ready, Approval Implementing It is also available for immediate download and adjustment. So, changes can be made in the color, design, graphics or any other component to create a unique layout. This template shows the flow chart of end to end product testing. The purpose of this slide is to conduct product testing step by step. It includes steps such as creating a separate list of use cases, approval of the implementation of use cases, etc.
Business Analysis Chart Vector Icon Ppt PowerPoint Presentation Professional Display
This is a business analysis chart vector icon ppt powerpoint presentation professional display. This is a four stage process. The stages in this process are business marketing plan, business marketing strategies, business marketing approach.
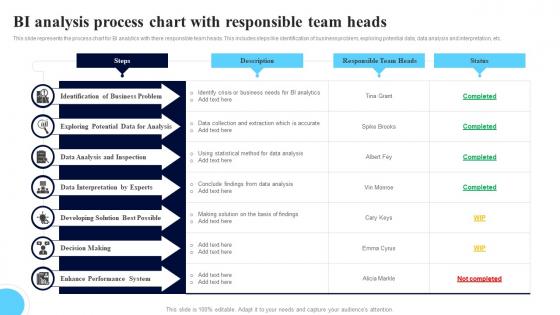
BI Analysis Process Chart With Responsible Team Heads Mockup Pdf
This slide represents the process chart for BI analytics with there responsible team heads. This includes steps like identification of business problem, exploring potential data, data analysis and interpretation, etc. Showcasing this set of slides titled BI Analysis Process Chart With Responsible Team Heads Mockup Pdf. The topics addressed in these templates are Identification Of Business, Data Analysis, Data Interpretation. All the content presented in this PPT design is completely editable. Download it and make adjustments in color, background, font etc. as per your unique business setting. This slide represents the process chart for BI analytics with there responsible team heads. This includes steps like identification of business problem, exploring potential data, data analysis and interpretation, etc.

SAP Implementation Process Gantt Chart Ppt Slides Sample Pdf
This slide represents the timeline or Gantt chart of the SAP implementation process. It further includes various stages of process such as build team and identify business goal, evaluate business process, implement business blueprint, etc. Pitch your topic with ease and precision using this SAP Implementation Process Gantt Chart Ppt Slides Sample Pdf. This layout presents information on Business Goal, Evaluate Business Process, Implement Business Blueprint. It is also available for immediate download and adjustment. So, changes can be made in the color, design, graphics or any other component to create a unique layout. This slide represents the timeline or Gantt chart of the SAP implementation process. It further includes various stages of process such as build team and identify business goal, evaluate business process, implement business blueprint, etc.
Chart Extracellular In Powerpoint And Google Slides Cpb
Introducing our well designed Chart Extracellular In Powerpoint And Google Slides Cpb This PowerPoint design presents information on topics like Chart Extracellular As it is predesigned it helps boost your confidence level. It also makes you a better presenter because of its high quality content and graphics. This PPT layout can be downloaded and used in different formats like PDF, PNG, and JPG. Not only this, it is available in both Standard Screen and Widescreen aspect ratios for your convenience. Therefore, click on the download button now to persuade and impress your audience. Our Chart Extracellular In Powerpoint And Google Slides Cpb are topically designed to provide an attractive backdrop to any subject. Use them to look like a presentation pro.
Levels Chart Examples In Powerpoint And Google Slides Cpb
Introducing our well designed Levels Chart Examples In Powerpoint And Google Slides Cpb This PowerPoint design presents information on topics like Levels Chart Examples As it is predesigned it helps boost your confidence level. It also makes you a better presenter because of its high quality content and graphics. This PPT layout can be downloaded and used in different formats like PDF, PNG, and JPG. Not only this, it is available in both Standard Screen and Widescreen aspect ratios for your convenience. Therefore, click on the download button now to persuade and impress your audience. Our Levels Chart Examples In Powerpoint And Google Slides Cpb are topically designed to provide an attractive backdrop to any subject. Use them to look like a presentation pro.
Function Flow Chart In Powerpoint And Google Slides Cpb
Introducing our well designed Function Flow Chart In Powerpoint And Google Slides Cpb. This PowerPoint design presents information on topics like Function Flow Chart. As it is predesigned it helps boost your confidence level. It also makes you a better presenter because of its high quality content and graphics. This PPT layout can be downloaded and used in different formats like PDF, PNG, and JPG. Not only this, it is available in both Standard Screen and Widescreen aspect ratios for your convenience. Therefore, click on the download button now to persuade and impress your audience. Our Function Flow Chart In Powerpoint And Google Slides Cpb are topically designed to provide an attractive backdrop to any subject. Use them to look like a presentation pro.
Pregnancy Heart Rate Chart In Powerpoint And Google Slides Cpb
Introducing our well designed Pregnancy Heart Rate Chart In Powerpoint And Google Slides Cpb. This PowerPoint design presents information on topics like Pregnancy Heart Rate Chart. As it is predesigned it helps boost your confidence level. It also makes you a better presenter because of its high quality content and graphics. This PPT layout can be downloaded and used in different formats like PDF, PNG, and JPG. Not only this, it is available in both Standard Screen and Widescreen aspect ratios for your convenience. Therefore, click on the download button now to persuade and impress your audience. Our Pregnancy Heart Rate Chart In Powerpoint And Google Slides Cpb are topically designed to provide an attractive backdrop to any subject. Use them to look like a presentation pro.
Triptans Comparison Chart In Powerpoint And Google Slides Cpb
Presenting our innovatively designed set of slides titled Triptans Comparison Chart In Powerpoint And Google Slides Cpb This completely editable PowerPoint graphic exhibits Triptans Comparison Chart that will help you convey the message impactfully. It can be accessed with Google Slides and is available in both standard screen and widescreen aspect ratios. Apart from this, you can download this well structured PowerPoint template design in different formats like PDF, JPG, and PNG. So, click the download button now to gain full access to this PPT design. Our Triptans Comparison Chart In Powerpoint And Google Slides Cpb are topically designed to provide an attractive backdrop to any subject. Use them to look like a presentation pro.
Foods Chart In Powerpoint And Google Slides Cpb
Introducing our well designed Foods Chart In Powerpoint And Google Slides Cpb. This PowerPoint design presents information on topics like Foods Chart. As it is predesigned it helps boost your confidence level. It also makes you a better presenter because of its high-quality content and graphics. This PPT layout can be downloaded and used in different formats like PDF, PNG, and JPG. Not only this, it is available in both Standard Screen and Widescreen aspect ratios for your convenience. Therefore, click on the download button now to persuade and impress your audience. Our Foods Chart In Powerpoint And Google Slides Cpb are topically designed to provide an attractive backdrop to any subject. Use them to look like a presentation pro.
Sound Quality Chart In Powerpoint And Google Slides Cpb
Presenting our innovatively designed set of slides titled Sound Quality Chart In Powerpoint And Google Slides Cpb. This completely editable PowerPoint graphic exhibits Sound Quality Chart that will help you convey the message impactfully. It can be accessed with Google Slides and is available in both standard screen and widescreen aspect ratios. Apart from this, you can download this well structured PowerPoint template design in different formats like PDF, JPG, and PNG. So, click the download button now to gain full access to this PPT design. Our Sound Quality Chart In Powerpoint And Google Slides Cpb are topically designed to provide an attractive backdrop to any subject. Use them to look like a presentation pro.
Gantt Chart Multiple Projects In Powerpoint And Google Slides Cpb
Introducing our well designed Gantt Chart Multiple Projects In Powerpoint And Google Slides Cpb. This PowerPoint design presents information on topics like Gantt Chart Multiple Projects. As it is predesigned it helps boost your confidence level. It also makes you a better presenter because of its high quality content and graphics. This PPT layout can be downloaded and used in different formats like PDF, PNG, and JPG. Not only this, it is available in both Standard Screen and Widescreen aspect ratios for your convenience. Therefore, click on the download button now to persuade and impress your audience. Our Gantt Chart Multiple Projects In Powerpoint And Google Slides Cpb are topically designed to provide an attractive backdrop to any subject. Use them to look like a presentation pro.
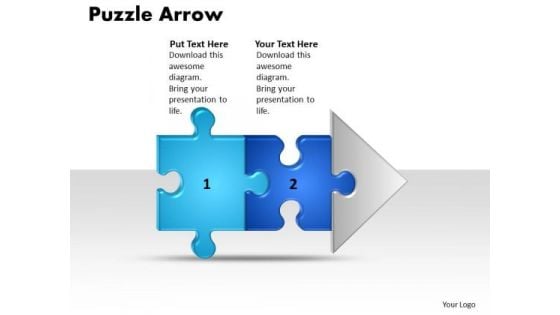
Ppt Linear Work Flow Chart PowerPoint 2 Stages Style1 Templates
PPT linear work flow chart powerpoint 2 stages style1 Templates-This PowerPoint puzzle diagram template is used to show interrelated ideas or concepts. This diagram is useful in just about any type of presentation-PPT linear work flow chart powerpoint 2 stages style1 Templates-Amusement, Arrow, Board, Cardboard, Children, Deficient, Direction, Diversion, Entertainment, Game, Illustration, Image, Jigsaw, Logo, Lots, Many, Paper, Perspective, Pieces, Play, Puzzle, Vector Design goals with our Ppt Linear Work Flow Chart PowerPoint 2 Stages Style1 Templates. Download without worries with our money back guaranteee.
Project Management Gantt Chart Ppt PowerPoint Presentation Icon Example
This is a project management gantt chart ppt powerpoint presentation icon example. This is a ten stage process. The stages in this process are lists, table, data, management, marketing.
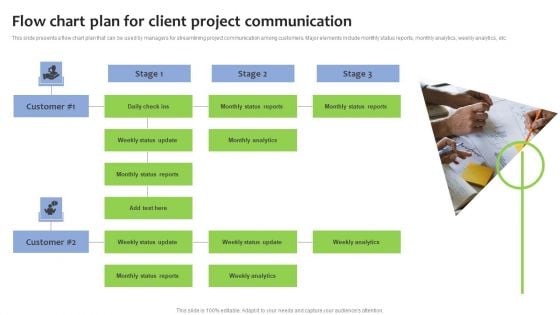
Flow Chart Plan For Client Project Communication Download PDF
This slide presents a flow chart plan that can be used by managers for streamlining project communication among customers. Major elements include monthly status reports, monthly analytics, weekly analytics, etc. Presenting Flow Chart Plan For Client Project Communication Download PDF to dispense important information. This template comprises one stages. It also presents valuable insights into the topics including Flow Chart Plan, Client Project Communication. This is a completely customizable PowerPoint theme that can be put to use immediately. So, download it and address the topic impactfully.
Pie Chart With Food And Health Icons Powerpoint Template
Our above business slide contains pie chart with food and health icons. This PowerPoint slide may be used to exhibit healthy diet plan. Capture the attention of your audience with this slide.
Donut Pie Chart Ppt PowerPoint Presentation Icon Background Images
This is a donut pie chart ppt powerpoint presentation icon background images. This is a four stage process. The stages in this process are donut, process, planning, percentage, finance.
High Low Close Chart Ppt PowerPoint Presentation Icon Background Images
This is a high low close chart ppt powerpoint presentation icon background images. This is a ten stage process. The stages in this process are finance, analysis, planning, business, process.
Business Development Process Flow Chart Ppt PowerPoint Presentation Icon Show
This is a business development process flow chart ppt powerpoint presentation icon show. This is a three stage process. The stages in this process are operational excellence, operational plan, operational process.
Pie Chart With Icons For Business Analysis Powerpoint Slides
This dashboard template contains graphics of pie chart with icons. This dashboard PowerPoint template helps to display business analysis in a visual manner. Download this template to make impressive presentations.
Circular Chart With Icons For Value Chain Powerpoint Template
This PowerPoint template has been designed with circular chart and icons. This professional PPT slide is suitable to present value chain analysis. Capture the attention of your audience using this professional slide.
Sequential Chart With Financial Management Icons Powerpoint Template
This PowerPoint template has been designed with sequential chart with icons. This business slide may be used to display financial management steps. Present your views and ideas with this impressive design.
Pie Chart With Seven Business Icons Powerpoint Templates
Our compelling template consists with a design of pie chart with seven business icons. This slide has been professionally designed to exhibit financial ratio analysis. This template offers an excellent background to build impressive presentation.
Mountain Chart With Social Media Icons Powerpoint Slides
The above PPT template displays mountain chart with social media icons. This PowerPoint template has been designed to exhibit users of social media. Download this PPT slide to attract the attention of your audience.
Six Steps Spiral Chart With Business Icons Powerpoint Template
This PPT slide has been designed with graphics of six steps spiral chart with icons. This PowerPoint template is suitable to display business strategies and ideas. This professional slide helps in making an instant impact on viewers.
Five Circles Sequential Chart With Icons Powerpoint Slides
This PowerPoint template contains sequential chart of five circles with icons. You may download this PPT slide to depict corporate vision, mission and strategy analysis. Add this slide to your presentation and impress your superiors.
Market Trends Chart With Percentage And Icons Powerpoint Slides
This PowerPoint template has been designed with graphics of chart with percentage values and icons. This PowerPoint template may be used to market trends and financial analysis. Prove the viability of your ideas using this impressive slide.
Six Steps Circular Chart With Icons Powerpoint Slides
This PowerPoint template has been designed with six steps circular chart with icons. This PPT slide may be used to display business and management functions. Download this slide to build unique presentation.
Cost Benefit Analysis Chart With Icons Powerpoint Layout
This is a cost benefit analysis chart with icons powerpoint layout. This is a two stage process. The stages in this process are balance scale, compare, business, marketing, management.
Project Charter Linear Chart With Icons Powerpoint Slide Background
This is a project charter linear chart with icons powerpoint slide background. This is a five stage process. The stages in this process are resources team roles, project milestone, project scope, problem statement goal statement, business case.
Donut Pie Chart Ppt PowerPoint Presentation Icon Slide Portrait
This is a donut pie chart ppt powerpoint presentation icon slide portrait. This is a five stage process. The stages in this process are product, percentage, finance, donut, business.
Combo Chart Ppt PowerPoint Presentation Icon Design Templates
This is a combo chart ppt powerpoint presentation icon design templates. This is a three stage process. The stages in this process are market size, growth rate, product, business, success.
Scatter Bubble Chart Ppt PowerPoint Presentation Icon Elements
This is a scatter bubble chart ppt powerpoint presentation icon elements. This is a six stage process. The stages in this process are highest profit, profit, financial year, product.
Scatter Line Chart Ppt PowerPoint Presentation Icon Files
This is a scatter line chart ppt powerpoint presentation icon files. This is a one stage process. The stages in this process are dollar in millions, product, sales in percentage.
Management Organizational Chart Ppt PowerPoint Presentation Portfolio Icon
This is a management organizational chart ppt powerpoint presentation portfolio icon. This is a three stage process. The stages in this process are tony williams, bill durbin, david johnson, robert fowler, kate jeter.
Management Organizational Chart Ppt PowerPoint Presentation Icon Background Images
This is a management organizational chart ppt powerpoint presentation icon background images. This is a three stage process. The stages in this process are marketing communication manager, marketing director, employee, bill durbin, robert fowler.
Clustered Bar Chart Finance Ppt PowerPoint Presentation Icon Tips
This is a clustered bar chart finance ppt powerpoint presentation icon tips. This is a two stage process. The stages in this process are analysis, finance, marketing, management, investment.
Bubble Chart Employee Value Proposition Ppt PowerPoint Presentation Icon Sample
This is a bubble chart employee value proposition ppt powerpoint presentation icon sample. This is a two stage process. The stages in this process are business, management, strategy, analysis, marketing.
Five Steps Chart With Icons Ppt PowerPoint Presentation Infographics Guidelines
This is a five steps chart with icons ppt powerpoint presentation infographics guidelines. This is a five stage process. The stages in this process are boxes and arrows, cartoon and arrows, text boxes with arrows.
Combo Chart Marketing Analysis Ppt Powerpoint Presentation Pictures Icons
This is a combo chart marketing analysis ppt powerpoint presentation pictures icons. This is a three stage process. The stages in this process are finance, marketing, management, investment, analysis.
Growth Arrow Chart Vector Icon Ppt PowerPoint Presentation Slides Mockup
This is a growth arrow chart vector icon ppt powerpoint presentation slides mockup. This is a three stage process. The stages in this process are rising arrow, growing arrow, increasing arrow.
Clustered Bar Chart Finance Ppt Powerpoint Presentation Icon Graphics Template
This is a clustered bar chart finance ppt powerpoint presentation icon graphics template. This is a four stage process. The stages in this process are finance, marketing, management, investment, analysis.
Icon Of Performance Based Incentive In Programs Chart Sample PDF
Persuade your audience using this Icon Of Performance Based Incentive In Programs Chart Sample PDF. This PPT design covers three stages, thus making it a great tool to use. It also caters to a variety of topics including Icon Of Performance, Based Incentive, Programs Chart. Download this PPT design now to present a convincing pitch that not only emphasizes the topic but also showcases your presentation skills.
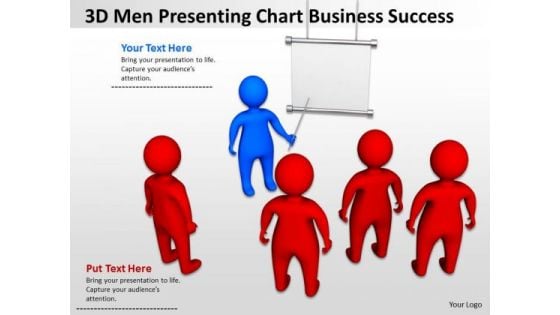
Business Organizational Chart Examples 3d Men Pressenting Success PowerPoint Slides
We present our business organizational chart examples 3d men pressenting success PowerPoint Slides.Present our Communication PowerPoint Templates because Our PowerPoint Templates and Slides ensures Effective communication. They help you put across your views with precision and clarity. Download and present our Business PowerPoint Templates because Our PowerPoint Templates and Slides will let your ideas bloom. Create a bed of roses for your audience. Use our Shapes PowerPoint Templates because Our PowerPoint Templates and Slides will Embellish your thoughts. They will help you illustrate the brilliance of your ideas. Download and present our People PowerPoint Templates because It can Bubble and burst with your ideas. Present our Leadership PowerPoint Templates because Our PowerPoint Templates and Slides will effectively help you save your valuable time. They are readymade to fit into any presentation structure. Use these PowerPoint slides for presentations relating to 3d, Background, Blank, Board, Business, Character, Chart, Communication, Computer, Concept, Consultant, Cooperation, Cute, Dialogue, Discussion, Easel, Empty, Expert, Expertise, Figure, Flipchart, Graphic, Group, Guy, Human, Icon, Idea, Illustration, Leader, Leadership, Manager, Meeting, Men, People, Person, Plan, Pointing, Present, Presentation, Puppet, Speaker, Speech, Teamwork, Whiteboard. The prominent colors used in the PowerPoint template are Red, White, Blue. Presenters tell us our business organizational chart examples 3d men pressenting success PowerPoint Slides are visually appealing. PowerPoint presentation experts tell us our Chart PowerPoint templates and PPT Slides are designed by professionals Professionals tell us our business organizational chart examples 3d men pressenting success PowerPoint Slides will make you look like a winner. People tell us our Chart PowerPoint templates and PPT Slides are designed by a team of presentation professionals. The feedback we get is that our business organizational chart examples 3d men pressenting success PowerPoint Slides are designed by professionals Customers tell us our Chart PowerPoint templates and PPT Slides will get their audience's attention. Correct wrongs with our Business Organizational Chart Examples 3d Men Pressenting Success PowerPoint Slides. Download without worries with our money back guaranteee.
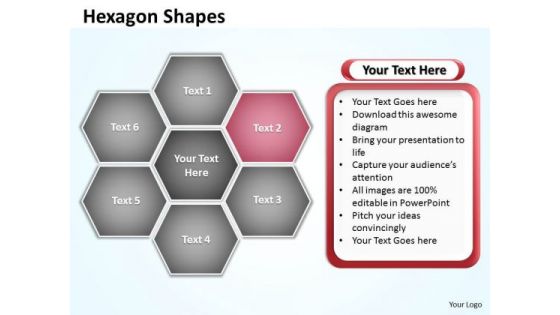
Ppt Hexagon Angles Shaped Chart Editable PowerPoint Templates 2007
PPT hexagon angles shaped chart editable powerpoint templates 2007-Use this Hexagon diagram to explain complex and difficult business strategic planning & staff development. This is an amazing tool to ensure that strategic planning sessions contribute to teambuilding, and are interesting too.-PPT hexagon angles shaped chart editable powerpoint templates 2007-Abstract, Background, Design, Digital, Elements, Graphic, Grey, Hexagon, Illustration, Light, Modern, Perspective, Triangles, Shapes, Shiny, Style, Technology, Template, Vector, Vertical, Virtual, Wallpaper, Web Our Ppt Hexagon Angles Shaped Chart Editable PowerPoint Templates 2007 impress people. With our money back guarantee you have nothing to lose.
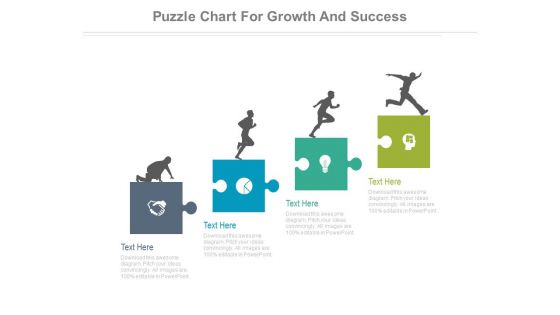
Puzzle Chart For Growth And Success Powerpoint Slides
This business slide has been designed with puzzle chart and icons. This diagram has been designed to display concepts of growth and success. Develop your strategy and communicate with your team with this professional slide design.
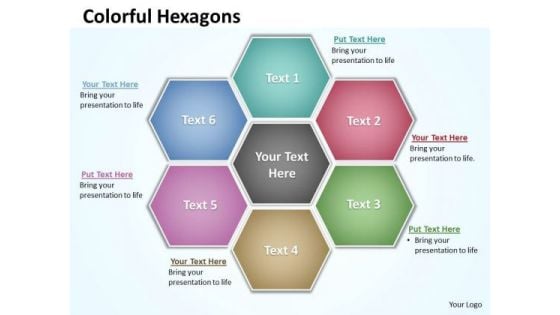
Ppt Hexagon Shapes Chart Presentation PowerPoint Tips Free Download Templates
PPT hexagon shapes chart presentation powerpoint tips free download Templates-This Hexagon diagram is a graphical illustration of the relationships between and among sets of data, groups of objects. . Present your views using this innovative slide and be assured of leaving a lasting impression.-PPT hexagon shapes chart presentation powerpoint tips free download Templates-Abstract, Background, Design, Digital, Elements, Graphic, Grey, Hexagon, Illustration, Light, Modern, Perspective, Triangles, Shapes, Shiny, Style, Technology, Template, Vector, Vertical, Virtual, Wallpaper, Web Experience the aesthetics of our Ppt Hexagon Shapes Chart Presentation PowerPoint Tips Free Download Templates. They are created with brilliant design sense.
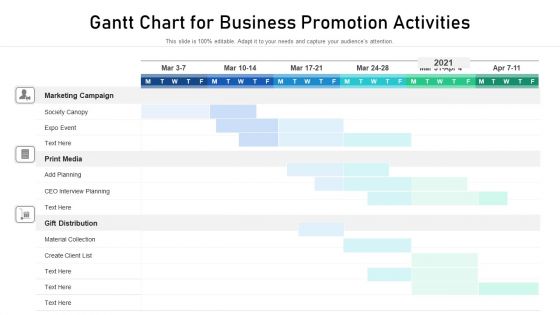
Gantt Chart For Business Promotion Activities Sample PDF
Design a highly optimized project management report using this well-researched gantt chart for business promotion activities sample pdf. This layout can be used to present the professional details of a task or activity. Showcase the activities allocated to the business executives with this Gantt Chart PowerPoint theme. List down the column tasks in various timeframes and allocate time for each. In addition, also monitor the actual time and make comparisons to interpret the final progress using this innovative Gantt Chart Template. Showcase the work breakdown structure to attract your audience. Download and share it using Google Slides, if it suits your requirement.
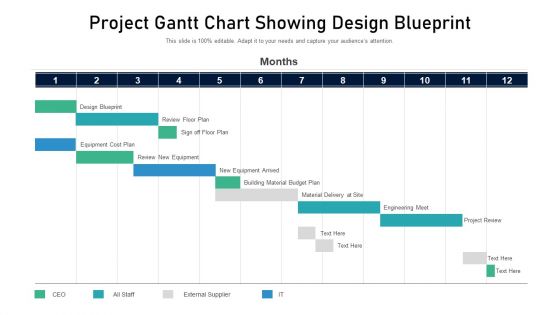
Project Gantt Chart Showing Design Blueprint Rules PDF
Design a highly optimized project management report using this well-researched project gantt chart showing design blueprint rules pdf. This layout can be used to present the professional details of a task or activity. Showcase the activities allocated to the business executives with this Gantt Chart PowerPoint theme. List down the column tasks in various timeframes and allocate time for each. In addition, also monitor the actual time and make comparisons to interpret the final progress using this innovative Gantt Chart Template. Showcase the work breakdown structure to attract your audience. Download and share it using Google Slides, if it suits your requirement.
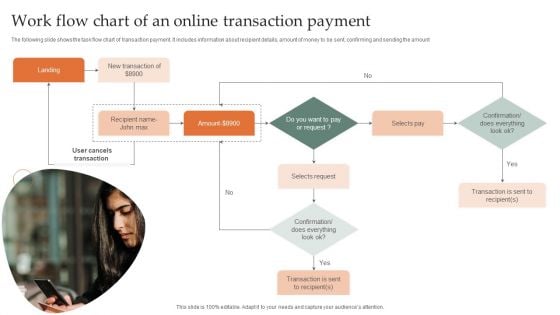
Work Flow Chart Of An Online Transaction Payment Inspiration PDF
The following slide shows the task flow chart of transaction payment. It includes information about recipient details, amount of money to be sent, confirming and sending the amount. Presenting Work Flow Chart Of An Online Transaction Payment Inspiration PDF to dispense important information. This template comprises one stages. It also presents valuable insights into the topics including Work Flow Chart, Online Transaction Payment. This is a completely customizable PowerPoint theme that can be put to use immediately. So, download it and address the topic impactfully.
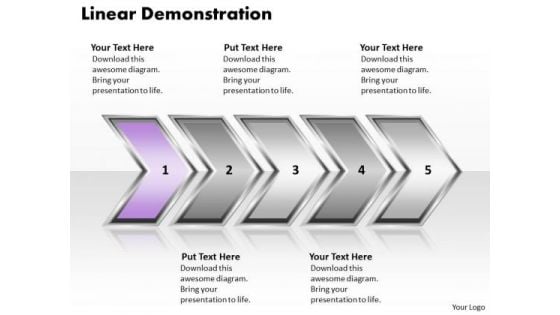
Ppt Linear Demonstration Of Arrows PowerPoint 2010 Org Chart Templates
PPT linear demonstration of arrows powerpoint 2010 org chart Templates-Life and Business is made up of processes comprising stages that flow from one to another. An excellent graphic to attract the attention of and understanding by your audience to improve earnings.-PPT linear demonstration of arrows powerpoint 2010 org chart Templates-Aim, Arrow, Arrowheads, Badge, Border, Click, Connection, Curve, Design, Direction, Download, Element, Fuchsia, Icon, Illustration, Indicator, Internet, Magenta, Mark, Object, Orientation, Pointer, Shadow, Shape, Sign Encourage creativity with our Ppt Linear Demonstration Of Arrows PowerPoint 2010 Org Chart Templates. You will come out on top.
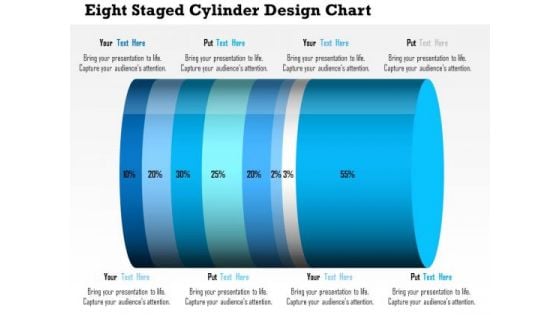
Business Daigram Eight Staged Cylinder Design Chart Presentation Templets
This business diagram contains eight staged cylinder design chart with percentage ratio. Download this diagram to display financial analysis. Use this diagram to make business and marketing related presentations.


 Continue with Email

 Home
Home


