Phase Chart
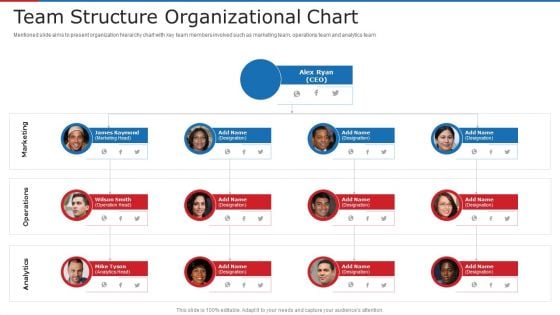
Team Structure Organizational Chart Ppt Infographics Example Introduction PDF
Mentioned slide aims to present organization hierarchy chart with key team members involved such as marketing team, operations team and analytics team. This is a team structure organizational chart ppt infographics example introduction pdf template with various stages. Focus and dispense information on four stages using this creative set, that comes with editable features. It contains large content boxes to add your information on topics like team structure organizational chart. You can also showcase facts, figures, and other relevant content using this PPT layout. Grab it now.
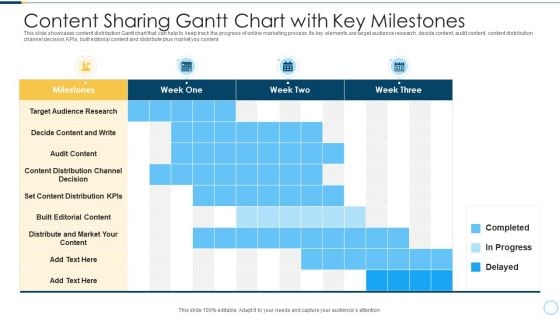
Content Sharing Gantt Chart With Key Milestones Elements PDF
This slide showcases content distribution Gantt chart that can help to keep track the progress of online marketing process. Its key elements are target audience research, decide content, audit content, content distribution channel decision, KPIs, built editorial content and distribute plus market you content Showcasing this set of slides titled content sharing gantt chart with key milestones elements pdf. The topics addressed in these templates are content sharing gantt chart with key milestones. All the content presented in this PPT design is completely editable. Download it and make adjustments in color, background, font etc. as per your unique business setting.

Price Catalogue Chart For Supplier Services Assessment Inspiration PDF
This slide showcases price catalogue chart that can help organization to make comparative assessment of transportation and warehousing costs of different suppliers. It also outlines cost per unit comparison of raw materials of Showcasing this set of slides titled price catalogue chart for supplier services assessment inspiration pdf. The topics addressed in these templates are price catalogue chart for supplier services assessment. All the content presented in this PPT design is completely editable. Download it and make adjustments in color, background, font etc. as per your unique business setting.
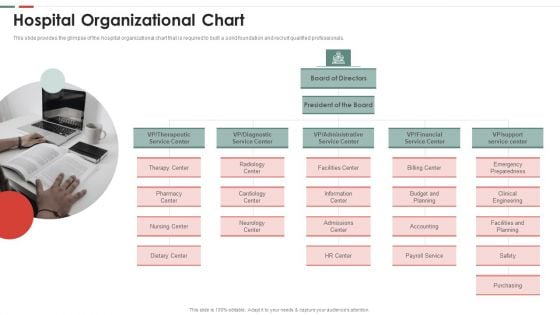
Feasibility Analysis Template Different Projects Hospital Organizational Chart Download PDF
This slide provides the glimpse of the hospital organizational chart that is required to built a solid foundation and recruit qualified professionals. Presenting feasibility analysis template different projects hospital organizational chart download pdf to provide visual cues and insights. Share and navigate important information on one stages that need your due attention. This template can be used to pitch topics like hospital organizational chart. In addtion, this PPT design contains high resolution images, graphics, etc, that are easily editable and available for immediate download.
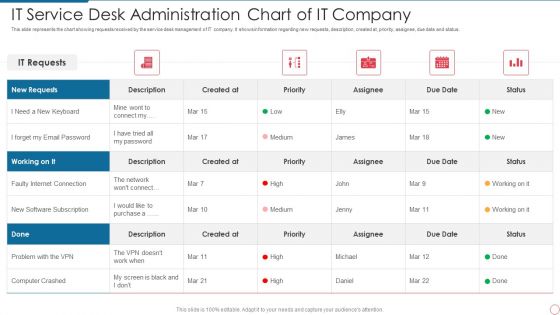
IT Service Desk Administration Chart Of IT Company Infographics PDF
This slide represents the chart showing requests received by the service desk management of IT company. It shows information regarding new requests, description, created at, priority, assignee, due date and status. Showcasing this set of slides titled IT Service Desk Administration Chart Of IT Company Infographics PDF. The topics addressed in these templates are It Service Desk Administration Chart Of It Company. All the content presented in this PPT design is completely editable. Download it and make adjustments in color, background, font etc. as per your unique business setting.
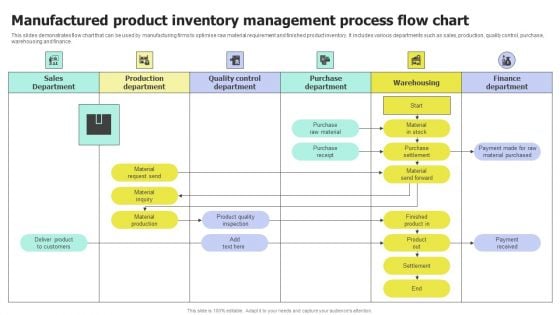
Manufactured Product Inventory Management Process Flow Chart Microsoft PDF
This slide demonstrates flow chart that can be used by manufacturing firms to optimise raw material requirement and finished product inventory. It includes various departments such as sales, production, quality control, purchase, warehousing and finance. Pitch your topic with ease and precision using this Manufactured Product Inventory Management Process Flow Chart Microsoft PDF. This layout presents information on Manufactured Product, Inventory Management, Process Flow Chart. It is also available for immediate download and adjustment. So, changes can be made in the color, design, graphics or any other component to create a unique layout.
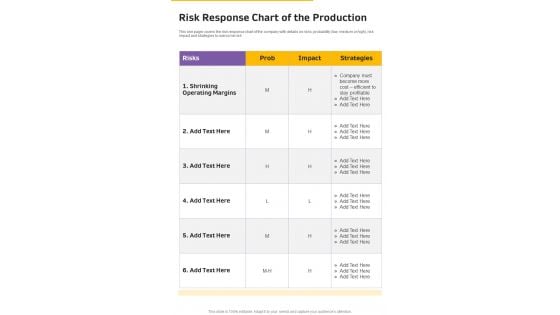
Risk Response Chart Of The Production One Pager Documents
This one pager covers the risk response chart of the company with details on risks, probability low, medium or high, risk impact and strategies to overcome risk. Presenting you a fantastic Risk Response Chart Of The Production One Pager Documents. This piece is crafted on hours of research and professional design efforts to ensure you have the best resource. It is completely editable and its design allow you to rehash its elements to suit your needs. Get this Risk Response Chart Of The Production One Pager Documents A4 One-pager now.
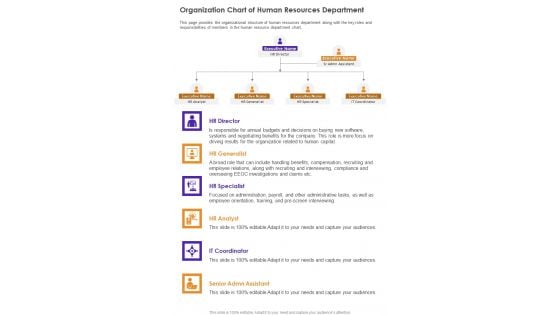
Organization Chart Of Human Resources Department One Pager Documents
This page provides the organizational structure of human resources department along with the key roles and responsibilities of members in the human resource department chart. Presenting you an exemplary Organization Chart Of Human Resources Department One Pager Documents. Our one-pager comprises all the must-have essentials of an inclusive document. You can edit it with ease, as its layout is completely editable. With such freedom, you can tweak its design and other elements to your requirements. Download this Organization Chart Of Human Resources Department One Pager Documents brilliant piece now.

Risk Response Chart Of The Enterprise One Pager Documents
This one pager covers the risk response chart of the company with details on risks, probability low, medium or high, risk impact and strategies to overcome risk. Presenting you a fantastic Risk Response Chart Of The Enterprise One Pager Documents. This piece is crafted on hours of research and professional design efforts to ensure you have the best resource. It is completely editable and its design allow you to rehash its elements to suit your needs. Get this Risk Response Chart Of The Enterprise One Pager Documents A4 One-pager now.
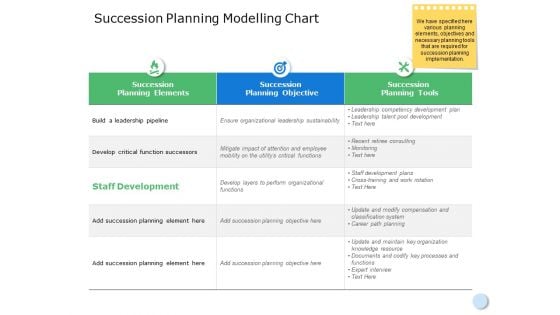
Succession Planning Modelling Chart Ppt Powerpoint Presentation File Professional
This is a succession planning modelling chart ppt powerpoint presentation file professional.The topics discussed in this diagram aresuccession planning elements, compare, planning, business, management. This is a completely editable PowerPoint presentation, and is available for immediate download.
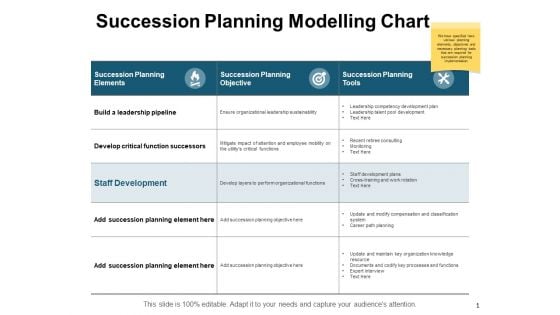
Succession Planning Modelling Chart Ppt PowerPoint Presentation Professional Outline
This is a succession planning modelling chart ppt powerpoint presentation professional outline. The topics discussed in this diagram are marketing, business, management, planning, strategy This is a completely editable PowerPoint presentation, and is available for immediate download.
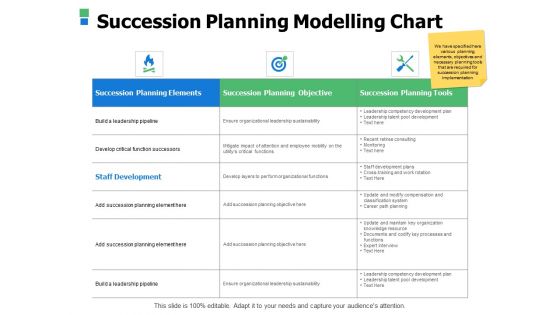
Succession Planning Modelling Chart Ppt Powerpoint Presentation Slides Samples
This is a succession planning modelling chart ppt powerpoint presentation slides samples. The topics discussed in this diagram are business, management, planning, strategy, marketing. This is a completely editable PowerPoint presentation, and is available for immediate download.
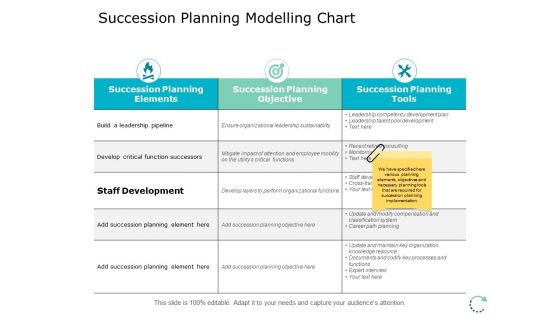
Succession Planning Modelling Chart Ppt PowerPoint Presentation Inspiration Slideshow
This is a succession planning modelling chart ppt powerpoint presentation inspiration slideshow. The topics discussed in this diagram are marketing, business, management, planning, strategy This is a completely editable PowerPoint presentation and is available for immediate download.
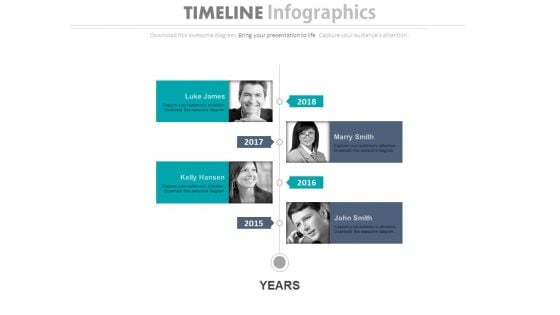
Four Employees Timeline Chart With Years Powerpoint Slides
This PowerPoint template has been designed with graphics of timeline with team pictures. You may download this timeline diagram slide to display team planning and management steps. Chart the course you intend to take with this slide.
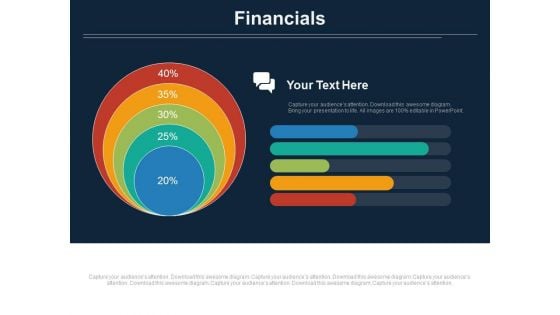
Concentric Chart With Five Financial Steps Powerpoint Slides
This PowerPoint slide contains diagram of concentric chart with five financial steps This professional slide helps to exhibit financial planning for business. Use this PowerPoint template to make impressive presentations.
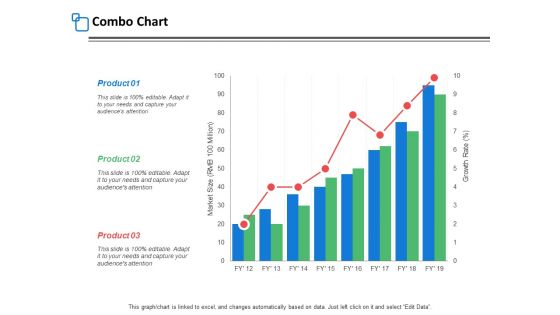
Combo Chart Finance Ppt PowerPoint Presentation Styles Background Image
This is a combo chart finance ppt powerpoint presentation styles background image. The topics discussed in this diagram are marketing, business, management, planning, strategy This is a completely editable PowerPoint presentation, and is available for immediate download
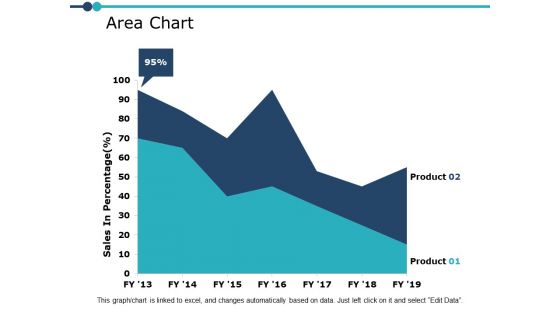
Area Chart Finance Ppt PowerPoint Presentation File Slide
This is a area chart finance ppt powerpoint presentation file slide. The topics discussed in this diagram are marketing, business, management, planning, strategy This is a completely editable PowerPoint presentation, and is available for immediate download.
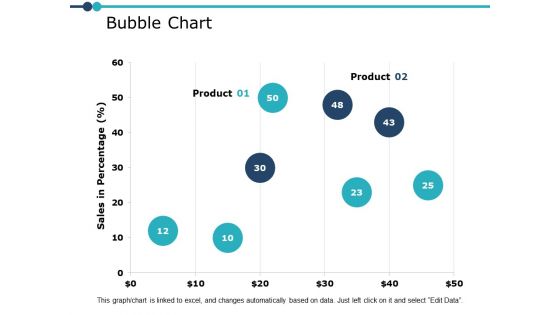
Bubble Chart Graph Ppt PowerPoint Presentation Ideas Outfit
This is a bubble chart graph ppt powerpoint presentation ideas outfit. The topics discussed in this diagram are marketing, business, management, planning, strategy This is a completely editable PowerPoint presentation, and is available for immediate download.
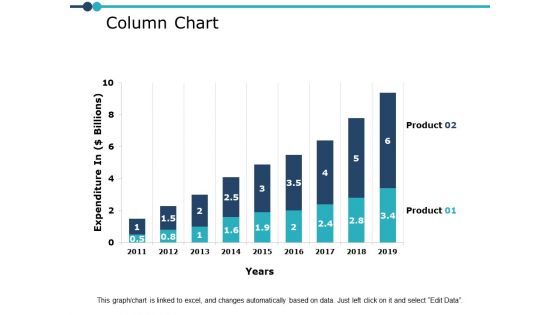
Column Chart Finance Ppt PowerPoint Presentation Show Background
This is a column chart finance ppt powerpoint presentation show background. The topics discussed in this diagram are marketing, business, management, planning, strategy This is a completely editable PowerPoint presentation, and is available for immediate download.
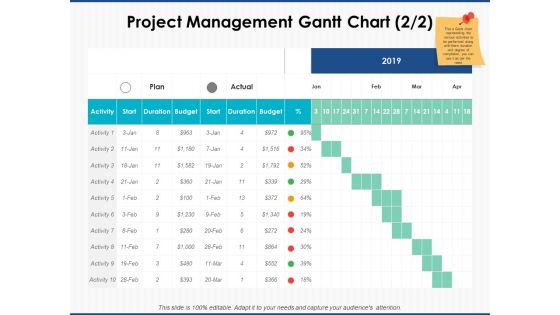
Project Management Gantt Chart Business Ppt PowerPoint Presentation Portfolio Show
This is a project management gantt chart business ppt powerpoint presentation portfolio show. The topics discussed in this diagram are marketing, business, management, planning, strategy This is a completely editable PowerPoint presentation, and is available for immediate download.
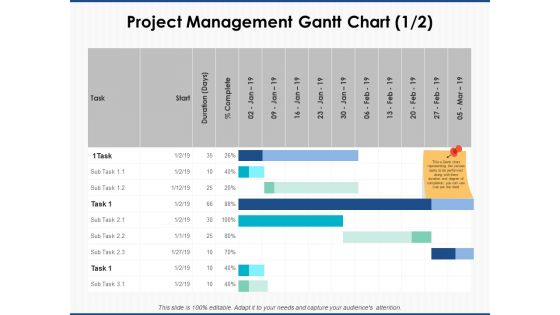
Project Management Gantt Chart Marketing Ppt PowerPoint Presentation Professional Ideas
This is a project management gantt chart marketing ppt powerpoint presentation professional ideas. The topics discussed in this diagram are marketing, business, management, planning, strategy This is a completely editable PowerPoint presentation, and is available for immediate download.
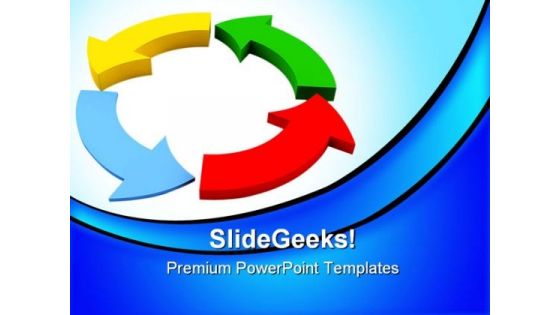
Arrows Chart Business PowerPoint Templates And PowerPoint Backgrounds 0211
Microsoft PowerPoint Template and Background with four colored arrows in a circle like a diagram Arouse the excitement with our Arrows Chart Business PowerPoint Templates And PowerPoint Backgrounds 0211. Stir up the audience with your views.
Organizational Chart Business PowerPoint Templates And PowerPoint Backgrounds 0511
Microsoft PowerPoint Template and Background with blue and orange schematic diagram Cover up minor failings with our Organizational Chart Business PowerPoint Templates And PowerPoint Backgrounds 0511. They always even things out.
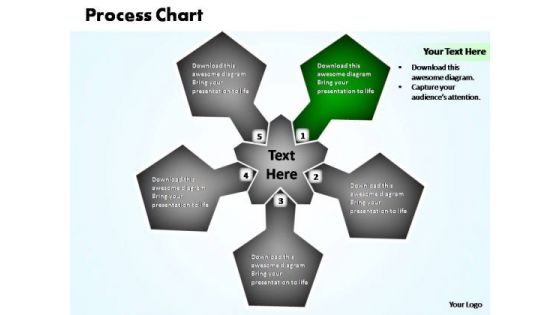
PowerPoint Templates Graphic Business Process Chart Ppt Slides
This easy to use diagrams can be used for information flow, business process automation, business process re-engineering. Audit your thoughts with our PowerPoint Templates Graphic Business Process Chart Ppt Slides. They will authenticate their excellence.
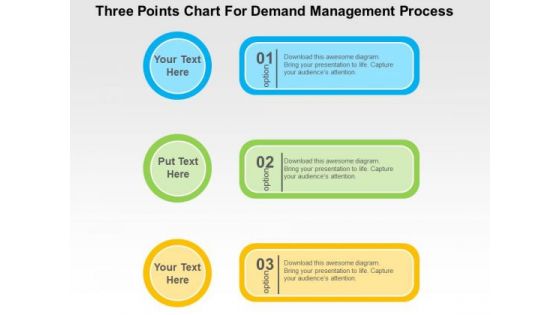
Three Ponits Chart For Demand Management Process PowerPoint Template
Demand management process can be displayed with this business diagram. It contains graphics of chart with three points. Present your views using this innovative slide and be assured of leaving a lasting impression.
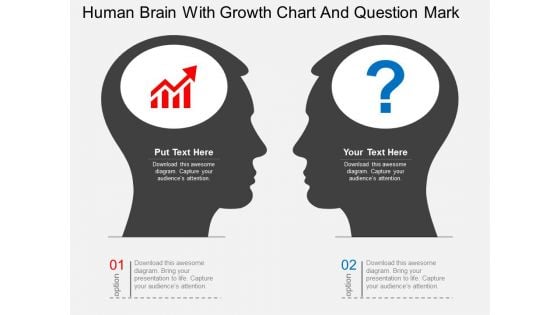
Human Brain With Growth Chart And Question Mark Powerpoint Template
This PowerPoint template has been designed with graphics of human brain with growth chart and question mark. This diagram can be used to display creative thinking in business. Capture the attention of your audience with this slide.
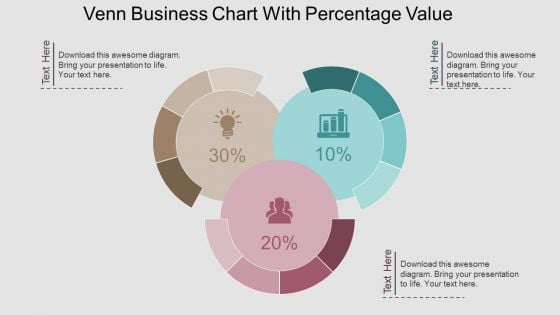
Venn Business Chart With Percentage Value Powerpoint Template
This PPT slide contains Venn business chart with percentage values. This PPT diagram is suitable to present data comparison and analysis. Enlighten others on the process with this innovative PowerPoint template.
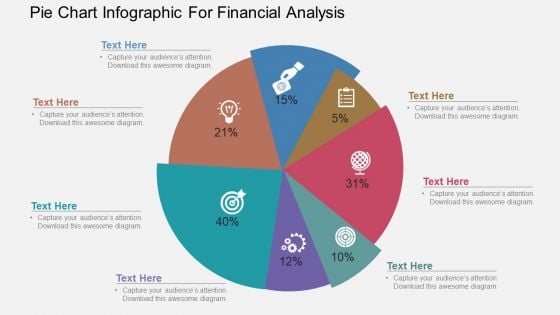
Pie Chart Infographic For Financial Analysis Powerpoint Template
Our above PowerPoint template has been designed with pie chart infographic. This slide is suitable to present financial analysis. Use this business diagram to present your work in a more smart and precise manner.
Money Growth Chart On Laptop With Mouse Powerpoint Template
This business slide displays money growth chart on laptop with mouse. This diagram is a data visualization tool that gives you a simple way to present statistical information. This slide helps your audience examine and interpret the data you present.
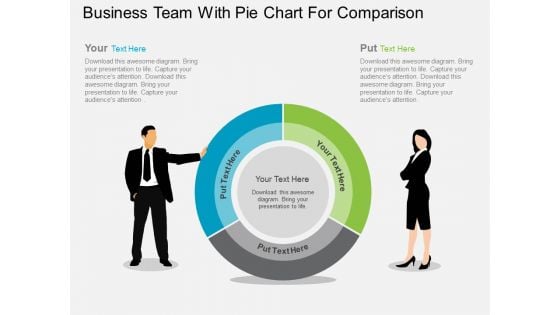
Business Team With Pie Chart For Comparison Powerpoint Template
This business slide contains graphics of pie chart with team members. This PowerPoint template is suitable to present comparison of teams performances. Use this business diagram to present your work in a more smart and precise manner.
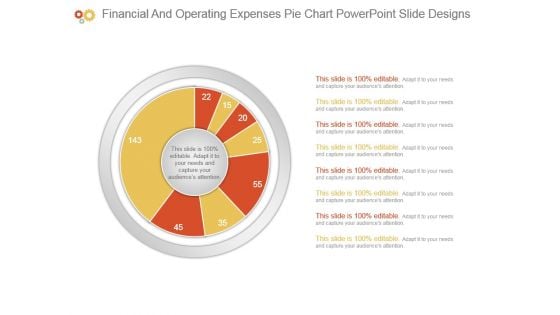
Financial And Operating Expenses Pie Chart Powerpoint Slide Designs
This is a financial and operating expenses pie chart powerpoint slide designs. This is a eight stage process. The stages in this process are business, diagram, marketing, management, presentation.
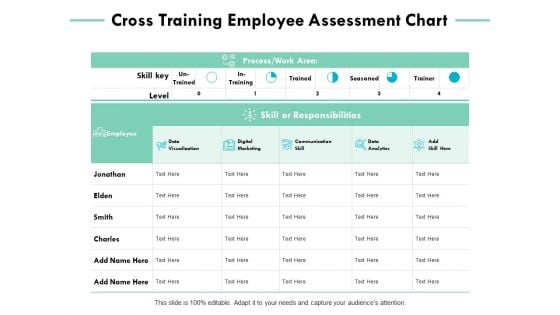
Cross Training Employee Assessment Chart Ppt PowerPoint Presentation Gallery Templates
This is a cross training employee assessment chart ppt powerpoint presentation gallery templates. The topics discussed in this diagram are business, management, compare, marketing. This is a completely editable PowerPoint presentation, and is available for immediate download.

Employee Assessment Review Chart Ppt PowerPoint Presentation Infographics Graphics
This is a employee assessment review chart ppt powerpoint presentation infographics graphics. The topics discussed in this diagram are business, management, marketing. This is a completely editable PowerPoint presentation, and is available for immediate download.
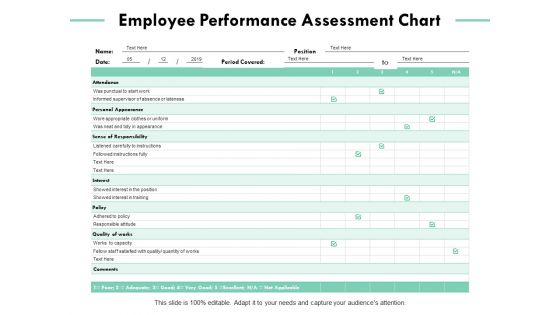
Employee Performance Assessment Chart Ppt PowerPoint Presentation Pictures Structure
This is a employee performance assessment chart ppt powerpoint presentation pictures structure. The topics discussed in this diagram are business, management, marketing, compare. This is a completely editable PowerPoint presentation, and is available for immediate download.
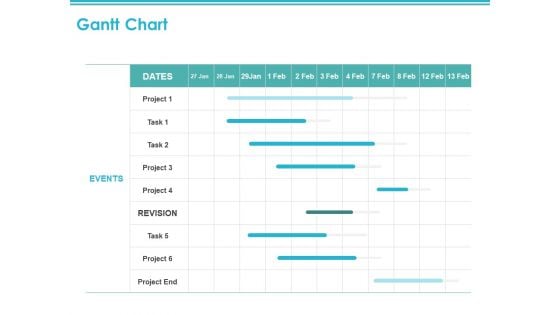
Gantt Chart Events Ppt PowerPoint Presentation Portfolio Graphics
Make a highly optimized project management report using this content-ready Gantt Chart PPT Diagram. Effortless yet very clear, this layout proves a useful tool to present the professional details of a task or activity. Showcase the activities and allotted time to the business executives with this Gantt Chart PowerPoint theme. List down the column tasks in various timeframes and the activities associated with each of them here. Further, plot time allocation for various tasks, monitor their actual time and make comparisons to interpret the final progress with this well-structured Gantt Chart Excel Template. You can add all the significant details of a particular project in this chart and showcase it to all the project members so that they can participate in the overall development. Not only this but also our PPT template can help you showcase the work breakdown structure of your project.
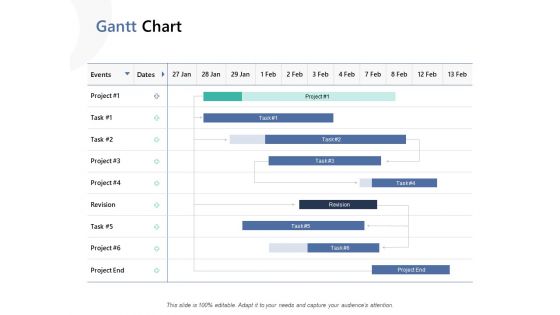
Gantt Chart Ppt PowerPoint Presentation Model Design Inspiration
Make a highly optimized project management report using this content-ready Gantt Chart PPT Diagram. Effortless yet very clear, this layout proves a useful tool to present the professional details of a task or activity. Showcase the activities and allotted time to the business executives with this Gantt Chart PowerPoint theme. List down the column tasks in various timeframes and the activities associated with each of them here. Further, plot time allocation for various tasks, monitor their actual time and make comparisons to interpret the final progress with this well-structured Gantt Chart Excel Template. You can add all the significant details of a particular project in this chart and showcase it to all the project members so that they can participate in the overall development. Not only this but also our PPT template can help you showcase the work breakdown structure of your project.
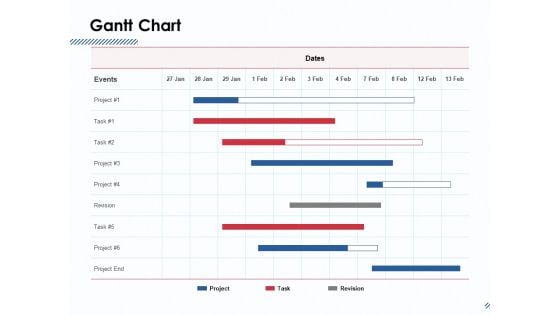
Gantt Chart Ppt PowerPoint Presentation Infographic Template Influencers
Make a highly optimized project management report using this content-ready Gantt Chart PPT Diagram. Effortless yet very clear, this layout proves a useful tool to present the professional details of a task or activity. Showcase the activities and allotted time to the business executives with this Gantt Chart PowerPoint theme. List down the column tasks in various timeframes and the activities associated with each of them here. Further, plot time allocation for various tasks, monitor their actual time and make comparisons to interpret the final progress with this well-structured Gantt Chart Excel Template. You can add all the significant details of a particular project in this chart and showcase it to all the project members so that they can participate in the overall development. Not only this but also our PPT template can help you showcase the work breakdown structure of your project.
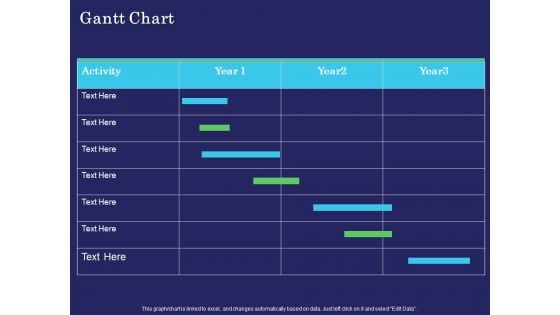
Business Coaching Gantt Chart Ppt PowerPoint Presentation Layouts Files PDF
Make a highly optimized project management report using this content-ready Gantt Chart PPT Diagram. Effortless yet very clear, this layout proves a useful tool to present the professional details of a task or activity. Showcase the activities and allotted time to the business executives with this Gantt Chart PowerPoint theme. List down the column tasks in various timeframes and the activities associated with each of them here. Further, plot time allocation for various tasks, monitor their actual time and make comparisons to interpret the final progress with this well-structured Gantt Chart Excel Template. You can add all the significant details of a particular project in this chart and showcase it to all the project members so that they can participate in the overall development. Not only this but also our PPT template can help you showcase the work breakdown structure of your project.
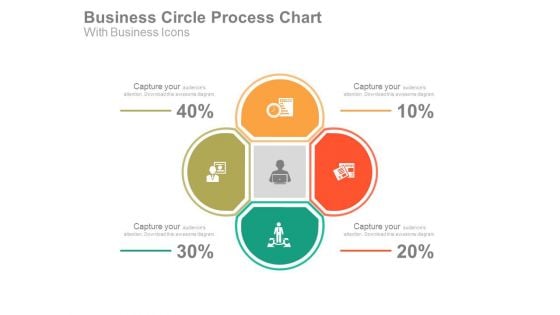
Circle Chart For Business Strategy Plan Powerpoint Slides
This PowerPoint template has been designed with four steps circle chart with finance icons. This PPT slide can be used to display business strategy plan. You can download finance PowerPoint template to prepare awesome presentations.
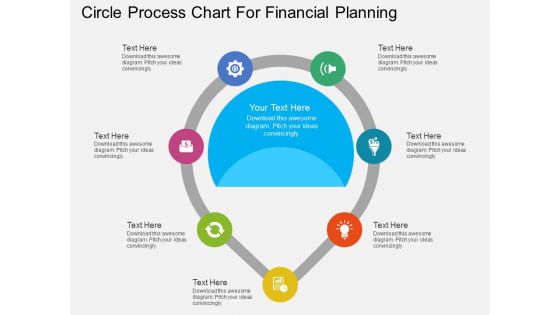
Seven Staged Circle Process Chart For Financial Planning Powerpoint Template
Our above PPT slide contains process chart with icons. This PowerPoint template may be used to display strategic planning methodology. This template is designed to attract the attention of your audience.
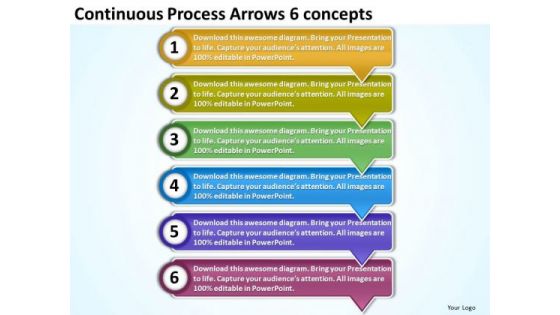
Continuous Process Arrows 6 Concepts Oil Flow Chart PowerPoint Slides
We present our continuous process arrows 6 concepts oil flow chart PowerPoint Slides. Use our Arrows PowerPoint Templates because, have always been a source of inspiration for us all. Use our Symbol PowerPoint Templates because, this template with an image of helps you chart the course of your presentation. Use our Business PowerPoint Templates because, Our Template designs are State of the Art. Use our Metaphor PowerPoint Templates because, Inspired by the indelible Olympic logo this graphic exemplifies the benefits of teamwork. Use our Process and Flows PowerPoint Templates because, you have the basic goal in mind. Use these PowerPoint slides for presentations relating to Arrow, Background, Business, Chart, Diagram, Financial, Graphic, Gray, Icon, Illustration, Management, Orange, Perspective, Planning, Process, Stages, Steps, Text. The prominent colors used in the PowerPoint template are Yellow, Green, and Purple Whatever the fare, add on our Continuous Process Arrows 6 Concepts Oil Flow Chart PowerPoint Slides. They go down well with everything.
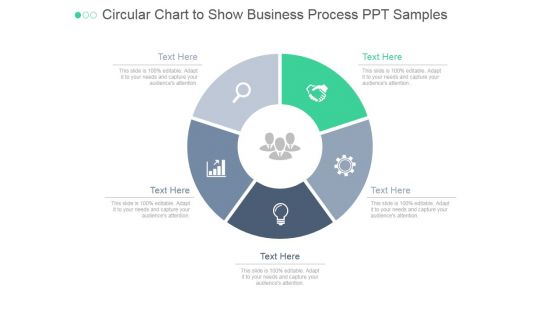
Circular Chart To Show Business Process Ppt PowerPoint Presentation Microsoft
This is a circular chart to show business process ppt powerpoint presentation microsoft. This is a five stage process. The stages in this process are business, marketing, strategy, process, icons.
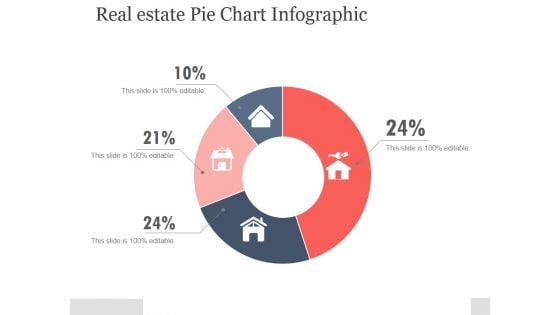
Real Estate Pie Chart Infographic Ppt PowerPoint Presentation Portfolio
This is a real estate pie chart infographic ppt powerpoint presentation portfolio. This is a four stage process. The stages in this process are circular, business, icons, marketing, process.
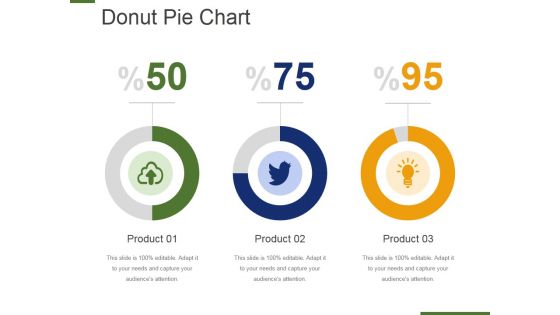
Donut Pie Chart Ppt PowerPoint Presentation Pictures Infographic Template
This is a donut pie chart ppt powerpoint presentation pictures infographic template. This is a three stage process. The stages in this process are product, business, marketing, icons, process.
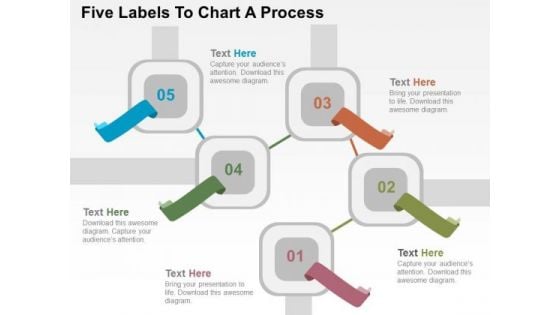
Five Labels To Chart A Process PowerPoint Templates
Our above slide contains graphics of five labels. This PPT label graphics may be used to chart a business process. The Powerpoint Templates can be customized as per requirements of business education or any other theme.
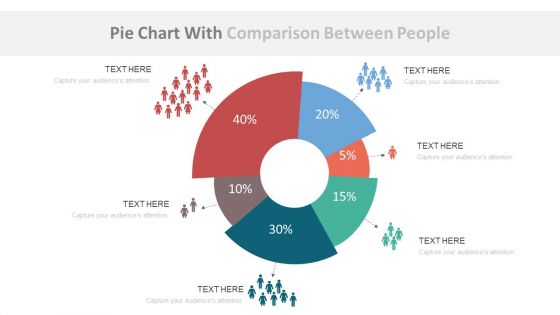
Pie Chart With Population Ratio Analysis Powerpoint Slides
This dashboard template contains graphics of pie chart with icons. This dashboard PowerPoint template helps to display population ratio analysis in a visual manner. Download this template to make impressive presentations.
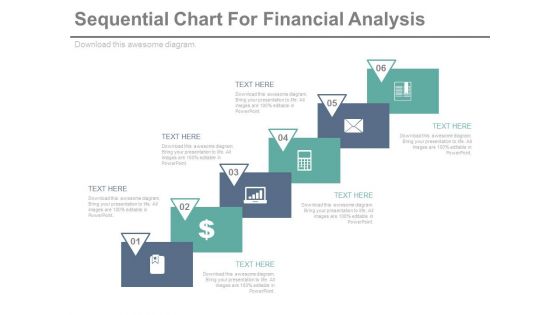
Sequential Steps Chart For Data Analysis Powerpoint Slides
This PowerPoint template has been designed sequential steps chart with icons. This PPT slide can be used to display corporate level financial strategy. You can download finance PowerPoint template to prepare awesome presentations.
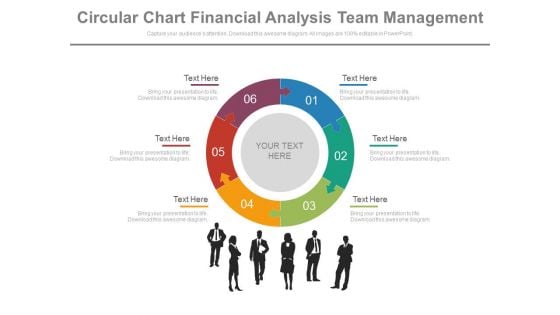
Puzzle Pie Chart With Team For Financial Analysis Powerpoint Slides
This PPT slide contains graphics of puzzle pie chart with team icons. You may use this PowerPoint template to display team strategy and success. Download this professional slide design to deliver amazing presentations.
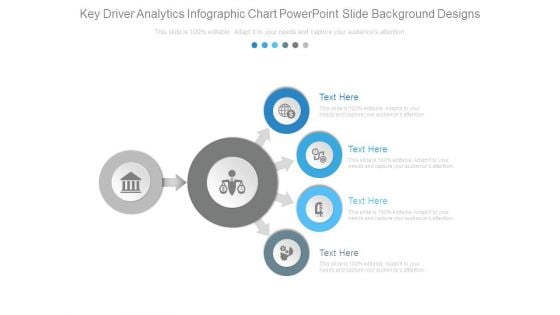
Key Driver Analytics Infographic Chart Powerpoint Slide Background Designs
This is a key driver analytics infographic chart powerpoint slide background designs. This is a four stage process. The stages in this process are business, marketing, arrows, icons, strategy.
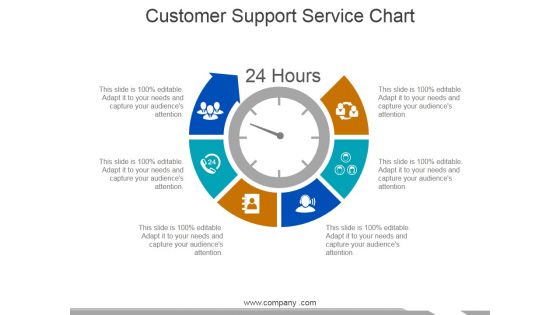
Customer Support Service Chart Ppt PowerPoint Presentation Infographic Template Graphics
This is a customer support service chart ppt powerpoint presentation infographic template graphics. This is a six stage process. The stages in this process are business, icons, strategy, marketing.
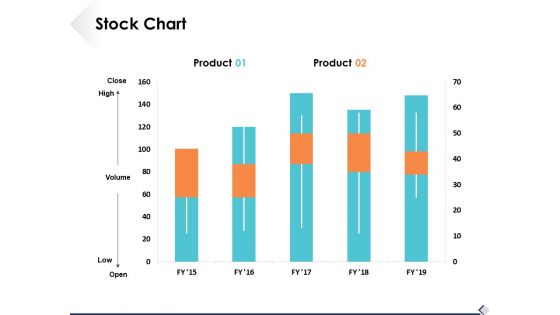
Stock Chart Finance Ppt PowerPoint Presentation Styles Background Image
This is a stock chart finance ppt powerpoint presentation styles background image. This is a two stage process. The stages in this process are analysis, marketing, icons, finance, strategy.
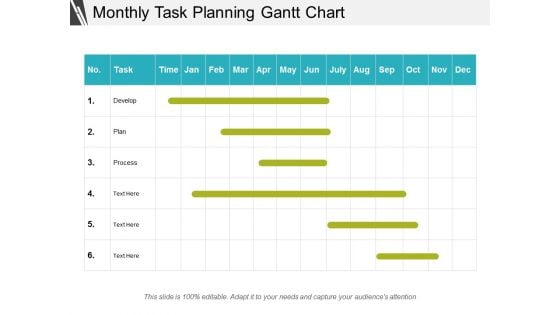
Monthly Task Planning Gantt Chart Ppt PowerPoint Presentation Portfolio Images
This is a monthly task planning gantt chart ppt powerpoint presentation portfolio images. This is a six stage process. The stages in this process are strategy plan, strategy objectives, strategy action.
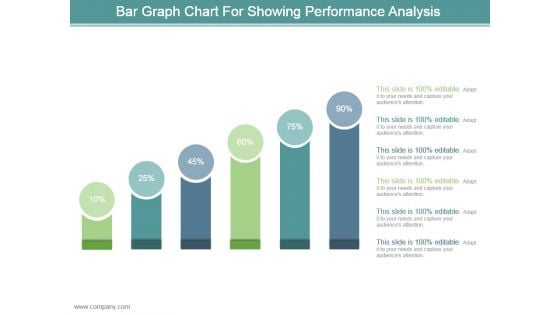
Bar Graph Chart For Showing Performance Analysis Ppt Design
This is a bar graph chart for showing performance analysis ppt design. This is a six stage process. The stages in this process are business, marketing, process, success, presentation.

Profit Bar Chart Business PowerPoint Backgrounds And Templates 1210
Microsoft PowerPoint Template and Background with Business success bar graph rendered in 3D Our Profit Bar Chart Business PowerPoint Backgrounds And Templates 1210 are clearly eye catching. One look and you will not want to even blink.
Colorful Bar Chart Business PowerPoint Templates And PowerPoint Backgrounds 0811
Microsoft PowerPoint Template and Background with of a three-dimensional multi-colored bar graph on a white background Address baseless allegations with our Colorful Bar Chart Business PowerPoint Templates And PowerPoint Backgrounds 0811. Give appropriate answers to clear all doubts.
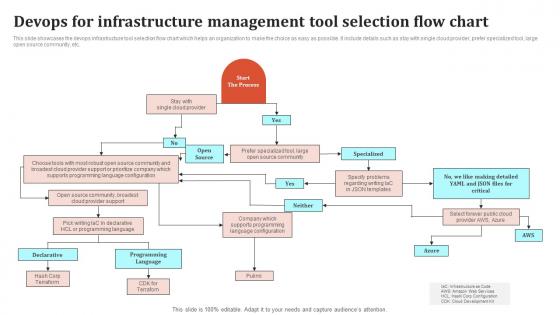
Devops For Infrastructure Management Tool Selection Flow Chart Pictures Pdf
This slide showcases the devops infrastructure tool selection flow chart which helps an organization to make the choice as easy as possible. It include details such as stay with single cloud provider, prefer specialized tool, large open source community, etc. Showcasing this set of slides titled Devops For Infrastructure Management Tool Selection Flow Chart Pictures Pdf The topics addressed in these templates are Start The Process, Declarative, Programming Language All the content presented in this PPT design is completely editable. Download it and make adjustments in color, background, font etc. as per your unique business setting. This slide showcases the devops infrastructure tool selection flow chart which helps an organization to make the choice as easy as possible. It include details such as stay with single cloud provider, prefer specialized tool, large open source community, etc.
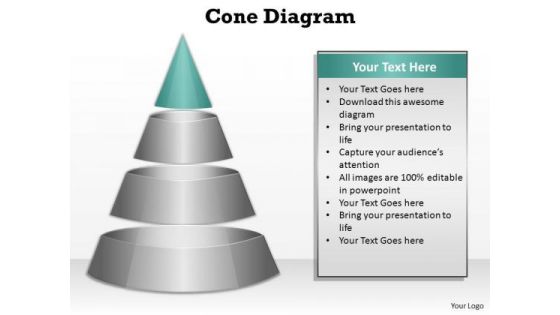
PowerPoint Presentation Designs Chart Cone Diagram Ppt Theme
PowerPoint Presentation Designs Chart Cone diagram PPT Theme--These amazing PowerPoint pre-designed slides and PowerPoint templates have been carefully created by our team of experts to help you impress your audience. Our stunning collection of Powerpoint slides are 100% editable and can easily fit in any PowerPoint presentations. By using these animations and graphics in PowerPoint and you can easily make professional presentations. Any text can be entered at any point in the PowerPoint template or slide. Just DOWNLOAD our awesome PowerPoint templates and you are ready to go. Frame an argument with our PowerPoint Presentation Designs Chart Cone Diagram Ppt Theme. Try us out and see what a difference our templates make.
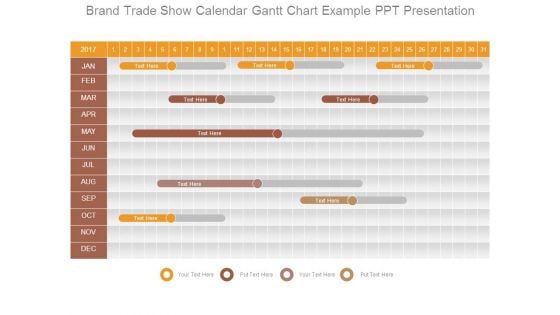
Brand Trade Show Calendar Gantt Chart Example Ppt Presentation
This is a brand trade show calendar gantt chart example ppt presentation. This is a one stage process. The stages in this process are jan, feb, mar, apr, may, jun, jul, aug, sep, oct, nov, dec.
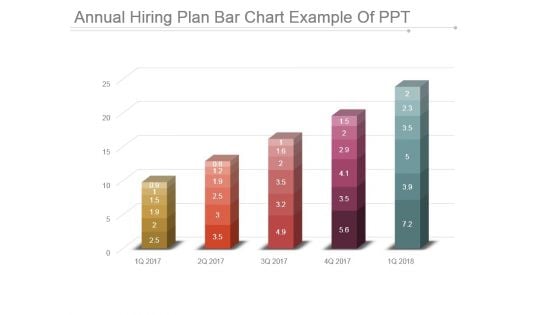
Annual Hiring Plan Bar Chart Example Of Ppt
This is a annual hiring plan bar chart example of ppt. This is a five stage process. The stages in this process are bar graph, business, marketing, growth, success.
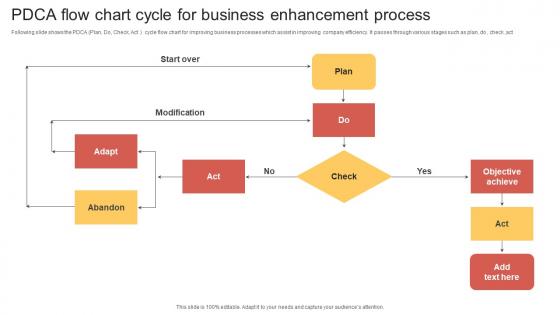
PDCA Flow Chart Cycle For Business Enhancement Process Clipart Pdf
Following slide shows the PDCA Plan, Do, Check, Act cycle flow chart for improving business processes which assist in improving company efficiency. It passes through various stages such as plan, do , check ,act Pitch your topic with ease and precision using this PDCA Flow Chart Cycle For Business Enhancement Process Clipart Pdf. This layout presents information on Modification, Abandon, Start Over. It is also available for immediate download and adjustment. So, changes can be made in the color, design, graphics or any other component to create a unique layout. Following slide shows the PDCA Plan, Do, Check, Act cycle flow chart for improving business processes which assist in improving company efficiency. It passes through various stages such as plan, do , check ,act


 Continue with Email

 Home
Home


