Phases
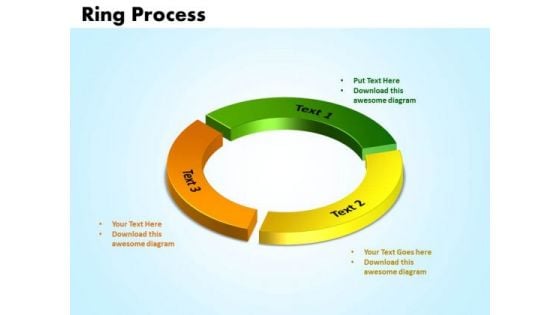
PowerPoint Templates Ring Process Business Ppt Slides
PowerPoint Templates ring process Business PPT Slides-Use this ring process diagram to represent a continuing sequence of stages, tasks, or events in a circular flow. -3d, blue, ring process, chart, circle, circular, continuity, cycle, diagram, dimensional, graph, green, icon, motion, movement, pattern, process, pie, recycling, red, repetition, report, ring, round, scheme, section, set, sign, slice, spinning, turn, vector-PowerPoint Templates ring process Business PPT Slides Our PowerPoint Templates Ring Process Business Ppt Slides will elevate the experience. Lift your thoughts to a higher plane.
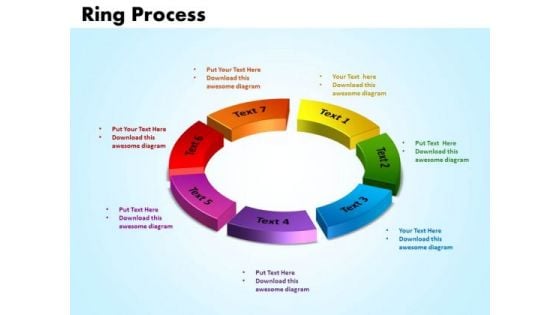
PowerPoint Templates Ring Process Download Ppt Design
PowerPoint Templates Ring Process Download PPT Design-Use this ring process diagram to represent a continuing sequence of stages, tasks, or events in a circular flow. -3d, blue, ring process, chart, circle, circular, continuity, cycle, diagram, dimensional, graph, green, icon, motion, movement, pattern, process, pie, recycling, red, repetition, report, ring, round, scheme, section, set, sign, slice, spinning, turn, vector-PowerPoint Templates Ring Process Download PPT Design Our PowerPoint Templates Ring Process Download Ppt Design are based on experience. They do not contain anything fanciful.
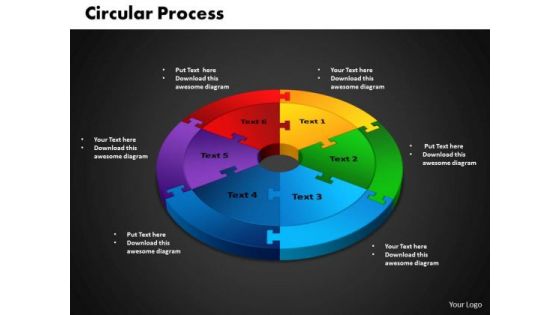
PowerPoint Slides Circular Process Teamwork Ppt Backgrounds
PowerPoint Slides Circular Process Teamwork PPT Backgrounds-This Diagram shows interrelated concepts in a circular flow . An excellent graphic to attract the attention of and understanding by your audience-PowerPoint Slides Circular Process Teamwork PPT Backgrounds-Cycle, Design, Diagram, Element, Graph, Business, Chart, Circular, Connect, Connection, Puzzle, Round, Solving, Step, Together, Putting, Mystery, Linking, Infographic, Icon, Experience the striking graphics of our PowerPoint Slides Circular Process Teamwork Ppt Backgrounds. They bring good quality to the table.
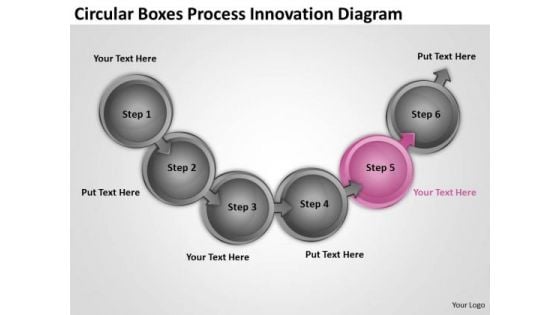
Circular Boxes Process Innovation Diagram Flowchart Of Business Plan PowerPoint Templates
We present our circular boxes process innovation diagram flowchart of business plan PowerPoint templates.Present our Marketing PowerPoint Templates because Our PowerPoint Templates and Slides are created with admirable insight. Use them and give your group a sense of your logical mind. Download our Busines PowerPoint Templates because this diagram helps you to discuss each step slowly but surely move up the pyramid narrowing down to the best and most success oriented project. Download our Circle Charts PowerPoint Templates because this helps you to put all your brilliant views to your audience. Download our Arrows PowerPoint Templates because so that you can Lead the way to spread good cheer to one and all. Download our Spheres PowerPoint Templates because honesty is the best policy has an ardent follower in you.Use these PowerPoint slides for presentations relating to Arrow, Business, Chain, Chart, Circle, Circle, Frame, Color, Concept, Connect, Connection, Connectivity, Corporate, Data, Design, Diagram, Financial, Flow, Flowchart, Graph, Graphical, Group, Important, Organization, Organize, Plan, Process, Rectangle, Relation, Set, Steps, Structure, Teamwork. The prominent colors used in the PowerPoint template are Pink, Gray, Black. Customers tell us our circular boxes process innovation diagram flowchart of business plan PowerPoint templates are Nifty. You can be sure our Chart PowerPoint templates and PPT Slides are Quaint. Presenters tell us our circular boxes process innovation diagram flowchart of business plan PowerPoint templates are No-nonsense. Professionals tell us our Chain PowerPoint templates and PPT Slides are Romantic. Presenters tell us our circular boxes process innovation diagram flowchart of business plan PowerPoint templates are Upbeat. Professionals tell us our Circle PowerPoint templates and PPT Slides are Cheerful. Our Circular Boxes Process Innovation Diagram Flowchart Of Business Plan PowerPoint Templates are geared for excellence. They will have your thoughts accelerating away.
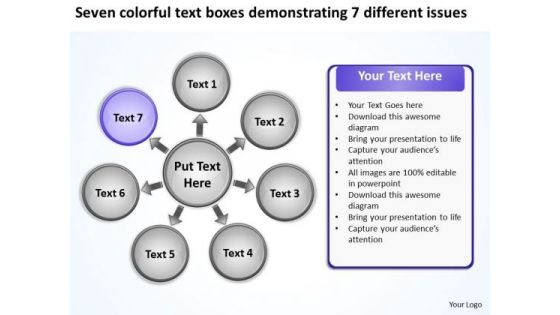
Text Boxes Demonstrating 7 Different Issues Circular Flow Diagram PowerPoint Templates
We present our text boxes demonstrating 7 different issues Circular Flow Diagram PowerPoint templates.Present our Success PowerPoint Templates because iT outlines the entire thought process for the benefit of others. Tell it to the world with your characteristic aplomb. Use our Ring Charts PowerPoint Templates because you can Break it all down to Key Result Areas. Download our Business PowerPoint Templates because The foundation of the structure of your business is resilient and dependable. Convey this confidence to your colleagues and assure them of a great and enduring future. Use our Shapes PowerPoint Templates because this template with an image of helps you chart the course of your presentation. Use our Process and Flows PowerPoint Templates because there is a very good saying that prevention is better than cure, either way you have a store of knowledge for sure.Use these PowerPoint slides for presentations relating to Account, Arrow, Blog, Business, Chart, Description, Diagram, Illustration, Marketing, Process, Profit, Resource, Strategy, Success, Template, Trend. The prominent colors used in the PowerPoint template are Purple, Gray, White. Professionals tell us our text boxes demonstrating 7 different issues Circular Flow Diagram PowerPoint templates have awesome images to get your point across. Customers tell us our Description PowerPoint templates and PPT Slides are Efficient. Use our text boxes demonstrating 7 different issues Circular Flow Diagram PowerPoint templates will get their audience's attention. The feedback we get is that our Illustration PowerPoint templates and PPT Slides are Ritzy. Professionals tell us our text boxes demonstrating 7 different issues Circular Flow Diagram PowerPoint templates are Ultra. Presenters tell us our Diagram PowerPoint templates and PPT Slides are aesthetically designed to attract attention. We guarantee that they will grab all the eyeballs you need. Entertain your audience with our Text Boxes Demonstrating 7 Different Issues Circular Flow Diagram PowerPoint Templates. You will come out on top.
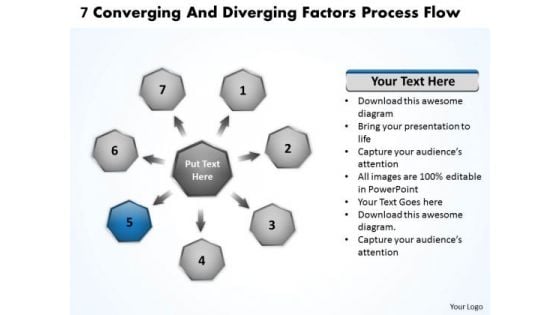
7 Converging And Diverging Factors Process Flow Cycle Diagram PowerPoint Slides
We present our 7 converging and diverging factors process flow Cycle Diagram PowerPoint Slides.Download our Leadership PowerPoint Templates because this diagram can be used to illustrate the logical path or system. Present our Circle Charts PowerPoint Templates because they will Amplify your views and plans for getting ahead and then the manner in which you intend staying ahead. Use our Arrows PowerPoint Templates because this is an impressive template to unravel your recipe for a mouth watering result. Present our Business PowerPoint Templates because you can see clearly through to the bigger bowl ahead. Time your jump to perfection and hit the nail on the head. Present our Process and Flows PowerPoint Templates because our presentation designs are for those on the go.Use these PowerPoint slides for presentations relating to Agreeable, Agreeableness, Art, Blue, Business, Chart, Circle, Clip, Clipart, Conscientiousness, Diagram, Extraversion, Factor, Five, Flow, Graph, Graphic, Green, Illustration, Model, Neuroticism, Openness, Personality, Pointed, Process, Psychological, Psychology, Red, Segment, Segmented, Shape. The prominent colors used in the PowerPoint template are Blue, Gray, Black. PowerPoint presentation experts tell us our 7 converging and diverging factors process flow Cycle Diagram PowerPoint Slides are One-of-a-kind. People tell us our Circle PowerPoint templates and PPT Slides have awesome images to get your point across. People tell us our 7 converging and diverging factors process flow Cycle Diagram PowerPoint Slides are Reminiscent. Presenters tell us our Chart PowerPoint templates and PPT Slides are Attractive. Customers tell us our 7 converging and diverging factors process flow Cycle Diagram PowerPoint Slides are Playful. The feedback we get is that our Blue PowerPoint templates and PPT Slides are Multicolored. Achieve strong & sustainable profit gains with our 7 Converging And Diverging Factors Process Flow Cycle Diagram PowerPoint Slides. They will make you look good.
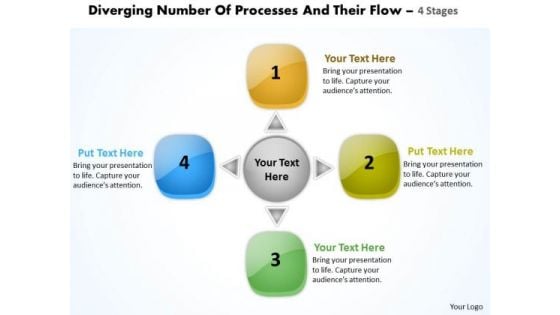
Diverging Number Of Processes And Their Flow 4 Stages Cycle Diagram PowerPoint Slides
We present our diverging number of processes and their flow 4 stages Cycle Diagram PowerPoint Slides.Download and present our Boxes PowerPoint Templates because this slide is Designed to help bullet-point your views and thoughts. Download our Business PowerPoint Templates because this template can project the path to sucess that you have charted. Use our Arrows PowerPoint Templates because let your words be the drops of wisdom spreading knowledge and peace like ripples through the expectant minds of your devoted followers. Download and present our Shapes PowerPoint Templates because you can Focus on each one and investigate which one would be the best fit for your needs. Download and present our Flow Charts PowerPoint Templates because this diagram has the unique ability to drive home your ideas and show how they mesh to guarantee success.Use these PowerPoint slides for presentations relating to 3d, abstract, algorithm, arrow, background, blank, block, box, business, chain, chart, circle, colorful, concept, connect, connection, corporate, design, diagram, empty, flow, flowchart, graph, graphic, hierarchy, illustration, information, isolated, management, network, organisation, organization, organize, plan, procedure, process, program, scalable, shape, sign, solution, structure, symbol, teamwork, technology,. The prominent colors used in the PowerPoint template are Green, Blue, Yellow. Presenters tell us our diverging number of processes and their flow 4 stages Cycle Diagram PowerPoint Slides are visually appealing. You can be sure our algorithm PowerPoint templates and PPT Slides are Youthful. Professionals tell us our diverging number of processes and their flow 4 stages Cycle Diagram PowerPoint Slides are second to none. People tell us our arrow PowerPoint templates and PPT Slides are Adorable. People tell us our diverging number of processes and their flow 4 stages Cycle Diagram PowerPoint Slides are Amazing. Professionals tell us our business PowerPoint templates and PPT Slides are Gorgeous. Feel like a celebrity with our Diverging Number Of Processes And Their Flow 4 Stages Cycle Diagram PowerPoint Slides. They ensure ample adulation.
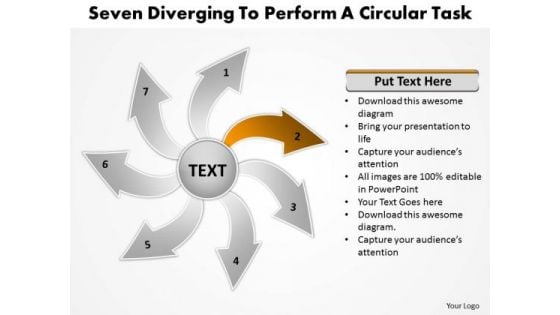
Seven Diverging Steps To Perform A Circular Task Arrow Cycle Diagram PowerPoint Templates
We present our seven diverging steps to perform a circular task arrow Cycle Diagram PowerPoint templates.Present our Business PowerPoint Templates because it helps you to project your enthusiasm and single mindedness to your colleagues. Download our Arrows PowerPoint Templates because Our PowerPoint Templates and Slides will let your team Walk through your plans. See their energy levels rise as you show them the way. Download our Marketing PowerPoint Templates because The marketplace is the merger of your dreams and your ability. Download our Flow Charts PowerPoint Templates because it has inspired a whole new world of medical endeavour. Download and present our Shapes PowerPoint Templates because You are an avid believer in ethical practices. Highlight the benefits that accrue with our PowerPoint Templates and Slides.Use these PowerPoint slides for presentations relating to Arrow, Business, Chart, Circular, Concept, Diagram, Informative, Internet, Market, Marketing, Member, Performance, Process, Profit, Profitable, Project, Refer, Referral, Referring, Revenue, Socialize, Steps, Strategy, Web, Websites. The prominent colors used in the PowerPoint template are Brown, Gray, White. People tell us our seven diverging steps to perform a circular task arrow Cycle Diagram PowerPoint templates are Splendid. People tell us our Diagram PowerPoint templates and PPT Slides will save the presenter time. The feedback we get is that our seven diverging steps to perform a circular task arrow Cycle Diagram PowerPoint templates are Vintage. Presenters tell us our Internet PowerPoint templates and PPT Slides are Energetic. Customers tell us our seven diverging steps to perform a circular task arrow Cycle Diagram PowerPoint templates are Fun. The feedback we get is that our Chart PowerPoint templates and PPT Slides will generate and maintain the level of interest you desire. They will create the impression you want to imprint on your audience. Our Seven Diverging Steps To Perform A Circular Task Arrow Cycle Diagram PowerPoint Templates are an affordable abode. Give your thoughts a place to stay.
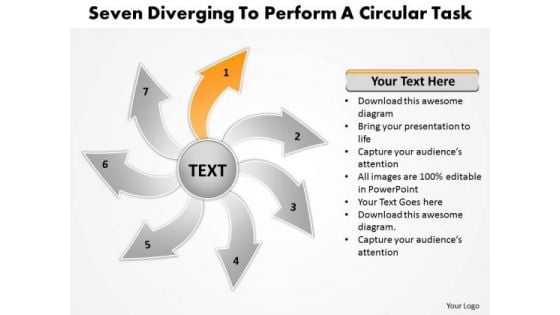
Seven Diverging Steps To Perform A Circular Task Cycle Diagram PowerPoint Templates
We present our seven diverging steps to perform a circular task Cycle Diagram PowerPoint templates.Download our Business PowerPoint Templates because you have analysed many global markets and come up with possibilities. Highlight the pros and cons of other likely business oppurtunities. Present our Arrows PowerPoint Templates because it gives you really bright ideas. Present our Marketing PowerPoint Templates because The marketplace is the merger of your dreams and your ability. Download and present our Flow Charts PowerPoint Templates because you can Flutter your wings and enchant the world. Impress them with the innate attractiveness of your thoughts and words. Download and present our Shapes PowerPoint Templates because Our PowerPoint Templates and Slides are Clear and concise. Use them and dispel any doubts your team may have.Use these PowerPoint slides for presentations relating to Arrow, Business, Chart, Circular, Concept, Diagram, Informative, Internet, Market, Marketing, Member, Performance, Process, Profit, Profitable, Project, Refer, Referral, Referring, Revenue, Socialize, Steps, Strategy, Web, Websites. The prominent colors used in the PowerPoint template are Orange, Gray, White. People tell us our seven diverging steps to perform a circular task Cycle Diagram PowerPoint templates will get their audience's attention. People tell us our Circular PowerPoint templates and PPT Slides are Clever. The feedback we get is that our seven diverging steps to perform a circular task Cycle Diagram PowerPoint templates are Classic. Presenters tell us our Diagram PowerPoint templates and PPT Slides are incredible easy to use. Customers tell us our seven diverging steps to perform a circular task Cycle Diagram PowerPoint templates provide great value for your money. Be assured of finding the best projection to highlight your words. The feedback we get is that our Chart PowerPoint templates and PPT Slides will help you be quick off the draw. Just enter your specific text and see your points hit home. Direct people with our Seven Diverging Steps To Perform A Circular Task Cycle Diagram PowerPoint Templates. Download without worries with our money back guaranteee.
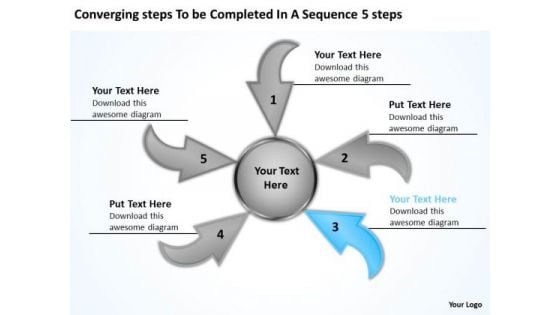
Steps To Be Completed In A Sequence 5 Circular Process Diagram PowerPoint Templates
We present our steps to be completed in a sequence 5 Circular Process Diagram PowerPoint templates.Download our Arrows PowerPoint Templates because this slide depicts the occasion for gifting and giving. Use our Process and Flows PowerPoint Templates because this layout helps you to see satisfaction spread across the room as they unravel your gifted views. Present our Flow Charts PowerPoint Templates because it outlines the process with this innovative graphic to authenticate your plan of achieving the goal of added value/profit. Use our Business PowerPoint Templates because this template helps you to grab the attention of your listeners. Use our Shapes PowerPoint Templates because this slide illustrates your thoughts and experiences to your staff.Use these PowerPoint slides for presentations relating to Arrow, Business, Chart, Circular, Concept, Diagram, Informative, Internet, Market, Marketing, Member, Performance, Process, Profit, Profitable, Project, Refer, Referral, Referring, Revenue, Socialize, Steps, Strategy, Web, Websites. The prominent colors used in the PowerPoint template are Blue light, Gray, Black. People tell us our steps to be completed in a sequence 5 Circular Process Diagram PowerPoint templates are Stylish. People tell us our Diagram PowerPoint templates and PPT Slides are Sparkling. The feedback we get is that our steps to be completed in a sequence 5 Circular Process Diagram PowerPoint templates are Royal. Presenters tell us our Internet PowerPoint templates and PPT Slides are designed by professionals Customers tell us our steps to be completed in a sequence 5 Circular Process Diagram PowerPoint templates are topically designed to provide an attractive backdrop to any subject. The feedback we get is that our Chart PowerPoint templates and PPT Slides will make you look like a winner. Open up the windows of your mind. Unlatch them with our Steps To Be Completed In A Sequence 5 Circular Process Diagram PowerPoint Templates.
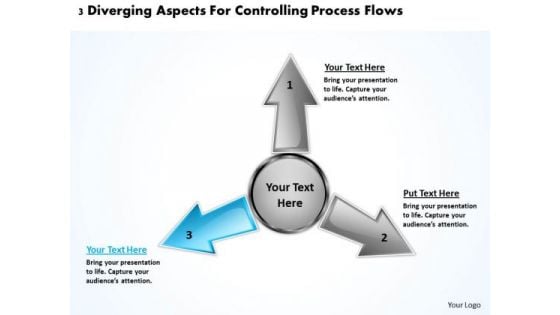
3 Diverging Aspects For Controlling Process Flows Cycle Diagram PowerPoint Templates
We present our 3 diverging aspects for controlling process flows Cycle Diagram PowerPoint templates.Download our Business PowerPoint Templates because you can Flutter your wings and enchant the world. Impress them with the innate attractiveness of your thoughts and words. Download our Shapes PowerPoint Templates because this Diagram emphasizes on any critical or key factors within them. Use our Flow Charts PowerPoint Templates because you understand the illness and its causes. Present our Arrows PowerPoint Templates because you will be able to Highlight your ideas broad-based on strong fundamentals and illustrate how they step by step acheive the set growth factor. Use our Process and Flows PowerPoint Templates because you have a clear vision of the cake you want.Use these PowerPoint slides for presentations relating to Arrow, Brochure, Business, Chart, Circle, Cyclic, Data, Diagram, Financial, Goal, Graph, Illustration, Info, Information, Investment, Manage, Marketing, Model, Option, Part, Pie, Presentation, Process, Result, Sphere, Statistics, Stock, Strategy, Template, Wheel. The prominent colors used in the PowerPoint template are Blue light, Gray, Black. People tell us our 3 diverging aspects for controlling process flows Cycle Diagram PowerPoint templates are Beautiful. Customers tell us our Chart PowerPoint templates and PPT Slides are Elegant. People tell us our 3 diverging aspects for controlling process flows Cycle Diagram PowerPoint templates are Perfect. Professionals tell us our Business PowerPoint templates and PPT Slides are Fantastic. Customers tell us our 3 diverging aspects for controlling process flows Cycle Diagram PowerPoint templates are designed by a team of presentation professionals. Use our Data PowerPoint templates and PPT Slides are Radiant. Get the best backing available. It'll be difficult to beat your thoughts and our 3 Diverging Aspects For Controlling Process Flows Cycle Diagram PowerPoint Templates.
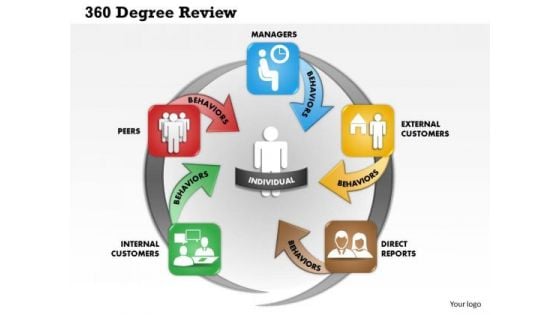
Business Framework 360 Degree Review PowerPoint Presentation
This diagram has been designed with framework of 360 degree review. Download this diagram for business evaluation process. This diagram is editable and may be easily adjusted.
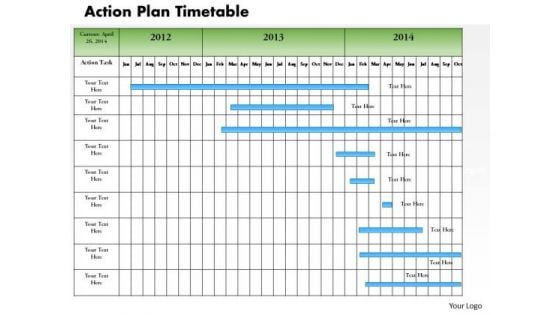
Business Framework Action Plan Timetable PowerPoint Presentation
Use this timetable diagram to illustrate the action plan. Illustrate your action plan for upcoming years with this business diagram. This unique diagram make your presentations more professional.
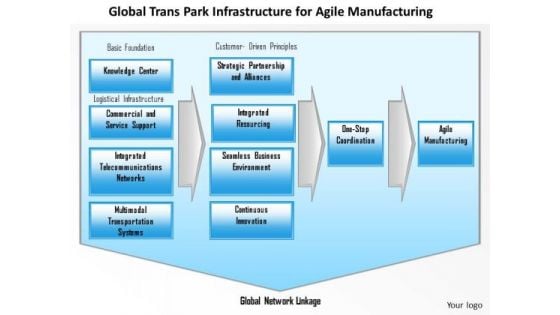
Business Framework Agile Manufacturing PowerPoint Presentation
This diagram has been designed with framework of agile manufacturing. Download this diagram to make professional presentations. This diagram is editable and may be easily adjusted.

Business Framework Agile Methodology PowerPoint Presentation
This diagram has been designed with framework of agile methodology. Download this diagram to make professional presentations. This diagram is editable and may be easily adjusted

Business Framework An Organization Approach To Strategic Systems Planning PowerPoint Presentation
Use this unified diagram to illustrate the logical path or system. This diagram displays approach of strategic system planning. Use this professional and customized business diagram for PowerPoint
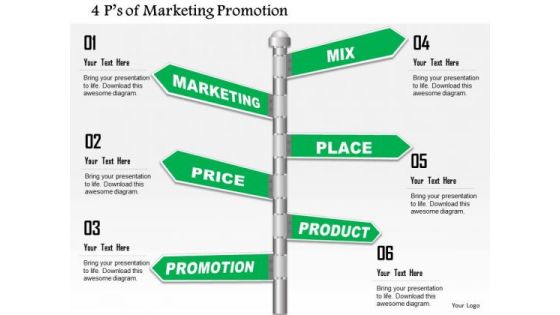
Business Framework4 P S Of Marketing Promotion PowerPoint Presentation
This diagram shows 4ps of marketing mix. Use this diagram for giving a clear message in a structured manner. This diagram is suitable for marketing and sales presentations.
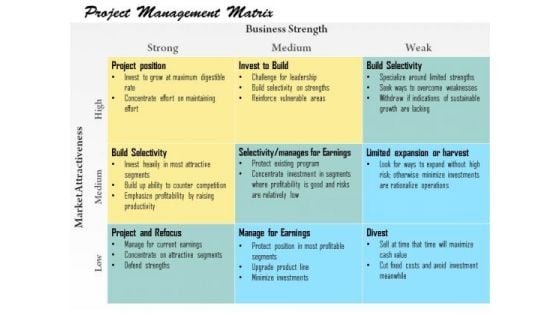
Business Framework Project Management Matrix PowerPoint Presentation
This diagram displays profitability ratio calculation template. Use this diagram in business and marketing presentations to depict profit ratio. This diagram will enhance the quality of your presentations.
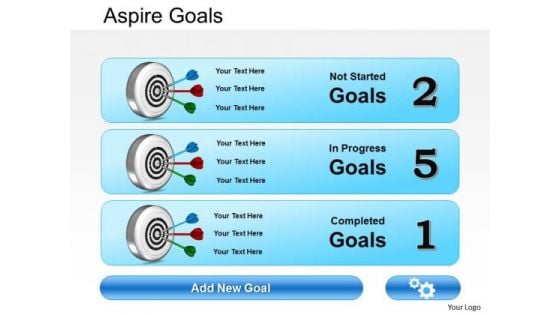
Business Framework Visualize Your Goals PowerPoint Presentation
This diagram displays framework for visualize your goals. This professional diagram helps to define companys goals. Adjust this diagram into your presentations to visually support your contents.
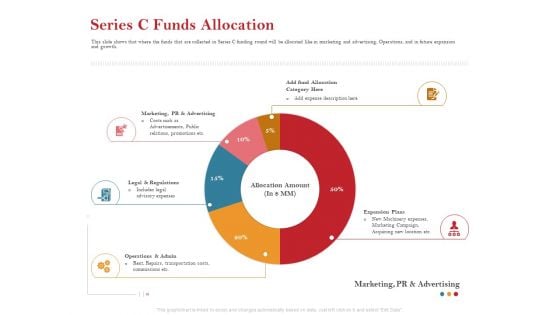
Pitch Deck For Raising Capital For Inorganic Growth Series C Funds Allocation Diagrams PDF
This slide shows that where the funds that are collected in Series C funding round will be allocated like in marketing and advertising, Operations, and in future expansion and growth. Deliver and pitch your topic in the best possible manner with this pitch deck for raising capital for inorganic growth series c funds allocation diagrams pdf. Use them to share invaluable insights on marketing, allocation, expansion plans, legal and regulations, operations and admin and impress your audience. This template can be altered and modified as per your expectations. So, grab it now.
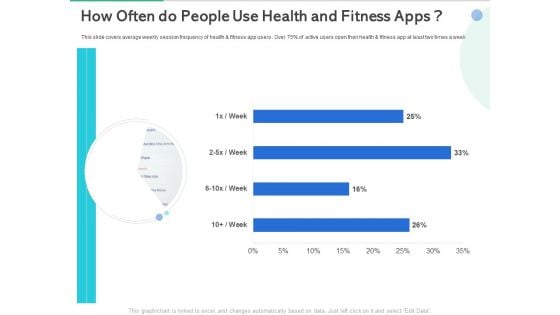
Market Overview Fitness Industry How Often Do People Use Health And Fitness Apps Diagrams PDF
This slide covers average weekly session frequency of health and fitness app users . Over 75 percent of active users open their health and fitness app at least two times a week. Deliver an awe-inspiring pitch with this creative market overview fitness industry how often do people use health and fitness apps diagrams pdf bundle. Topics like people use health and fitness apps can be discussed with this completely editable template. It is available for immediate download depending on the needs and requirements of the user.
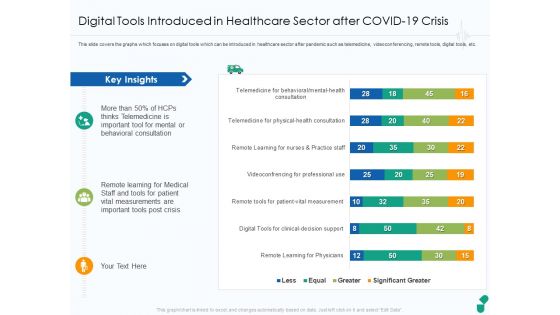
Digital Tools Introduced In Healthcare Sector After COVID 19 Crisis Ppt Outline Diagrams PDF
This slide covers the graphs which focuses on digital tools which can be introduced in healthcare sector after pandemic such as telemedicine, videoconferencing, remote tools, digital tools, etc. Deliver an awe-inspiring pitch with this creative digital tools introduced in healthcare sector after covid 19 crisis ppt outline diagrams pdf bundle. Topics like key insights, patient vital measurements, important tools post crisis, behavioral consultation can be discussed with this completely editable template. It is available for immediate download depending on the needs and requirements of the user.
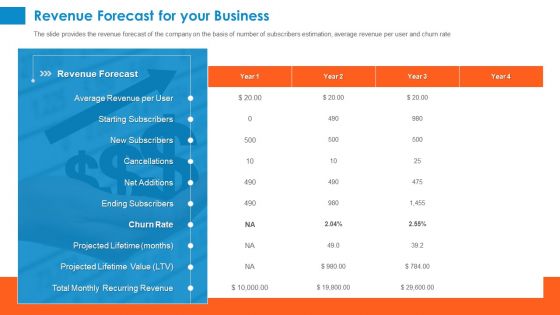
Raising Company Capital From Public Funding Sources Revenue Forecast For Your Business Diagrams PDF
The slide provides the revenue forecast of the company on the basis of number of subscribers estimation, average revenue per user and churn rate. Deliver an awe-inspiring pitch with this creative raising company capital from public funding sources revenue forecast for your business diagrams pdf bundle. Topics like revenue forecast, ending subscribers, starting subscribers, average revenue per user, projected lifetime, total monthly recurring revenue can be discussed with this completely editable template. It is available for immediate download depending on the needs and requirements of the user.
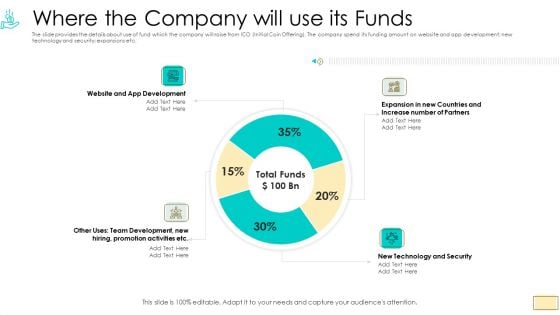
Investor Pitch Ppt For Crypto Funding Where The Company Will Use Its Funds Diagrams PDF
The slide provides the details about use of fund which the company will raise from ICO Initial Coin Offering. The company spend its funding amount on website and app development new technology and security expansions etc.Deliver an awe-inspiring pitch with this creative investor pitch ppt for crypto funding where the company will use its funds diagrams pdf. bundle. Topics like website and app development, new technology and security, expansion in new countries and increase number of partners can be discussed with this completely editable template. It is available for immediate download depending on the needs and requirements of the user.
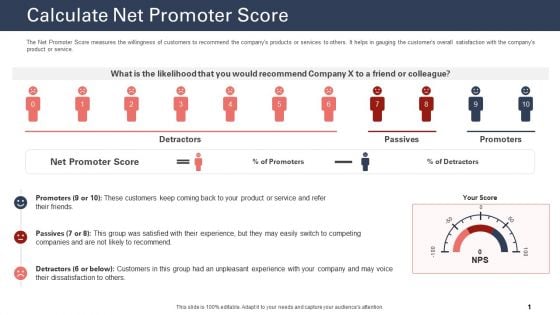
Techniques To Increase Customer Satisfaction Calculate Net Promoter Score Diagrams PDF
The Net Promoter Score measures the willingness of customers to recommend the companys products or services to others. It helps in gauging the customers overall satisfaction with the companys product or service. Deliver an awe inspiring pitch with this creative techniques to increase customer satisfaction calculate net promoter score diagrams pdf bundle. Topics like calculate net promoter score, product or service, net promoter score can be discussed with this completely editable template. It is available for immediate download depending on the needs and requirements of the user.
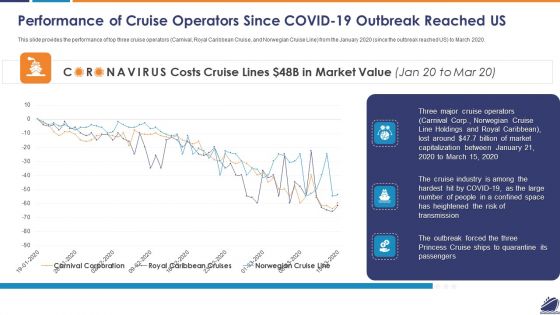
Performance Of Cruise Operators Since COVID 19 Outbreak Reached US Diagrams PDF
This slide provides the performance of top three cruise operators Carnival, Royal Caribbean Cruise, and Norwegian Cruise Line from the January 2020 since the outbreak reached US to March 2020. Deliver an awe inspiring pitch with this creative performance of cruise operators since covid 19 outbreak reached us diagrams pdf bundle. Topics like performance of cruise operators since covid 19 outbreak reached us can be discussed with this completely editable template. It is available for immediate download depending on the needs and requirements of the user.
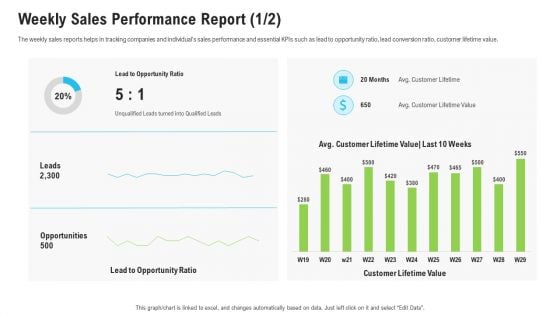
Sales Department Strategies Increase Revenues Weekly Sales Performance Report Leads Diagrams PDF
The weekly sales reports helps in tracking companies and individuals sales performance and essential KPIs such as lead to opportunity ratio, lead conversion ratio, customer lifetime value. Deliver and pitch your topic in the best possible manner with this sales department strategies increase revenues weekly sales performance report leads diagrams pdf. Use them to share invaluable insights on lead to opportunity ratio, customer lifetime value and impress your audience. This template can be altered and modified as per your expectations. So, grab it now.
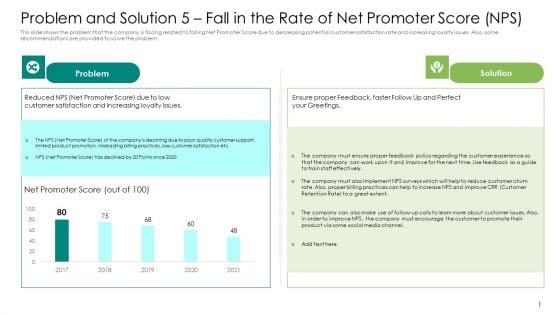
Problem And Solution 5 Fall In The Rate Of Net Promoter Score NPS Diagrams PDF
This slide shows the problem that the company is facing related to falling Net Promoter Score due to decreasing potential customer satisfaction rate and increasing loyalty issues. Also, some recommendations are provided to solve the problem. Deliver an awe-inspiring pitch with this creative problem and solution 5 fall in the rate of net promoter score nps diagrams pdf. bundle. Topics like net promoter score, 2017 to 2021 can be discussed with this completely editable template. It is available for immediate download depending on the needs and requirements of the user.
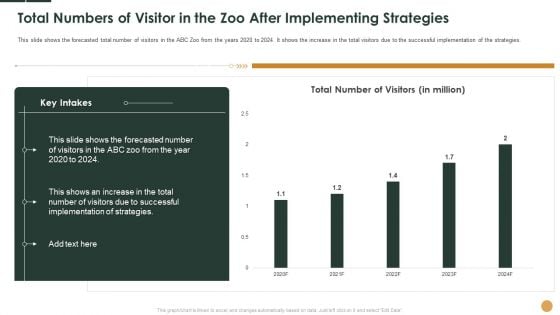
Total Numbers Of Visitor In The Zoo After Implementing Strategies Ppt Summary Diagrams PDF
This slide shows the forecasted total number of visitors in the ABC Zoo from the years 2020 to 2024. It shows the increase in the total visitors due to the successful implementation of the strategies.Deliver an awe-inspiring pitch with this creative total numbers of visitor in the zoo after implementing strategies ppt summary diagrams pdf. bundle. Topics like total number of visitors, 2020 to 2024 can be discussed with this completely editable template. It is available for immediate download depending on the needs and requirements of the user.
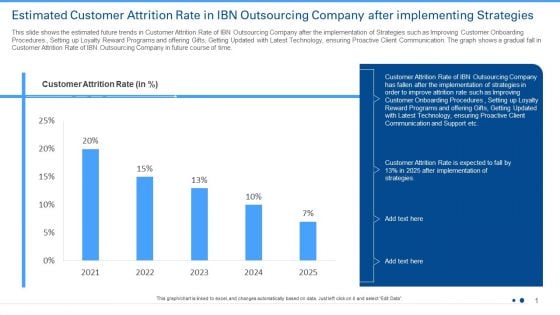
Estimated Customer Attrition Rate In IBN Outsourcing Company After Implementing Strategies Ppt Visual Aids Diagrams PDF
This slide shows a graph of decrease in level of Customer Satisfaction in IBN Outsourcing Company for past 5 years. Additionally, this slide provides information on some reasons High Response Time, Insufficient Knowledge with the Agent, Inability in Prioritizing Customer Requests etc. of fall in customer satisfaction level from 2017 to 2021.Deliver and pitch your topic in the best possible manner with this estimated customer attrition rate in ibn outsourcing company after implementing strategies ppt visual aids diagrams pdf. Use them to share invaluable insights on customer attrition rate, 2021 to 2025 and impress your audience. This template can be altered and modified as per your expectations. So, grab it now.
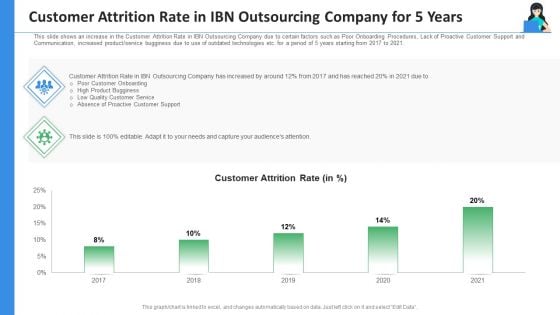
Customer Attrition Rate In IBN Outsourcing Company For 5 Years Ppt Styles Diagrams PDF
This slide shows an increase in the Customer Attrition Rate in IBN Outsourcing Company due to certain factors such as Poor Onboarding Procedures, Lack of Proactive Customer Support and Communication, increased product service bugginess due to use of outdated technologies etc. for a period of 5 years starting from 2017 to 2021. Deliver an awe inspiring pitch with this creative customer attrition rate in IBN outsourcing company for 5 years ppt styles diagrams pdf bundle. Topics like product bugginess, quality customer service, absence of proactive customer support, 2017 to 2021 can be discussed with this completely editable template. It is available for immediate download depending on the needs and requirements of the user.
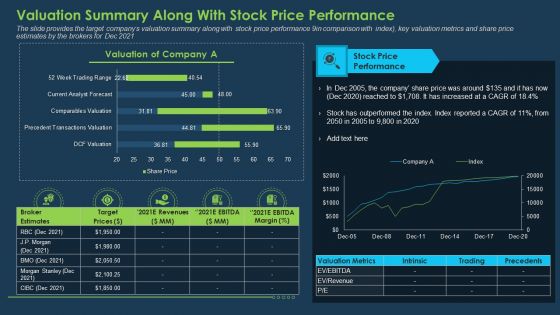
Commercial Banking Template Collection Valuation Summary Along With Stock Price Performance Diagrams PDF
The slide provides the target companys valuation summary along with stock price performance 9in comparison with index, key valuation metrics and share price estimates by the brokers for Dec 2021. Deliver and pitch your topic in the best possible manner with this commercial banking template collection valuation summary along with stock price performance diagrams pdf. Use them to share invaluable insights on stock price performance, revenues, target prices and impress your audience. This template can be altered and modified as per your expectations. So, grab it now.
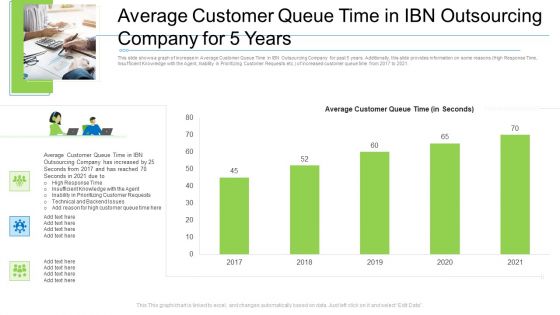
Average Customer Queue Time In Ibn Outsourcing Company For 5 Years Diagrams PDF
This slide shows a graph of increase in Average Customer Queue Time in IBN Outsourcing Company for past 5 years. Additionally, this slide provides information on some reasons High Response Time, Insufficient Knowledge with the Agent, Inability in Prioritizing Customer Requests etc. of increased customer queue time from 2017 to 2021. Deliver an awe-inspiring pitch with this creative average customer queue time in ibn outsourcing company for 5 years diagrams pdf. bundle. Topics like average customer queue time in ibn outsourcing company for 5 years can be discussed with this completely editable template. It is available for immediate download depending on the needs and requirements of the user.
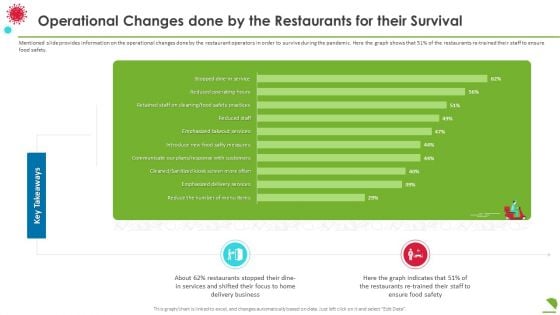
Operational Changes Done By The Restaurants For Their Survival Diagrams PDF
Mentioned slide provides information on the operational changes done by the restaurant operators in order to survive during the pandemic. Here the graph shows that 51 percentage of the restaurants re trained their staff to ensure food safety. Deliver an awe inspiring pitch with this creative operational changes done by the restaurants for their survival diagrams pdf bundle. Topics like business, services, key takeaways can be discussed with this completely editable template. It is available for immediate download depending on the needs and requirements of the user.
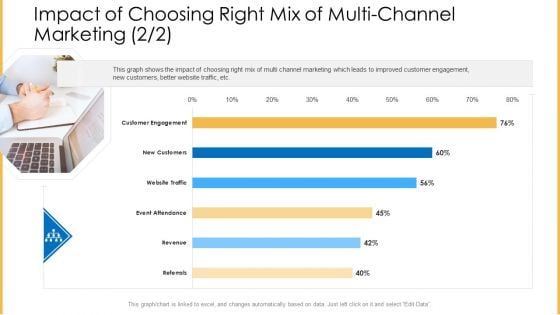
Amalgamation Marketing Pitch Deck Impact Of Choosing Right Mix Of Multi Channel Marketing Customer Diagrams PDF
This graph shows the impact of choosing right mix of multi channel marketing which leads to improved customer engagement, new customers, better website traffic, etc. Deliver and pitch your topic in the best possible manner with this amalgamation marketing pitch deck impact of choosing right mix of multi channel marketing customer diagrams pdf. Use them to share invaluable insights on engagement, website, traffic, revenue, referrals and impress your audience. This template can be altered and modified as per your expectations. So, grab it now.
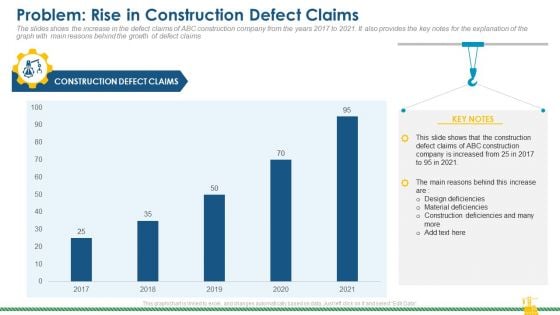
Rising Construction Defect Claims Against The Corporation Problem Rise In Construction Defect Claims Diagrams PDF
The slides shows the increase in the defect claims of ABC construction company from the years 2017 to 2021. It also provides the key notes for the explanation of the graph with main reasons behind the growth of defect claims. Deliver and pitch your topic in the best possible manner with this rising construction defect claims against the corporation problem rise in construction defect claims diagrams pdf. Use them to share invaluable insights on defect, claims, material deficiencies, design deficiencies and impress your audience. This template can be altered and modified as per your expectations. So, grab it now.
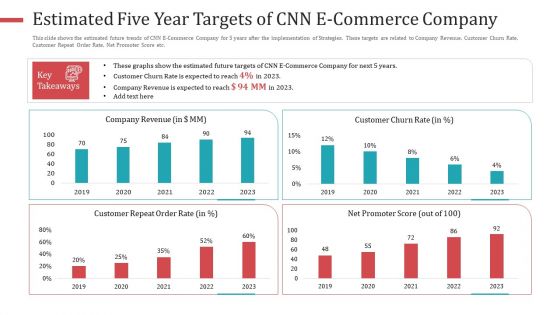
Estimated Five Year Targets Of CNN E Commerce Company Diagrams PDF
This slide shows the estimated future trends of CNN E Commerce Company for 5 years after the implementation of Strategies. These targets are related to Company Revenue, Customer Churn Rate, Customer Repeat Order Rate, Net Promoter Score etc. Deliver and pitch your topic in the best possible manner with this estimated five year targets of CNN e commerce company diagrams pdf. Use them to share invaluable insights on company revenue, customer repeat order rate, net promoter score, 2019 to 2023 and impress your audience. This template can be altered and modified as per your expectations. So, grab it now.
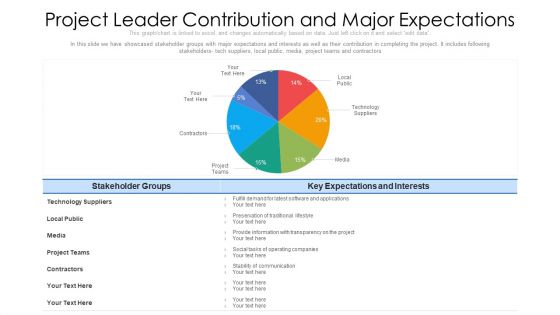
Project Leader Contribution And Major Expectations Ppt PowerPoint Presentation File Diagrams PDF
In this slide we have showcased stakeholder groups with major expectations and interests as well as their contribution in completing the project. It includes following stakeholders- tech suppliers, local public, media, project teams and contractors. Pitch your topic with ease and precision using this project leader contribution and major expectations ppt powerpoint presentation file diagrams pdf. This layout presents information on technology, media, contractors. It is also available for immediate download and adjustment. So, changes can be made in the color, design, graphics or any other component to create a unique layout.
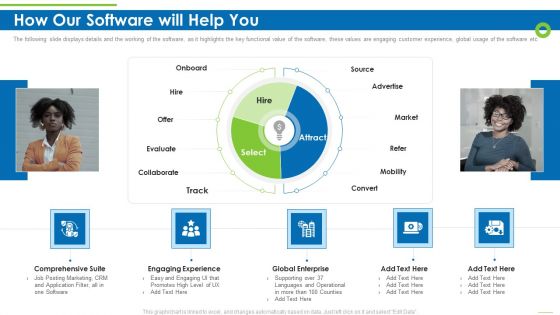
Enterprise Recruitment Industries Investor Fund Raising How Our Software Will Help You Diagrams PDF
The following slide displays details and the working of the software, as it highlights the key functional value of the software, these values are engaging customer experience, global usage of the software etc Deliver an awe inspiring pitch with this creative enterprise recruitment industries investor fund raising how our software will help you diagrams pdf bundle. Topics like comprehensive suite, engaging experience, global enterprise can be discussed with this completely editable template. It is available for immediate download depending on the needs and requirements of the user.
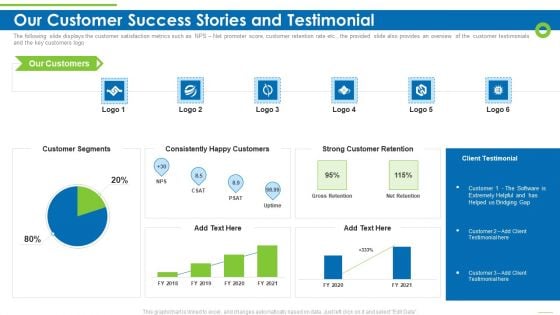
Enterprise Recruitment Industries Investor Fund Raising Our Customer Success Stories And Testimonial Diagrams PDF
The following slide displays the customer satisfaction metrics such as NPS Net promoter score, customer retention rate etc., the provided slide also provides an overview of the customer testimonials and the key customers logo Deliver an awe inspiring pitch with this creative enterprise recruitment industries investor fund raising our customer success stories and testimonial diagrams pdf bundle. Topics like customer segments, consistently happy customers, strong customer retention can be discussed with this completely editable template. It is available for immediate download depending on the needs and requirements of the user.
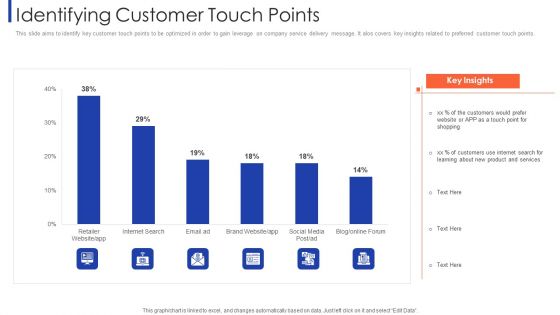
Customer Relationship Strategy For Building Loyalty Identifying Customer Touch Points Diagrams PDF
This slide aims to identify key customer touch points to be optimized in order to gain leverage on company service delivery message. It alos covers key insights related to preferred customer touch points. Deliver an awe inspiring pitch with this creative customer relationship strategy for building loyalty identifying customer touch points diagrams pdf bundle. Topics like retailer website, internet search, brand website, social media can be discussed with this completely editable template. It is available for immediate download depending on the needs and requirements of the user.
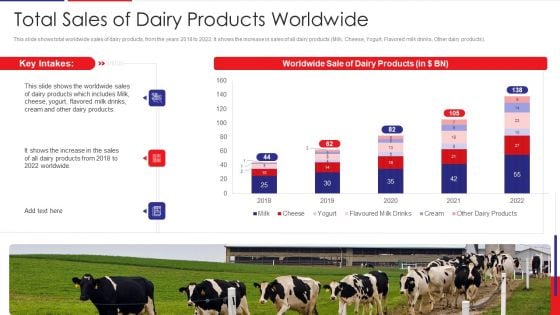
Examination Of Buyer Mindset Towards Dairy Products Total Sales Of Dairy Products Worldwide Diagrams PDF
This slide shows total worldwide sales of dairy products, from the years 2018 to 2022. It shows the increase in sales of all dairy products Milk, Cheese, Yogurt, Flavored milk drinks, Other dairy products. Deliver and pitch your topic in the best possible manner with this examination of buyer mindset towards dairy products total sales of dairy products worldwide diagrams pdf. Use them to share invaluable insights on total sales of dairy products worldwide and impress your audience. This template can be altered and modified as per your expectations. So, grab it now.
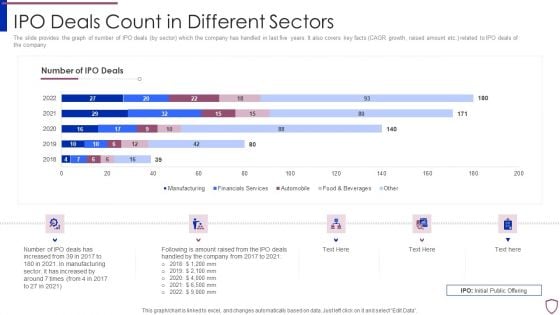
Financing Catalogue For Security Underwriting Agreement IPO Deals Count In Different Sectors Diagrams PDF
The slide provides the graph of number of IPO deals by sector which the company has handled in last five years. It also covers key facts CAGR growth, raised amount etc. related to IPO deals of the company. Deliver an awe inspiring pitch with this creative financing catalogue for security underwriting agreement ipo deals count in different sectors diagrams pdf bundle. Topics like manufacturing, financial services, automobile, food and beverages can be discussed with this completely editable template. It is available for immediate download depending on the needs and requirements of the user.
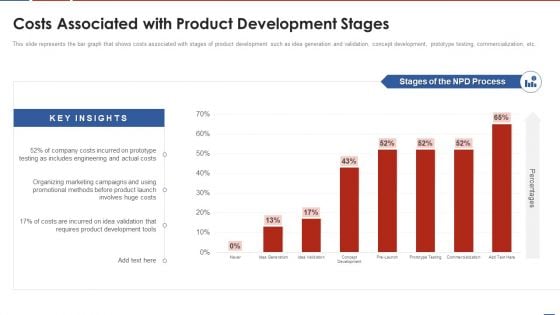
Formulating Product Development Action Plan To Enhance Client Experience Costs Associated With Product Diagrams PDF
This slide represents the bar graph that shows costs associated with stages of product development such as idea generation and validation, concept development, prototype testing, commercialization, etc. Deliver and pitch your topic in the best possible manner with this formulating product development action plan to enhance client experience costs associated with product diagrams pdf. Use them to share invaluable insights on development, costs, organizing, marketing, campaigns and impress your audience. This template can be altered and modified as per your expectations. So, grab it now.
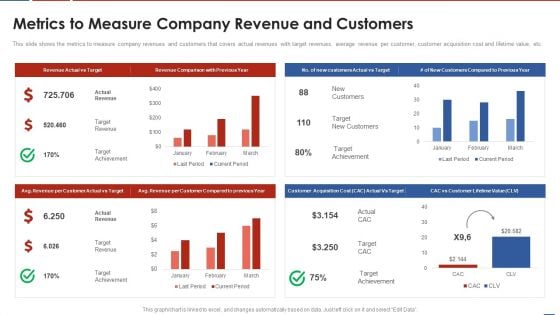
Formulating Product Development Action Plan To Enhance Client Experience Metrics To Measure Company Diagrams PDF
This slide shows the metrics to measure company revenues and customers that covers actual revenues with target revenues, average revenue per customer, customer acquisition cost and lifetime value, etc. Deliver and pitch your topic in the best possible manner with this formulating product development action plan to enhance client experience metrics to measure company diagrams pdf. Use them to share invaluable insights on target revenues, average revenue per customer, customer acquisition cost, lifetime value and impress your audience. This template can be altered and modified as per your expectations. So, grab it now.
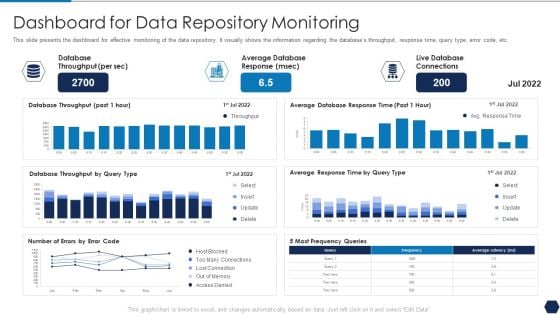
Tactical Plan For Upgrading DBMS Dashboard For Data Repository Monitoring Diagrams PDF
This slide presents the dashboard for effective monitoring of the data repository. It visually shows the information regarding the databases throughput, response time, query type, error code, etc. Deliver and pitch your topic in the best possible manner with this tactical plan for upgrading dbms dashboard for data repository monitoring diagrams pdf. Use them to share invaluable insights on database throughput, average database response, live database connections and impress your audience. This template can be altered and modified as per your expectations. So, grab it now.
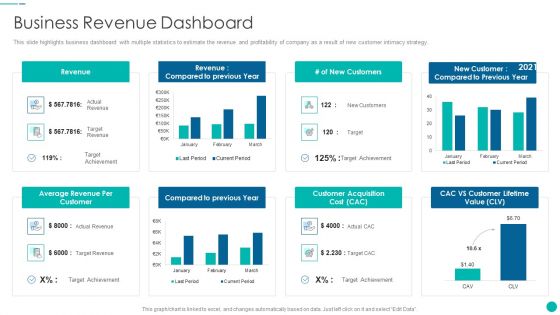
Tactical Procedure For Increasing Customer Intimacy Business Revenue Dashboard Diagrams PDF
This slide highlights business dashboard with multiple statistics to estimate the revenue and profitability of company as a result of new customer intimacy strategy. Deliver an awe inspiring pitch with this creative tactical procedure for increasing customer intimacy business revenue dashboard diagrams pdf bundle. Topics like average revenue per customer, compared to previous year, customer acquisition cost, cac vs customer lifetime value, revenue can be discussed with this completely editable template. It is available for immediate download depending on the needs and requirements of the user.
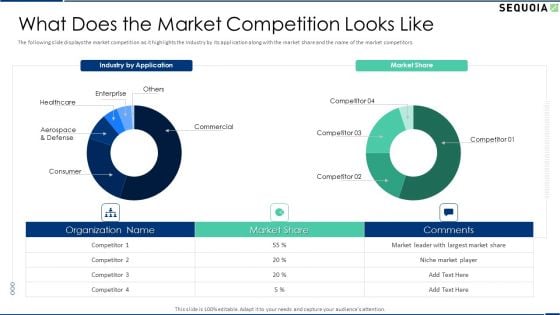
Sequoia Company Capital Raising Elevator What Does The Market Competition Looks Like Diagrams PDF
The following slide displays the market competition as it highlights the Industry by its application along with the market share and the name of the market competitors. Deliver and pitch your topic in the best possible manner with this sequoia company capital raising elevator what does the market competition looks like diagrams pdf. Use them to share invaluable insights on enterprise, commercial, consumer, market share and impress your audience. This template can be altered and modified as per your expectations. So, grab it now.
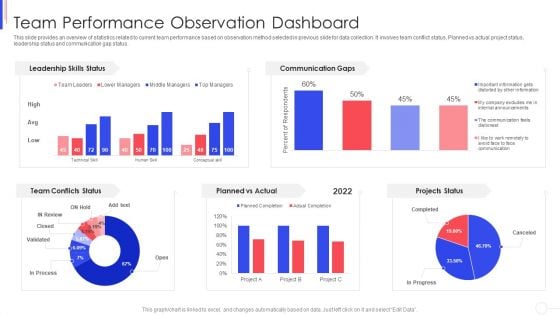
Strategy To Improve Team Proficiency Team Performance Observation Dashboard Diagrams PDF
This slide provides an overview of statistics related to current team performance based on observation method selected in previous slide for data collection. It involves team conflict status, Planned vs actual project status, leadership status and communication gap status. Deliver an awe inspiring pitch with this creative proficiency team performance observation dashboard diagrams pdf bundle. Topics like team performance observation dashboard can be discussed with this completely editable template. It is available for immediate download depending on the needs and requirements of the user.
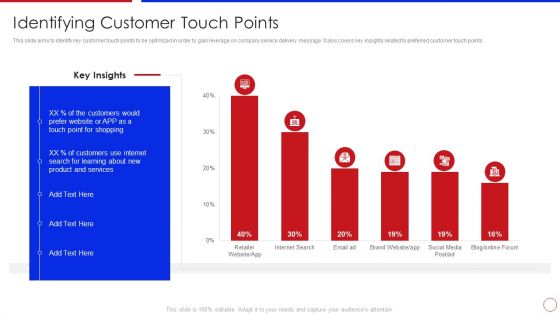
Strategy To Enhance Buyer Intimacy Identifying Customer Touch Points Ppt Infographics Diagrams PDF
This slide aims to identify key customer touch points to be optimized in order to gain leverage on company service delivery message. It alos covers key insights related to preferred customer touch points. Deliver and pitch your topic in the best possible manner with this strategy to enhance buyer intimacy identifying customer touch points ppt infographics diagrams pdf. Use them to share invaluable insights on identifying customer touch points and impress your audience. This template can be altered and modified as per your expectations. So, grab it now.
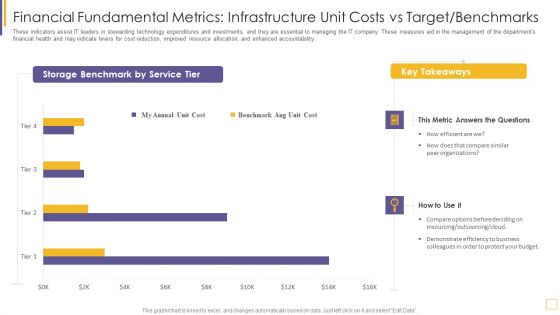
Guidelines For Exhibiting Business Value Of Information And Technology Financial Fundamental Metrics Diagrams PDF
This template covers fundamental financial metrics IT spend vs Plan for both opex and capex budgets, and application and service total cost, which aligns business value communication to IT values. Deliver and pitch your topic in the best possible manner with this guidelines for exhibiting business value of information and technology financial fundamental metrics diagrams pdf. Use them to share invaluable insights on metric, budget, accountability, planned and impress your audience. This template can be altered and modified as per your expectations. So, grab it now.
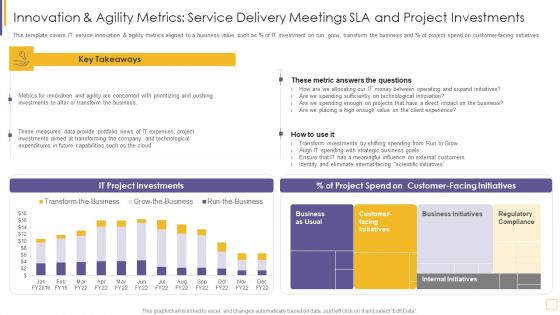
Guidelines For Exhibiting Business Value Of Information And Technology Innovation And Agility Metrics Diagrams PDF
This template covers IT service innovation and agility metrics aligned to a business value such as percentage of IT investment on run, grow, transform the business and percentage of project spend on customer facing initiatives. Deliver an awe inspiring pitch with this creative guidelines for exhibiting business value of information and technology innovation and agility metrics diagrams pdf bundle. Topics like measures, investments, expenses, technological, capabilities can be discussed with this completely editable template. It is available for immediate download depending on the needs and requirements of the user.
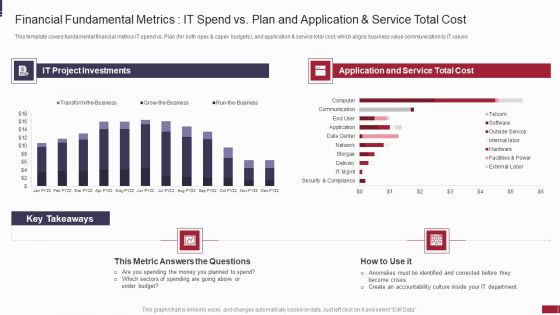
IT Value Story Significant To Corporate Leadership Financial Fundamental Metrics Diagrams PDF
These indicators assist IT leaders in stewarding technology expenditures and investments, and they are essential to managing the IT company. These measures aid in the management of the departments financial health and may indicate levers for cost reduction, improved resource allocation, and enhanced accountability. Deliver and pitch your topic in the best possible manner with this it value story significant to corporate leadership financial fundamental metrics diagrams pdf. Use them to share invaluable insights on organizations, budget, metric, cost and impress your audience. This template can be altered and modified as per your expectations. So, grab it now.
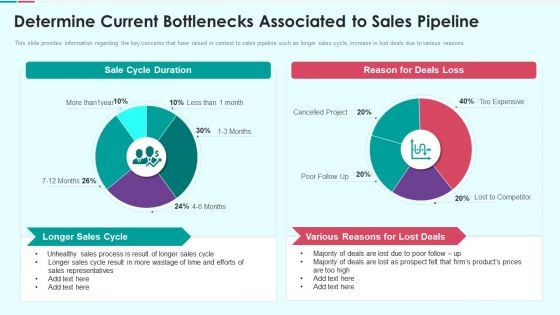
Sales Funnel Management For Revenue Generation Determine Current Bottlenecks Diagrams PDF
This slide provides information regarding the key concerns that have raised in context to sales pipeline such as longer sales cycle, increase in lost deals due to various reasons. Deliver and pitch your topic in the best possible manner with this sales funnel management for revenue generation determine current bottlenecks diagrams pdf Use them to share invaluable insights on longer sales cycle, various reasons for lost deals, sales representatives and impress your audience. This template can be altered and modified as per your expectations. So, grab it now.
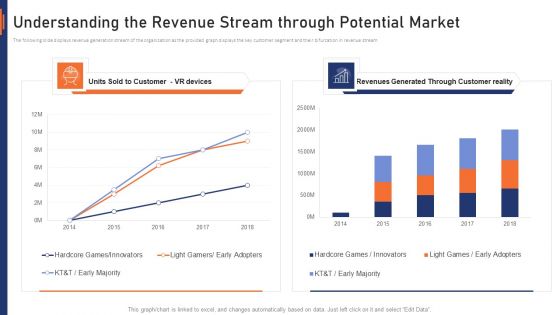
VR Market Capital Raising Elevator Pitch Deck Understanding The Revenue Stream Through Potential Market Diagrams PDF
The following slide displays revenue generation stream of the organization as the provided graph displays the key customer segment and their bifurcation in revenue stream. Deliver and pitch your topic in the best possible manner with this vr market capital raising elevator pitch deck understanding the revenue stream through potential market diagrams pdf. Use them to share invaluable insights on understanding the revenue stream through potential market and impress your audience. This template can be altered and modified as per your expectations. So, grab it now.
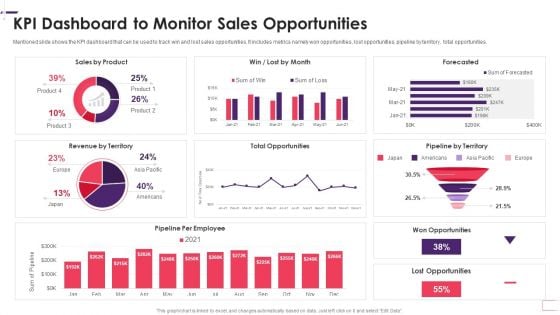
Enhancing Stp Strategies For A Successful Market Promotion Kpi Dashboard To Monitor Diagrams PDF
Mentioned slide shows the KPI dashboard that can be used to track win and lost sales opportunities. It includes metrics namely won opportunities, lost opportunities, pipeline by territory, total opportunities. Deliver and pitch your topic in the best possible manner with this enhancing stp strategies for a successful market promotion kpi dashboard to monitor diagrams pdf. Use them to share invaluable insights on kpi dashboard to monitor sales opportunities and impress your audience. This template can be altered and modified as per your expectations. So, grab it now.
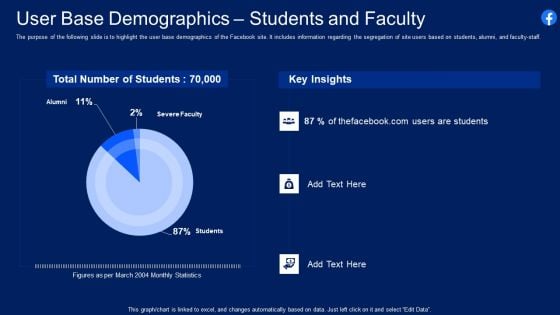
Facebook Original Capital Funding User Base Demographics Students And Faculty Diagrams PDF
The purpose of the following slide is to highlight the user base demographics of the Facebook site. It includes information regarding the segregation of site users based on students, alumni, and faculty staff. Deliver an awe inspiring pitch with this creative facebook original capital funding user base demographics students and faculty diagrams pdf bundle. Topics like user base demographics students and faculty can be discussed with this completely editable template. It is available for immediate download depending on the needs and requirements of the user.
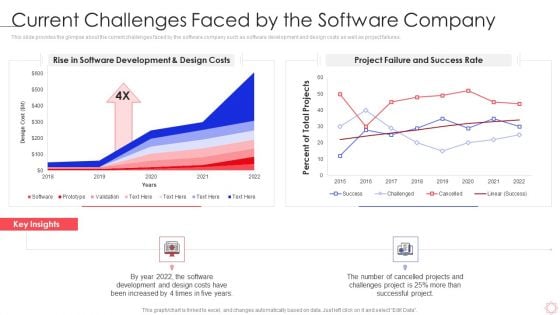
SPI Methodology Current Challenges Faced By The Software Company Ppt PowerPoint Presentation Diagram Templates PDF
This slide provides the glimpse about the current challenges faced by the software company such as software development and design costs as well as project failures. Deliver an awe inspiring pitch with this creative spi methodology current challenges faced by the software company ppt powerpoint presentation diagram templates pdf bundle. Topics like project failure and success rate, rise in software development can be discussed with this completely editable template. It is available for immediate download depending on the needs and requirements of the user.
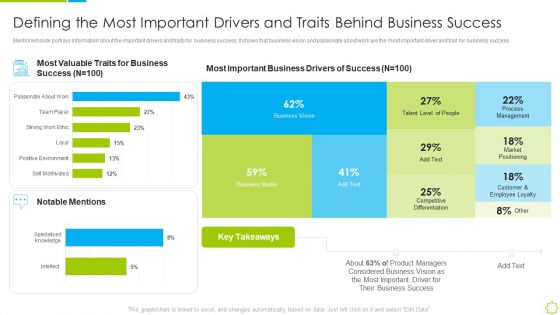
Launch New Sales Enablement Program Lead Generation Defining The Most Important Drivers Diagrams PDF
Mentioned slide portrays information about the important drivers and traits for business success. It shows that business vision and passionate about work are the most important driver and trait for business success. Deliver an awe inspiring pitch with this creative launch new sales enablement program lead generation defining the most important drivers diagrams pdf bundle. Topics like defining the most important drivers and traits behind business success can be discussed with this completely editable template. It is available for immediate download depending on the needs and requirements of the user.
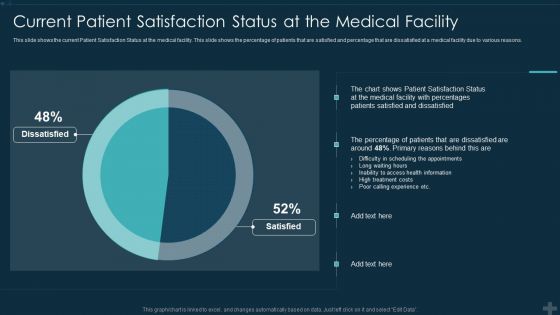
Application Patient Satisfaction Tactics Enhance Clinical Results Current Patient Satisfaction Status Diagrams PDF
This slide shows the current Patient Satisfaction Status at the medical facility. This slide shows the percentage of patients that are satisfied and percentage that are dissatisfied at a medical facility due to various reasons. Deliver an awe inspiring pitch with this creative application patient satisfaction tactics enhance clinical results current patient satisfaction status diagrams pdf bundle. Topics like current patient satisfaction status at the medical facility can be discussed with this completely editable template. It is available for immediate download depending on the needs and requirements of the user.


 Continue with Email

 Home
Home


