Phases
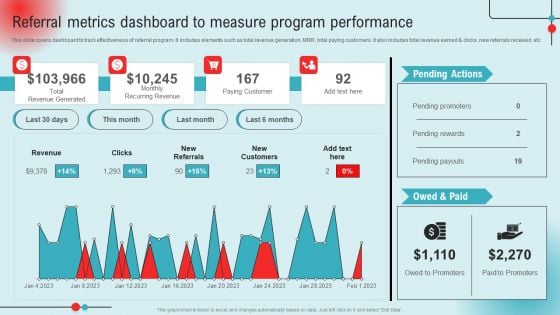
Referral Metrics Dashboard To Measure Program Performance Ppt PowerPoint Presentation Diagram Lists PDF
This slide covers dashboard to track effectiveness of referral program. It includes elements such as total revenue generation, MRR, total paying customers. It also includes total revenue earned and clicks, new referrals received, etc. This Referral Metrics Dashboard To Measure Program Performance Ppt PowerPoint Presentation Diagram Lists PDF from Slidegeeks makes it easy to present information on your topic with precision. It provides customization options, so you can make changes to the colors, design, graphics, or any other component to create a unique layout. It is also available for immediate download, so you can begin using it right away. Slidegeeks has done good research to ensure that you have everything you need to make your presentation stand out. Make a name out there for a brilliant performance.
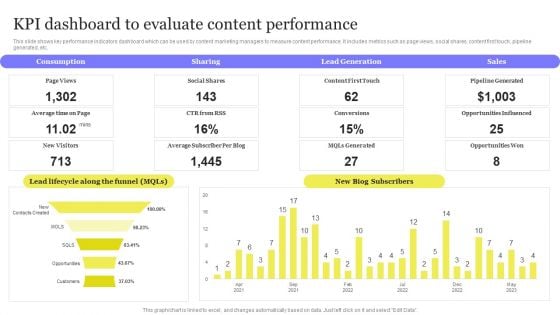
Enhancing Digital Visibility Using SEO Content Strategy KPI Dashboard To Evaluate Content Performance Diagrams PDF
This slide shows key performance indicators dashboard which can be used by content marketing managers to measure content performance. It includes metrics such as page views, social shares, content first touch, pipeline generated, etc. This modern and well arranged Enhancing Digital Visibility Using SEO Content Strategy KPI Dashboard To Evaluate Content Performance Diagrams PDF provides lots of creative possibilities. It is very simple to customize and edit with the Powerpoint Software. Just drag and drop your pictures into the shapes. All facets of this template can be edited with Powerpoint no extra software is necessary. Add your own material, put your images in the places assigned for them, adjust the colors, and then you can show your slides to the world, with an animated slide included.
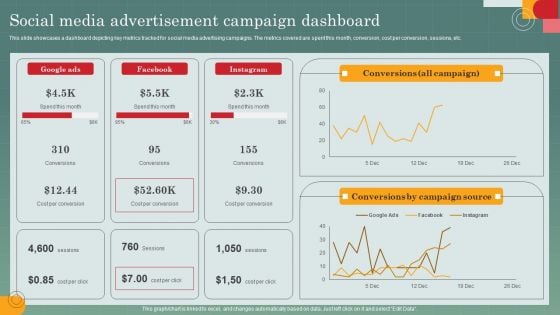
Advertising Programs Management Techniques Social Media Advertisement Campaign Dashboard Diagrams PDF
This slide showcases a dashboard depicting key metrics tracked for social media advertising campaigns. The metrics covered are spent this month, conversion, cost per conversion, sessions, etc. This modern and well arranged Advertising Programs Management Techniques Social Media Advertisement Campaign Dashboard Diagrams PDF provides lots of creative possibilities. It is very simple to customize and edit with the Powerpoint Software. Just drag and drop your pictures into the shapes. All facets of this template can be edited with Powerpoint no extra software is necessary. Add your own material, put your images in the places assigned for them, adjust the colors, and then you can show your slides to the world, with an animated slide included.
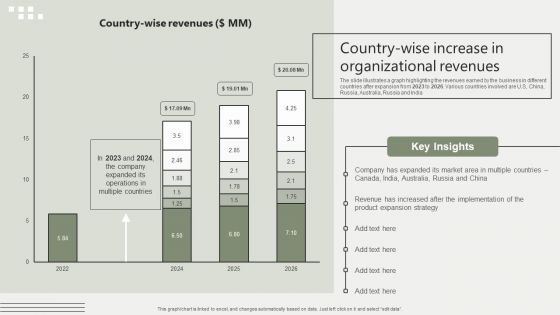
Global Business Market Development Guide Country Wise Increase In Organizational Revenues Diagrams PDF
The slide illustrates a graph highlighting the revenues earned by the business in different countries after expansion from 2023 to 2026. Various countries involved are U.S, China, Russia, Australia, Russia and India Are you in need of a template that can accommodate all of your creative concepts This one is crafted professionally and can be altered to fit any style. Use it with Google Slides or PowerPoint. Include striking photographs, symbols, depictions, and other visuals. Fill, move around, or remove text boxes as desired. Test out color palettes and font mixtures. Edit and save your work, or work with colleagues. Download Global Business Market Development Guide Country Wise Increase In Organizational Revenues Diagrams PDF and observe how to make your presentation outstanding. Give an impeccable presentation to your group and make your presentation unforgettable.
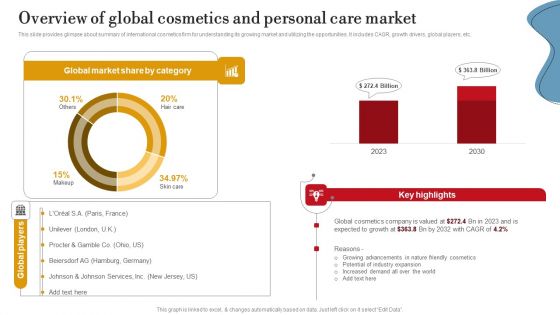
Overview Of Global Cosmetics And Personal Care Market Ppt PowerPoint Presentation Diagram Images PDF
This slide provides glimpse about summary of international cosmetics firm for understanding its growing market and utilizing the opportunities. It includes CAGR, growth drivers, global players, etc. Are you in need of a template that can accommodate all of your creative concepts This one is crafted professionally and can be altered to fit any style. Use it with Google Slides or PowerPoint. Include striking photographs, symbols, depictions, and other visuals. Fill, move around, or remove text boxes as desired. Test out color palettes and font mixtures. Edit and save your work, or work with colleagues. Download Overview Of Global Cosmetics And Personal Care Market Ppt PowerPoint Presentation Diagram Images PDF and observe how to make your presentation outstanding. Give an impeccable presentation to your group and make your presentation unforgettable.
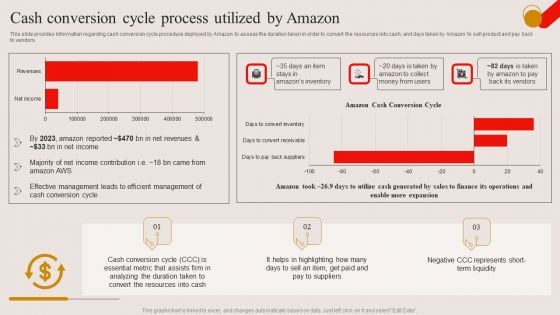
Cash Conversion Cycle Process Utilized By Amazon Ppt PowerPoint Presentation Diagram Images PDF
This slide provides information regarding cash conversion cycle procedure deployed by Amazon to assess the duration taken in order to convert the resources into cash, and days taken by Amazon to sell product and pay back to vendors. Present like a pro with Cash Conversion Cycle Process Utilized By Amazon Ppt PowerPoint Presentation Diagram Images PDF Create beautiful presentations together with your team, using our easy to use presentation slides. Share your ideas in real time and make changes on the fly by downloading our templates. So whether you are in the office, on the go, or in a remote location, you can stay in sync with your team and present your ideas with confidence. With Slidegeeks presentation got a whole lot easier. Grab these presentations today.
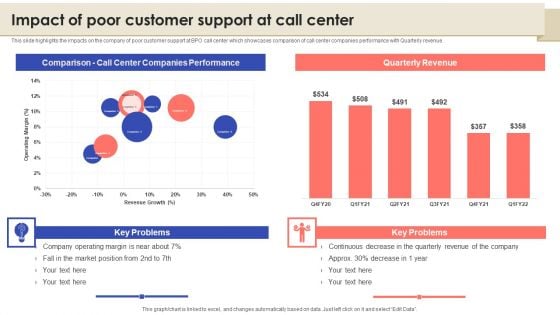
Call Center Quality Enhancement Plan Impact Of Poor Customer Support At Call Center Diagrams PDF
This slide highlights the impacts on the company of poor customer support at BPO call center which showcases comparison of call center companies performance with Quarterly revenue. This Call Center Quality Enhancement Plan Impact Of Poor Customer Support At Call Center Diagrams PDF from Slidegeeks makes it easy to present information on your topic with precision. It provides customization options, so you can make changes to the colors, design, graphics, or any other component to create a unique layout. It is also available for immediate download, so you can begin using it right away. Slidegeeks has done good research to ensure that you have everything you need to make your presentation stand out. Make a name out there for a brilliant performance.
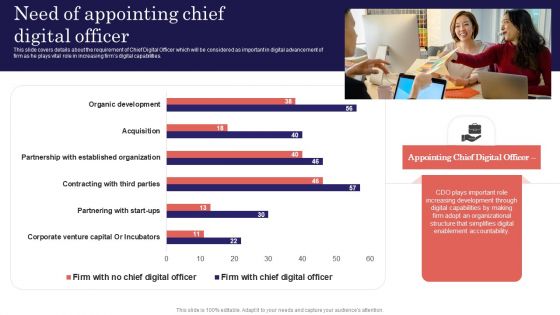
Digitalized Business Checklist Need Of Appointing Chief Digital Officer Diagrams PDF
This slide covers details about the requirement of Chief Digital Officer which will be considered as important in digital advancement of firm as he plays vital role in increasing firms digital capabilities. The Digitalized Business Checklist Need Of Appointing Chief Digital Officer Diagrams PDF is a compilation of the most recent design trends as a series of slides. It is suitable for any subject or industry presentation, containing attractive visuals and photo spots for businesses to clearly express their messages. This template contains a variety of slides for the user to input data, such as structures to contrast two elements, bullet points, and slides for written information. Slidegeeks is prepared to create an impression.

Assessing Impact Of Sales Risk Management With Kpi Dashboard Diagrams PDF
The following slide highlights some key performance indicators KPIs to measure the influence of executing sales risk management strategies on revenue performance. It includes elements such as target attainment rate, gross profit, annual growth rate etc. Boost your pitch with our creative Assessing Impact Of Sales Risk Management With Kpi Dashboard Diagrams PDF. Deliver an awe inspiring pitch that will mesmerize everyone. Using these presentation templates you will surely catch everyones attention. You can browse the ppts collection on our website. We have researchers who are experts at creating the right content for the templates. So you do not have to invest time in any additional work. Just grab the template now and use them.
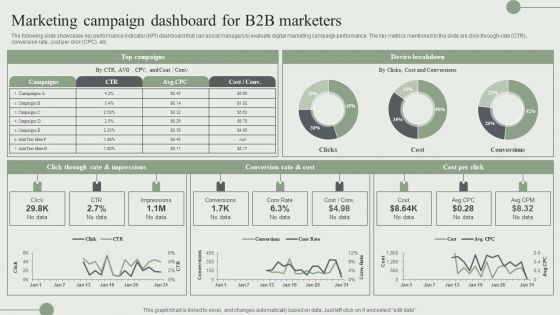
Marketing Campaign Dashboard For B2B Marketers Ppt PowerPoint Presentation File Diagrams PDF
The following slide showcases key performance indicator KPI dashboard that can assist managers to evaluate digital marketing campaign performance. The key metrics mentioned in the slide are click-through-rate CTR, conversion rate, cost per click CPC, etc. Present like a pro with Marketing Campaign Dashboard For B2B Marketers Ppt PowerPoint Presentation File Diagrams PDF Create beautiful presentations together with your team, using our easy to use presentation slides. Share your ideas in real time and make changes on the fly by downloading our templates. So whether you are in the office, on the go, or in a remote location, you can stay in sync with your team and present your ideas with confidence. With Slidegeeks presentation got a whole lot easier. Grab these presentations today.
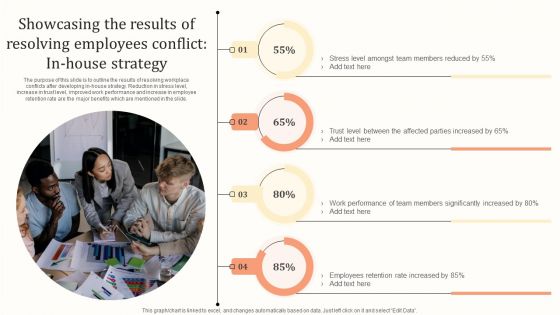
Showcasing The Results Of Resolving Employees Conflict In House Strategy Diagrams PDF
The purpose of this slide is to outline the results of resolving workplace conflicts after developing in-house strategy. Reduction in stress level, increase in trust level, improved work performance and increase in employee retention rate are the major benefits which are mentioned in the slide. Take your projects to the next level with our ultimate collection of Showcasing The Results Of Resolving Employees Conflict In House Strategy Diagrams PDF. Slidegeeks has designed a range of layouts that are perfect for representing task or activity duration, keeping track of all your deadlines at a glance. Tailor these designs to your exact needs and give them a truly corporate look with your own brand colors they will make your projects stand out from the rest.
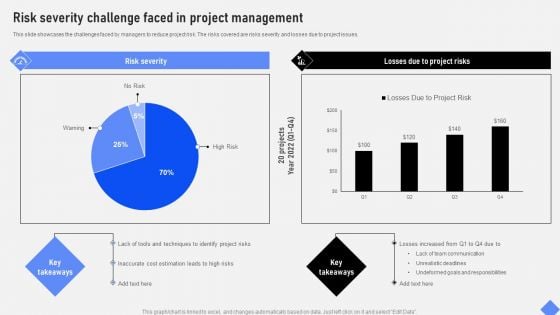
Effective Business Project Risk Mitigation Plan Risk Severity Challenge Faced In Project Management Diagrams PDF
This slide showcases the challenges faced by managers to reduce project risk. The risks covered are risks severity and losses due to project issues. This Effective Business Project Risk Mitigation Plan Risk Severity Challenge Faced In Project Management Diagrams PDF from Slidegeeks makes it easy to present information on your topic with precision. It provides customization options, so you can make changes to the colors, design, graphics, or any other component to create a unique layout. It is also available for immediate download, so you can begin using it right away. Slidegeeks has done good research to ensure that you have everything you need to make your presentation stand out. Make a name out there for a brilliant performance.
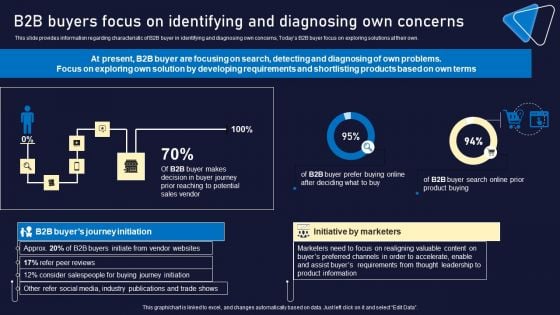
B2B Buyers Focus On Identifying And Diagnosing Own Concerns Diagrams PDF
This slide provides information regarding characteristic of B2B buyer in identifying and diagnosing own concerns, Todays B2B buyer focus on exploring solutions at their own. Are you in need of a template that can accommodate all of your creative concepts This one is crafted professionally and can be altered to fit any style. Use it with Google Slides or PowerPoint. Include striking photographs, symbols, depictions, and other visuals. Fill, move around, or remove text boxes as desired. Test out color palettes and font mixtures. Edit and save your work, or work with colleagues. Download B2B Buyers Focus On Identifying And Diagnosing Own Concerns Diagrams PDF and observe how to make your presentation outstanding. Give an impeccable presentation to your group and make your presentation unforgettable.
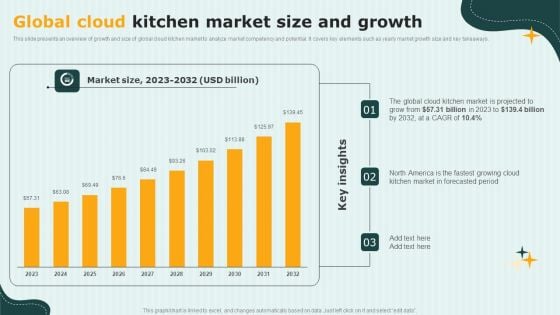
International Cloud Kitchen Industry Analysis Global Cloud Kitchen Market Size And Growth Diagrams PDF
This slide presents an overview of growth and size of global cloud kitchen market to analyze market competency and potential. It covers key elements such as yearly market growth size and key takeaways. This modern and well-arranged International Cloud Kitchen Industry Analysis Global Cloud Kitchen Market Size And Growth Diagrams PDF provides lots of creative possibilities. It is very simple to customize and edit with the Powerpoint Software. Just drag and drop your pictures into the shapes. All facets of this template can be edited with Powerpoint, no extra software is necessary. Add your own material, put your images in the places assigned for them, adjust the colors, and then you can show your slides to the world, with an animated slide included.
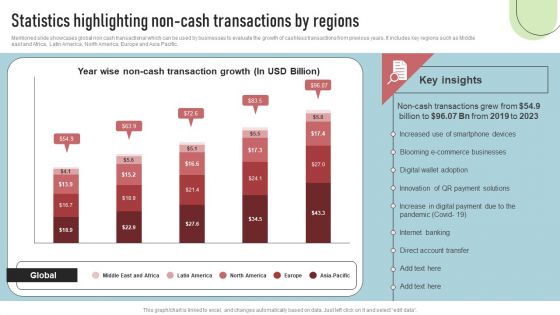
Cashless Payment Strategies To Enhance Business Performance Statistics Highlighting Non Cash Transactions Diagrams PDF
Mentioned slide showcases global non cash transactional which can be used by businesses to evaluate the growth of cashless transactions from previous years. It includes key regions such as Middle east and Africa, Latin America, North America, Europe and Asia Pacific. Want to ace your presentation in front of a live audience Our Cashless Payment Strategies To Enhance Business Performance Statistics Highlighting Non Cash Transactions Diagrams PDF can help you do that by engaging all the users towards you.. Slidegeeks experts have put their efforts and expertise into creating these impeccable powerpoint presentations so that you can communicate your ideas clearly. Moreover, all the templates are customizable, and easy-to-edit and downloadable. Use these for both personal and commercial use.

Regenerative Artificial Intelligence Systems Impact Of Chatgpt On Artificial Intelligence Tokens Diagrams PDF
This slide depicts the change in the prices of five artificial intelligence tokens after the launch of OpenAIs ChatGPT model. These artificial intelligence tokens are DeepBrain Chain, Numeraire, Fetch.ai, SingularityNET, and Alethea Artificial Liquid Intelligence. Coming up with a presentation necessitates that the majority of the effort goes into the content and the message you intend to convey. The visuals of a PowerPoint presentation can only be effective if it supplements and supports the story that is being told. Keeping this in mind our experts created Regenerative Artificial Intelligence Systems Impact Of Chatgpt On Artificial Intelligence Tokens Diagrams PDF to reduce the time that goes into designing the presentation. This way, you can concentrate on the message while our designers take care of providing you with the right template for the situation.
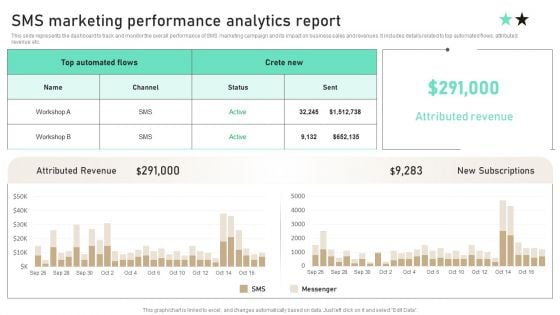
SMS Marketing Performance Analytics Report Ppt PowerPoint Presentation Diagram Templates PDF
This slide represents the dashboard to track and monitor the overall performance of SMS marketing campaign and its impact on business sales and revenues. It includes details related to top automated flows, attributed revenue etc. Slidegeeks is here to make your presentations a breeze with SMS Marketing Performance Analytics Report Ppt PowerPoint Presentation Diagram Templates PDF With our easy to use and customizable templates, you can focus on delivering your ideas rather than worrying about formatting. With a variety of designs to choose from, you are sure to find one that suits your needs. And with animations and unique photos, illustrations, and fonts, you can make your presentation pop. So whether you are giving a sales pitch or presenting to the board, make sure to check out Slidegeeks first.
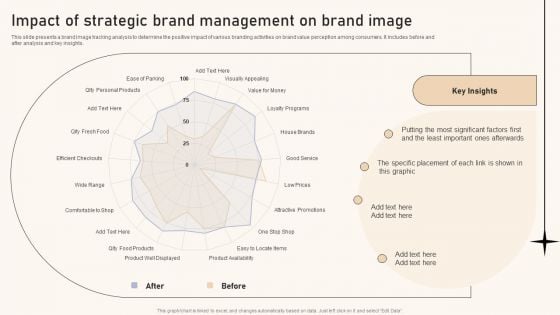
Optimizing Brand Equity Through Strategic Management Impact Of Strategic Brand Management On Brand Image Diagrams PDF
This slide presents a brand image tracking analysis to determine the positive impact of various branding activities on brand value perception among consumers. It includes before and after analysis and key insights. Coming up with a presentation necessitates that the majority of the effort goes into the content and the message you intend to convey. The visuals of a PowerPoint presentation can only be effective if it supplements and supports the story that is being told. Keeping this in mind our experts created Optimizing Brand Equity Through Strategic Management Impact Of Strategic Brand Management On Brand Image Diagrams PDF to reduce the time that goes into designing the presentation. This way, you can concentrate on the message while our designers take care of providing you with the right template for the situation.
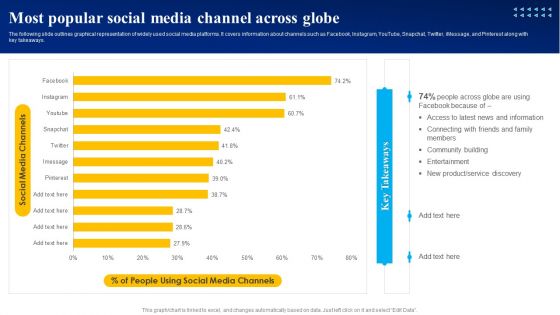
Most Popular Social Media Channel Across Globe Ppt PowerPoint Presentation Diagram Lists PDF
The following slide outlines graphical representation of widely used social media platforms. It covers information about channels such as Facebook, Instagram, YouTube, Snapchat, Twitter, iMessage, and Pinterest along with key takeaways. Slidegeeks is here to make your presentations a breeze with Most Popular Social Media Channel Across Globe Ppt PowerPoint Presentation Diagram Lists PDF With our easy to use and customizable templates, you can focus on delivering your ideas rather than worrying about formatting. With a variety of designs to choose from, you are sure to find one that suits your needs. And with animations and unique photos, illustrations, and fonts, you can make your presentation pop. So whether you are giving a sales pitch or presenting to the board, make sure to check out Slidegeeks first.
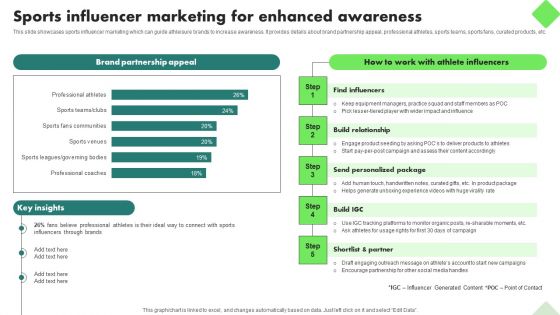
Fitness Product Promotion Campaigns Sports Influencer Marketing For Enhanced Awareness Diagrams PDF
This slide showcases sports influencer marketing which can guide athleisure brands to increase awareness. It provides details about brand partnership appeal, professional athletes, sports teams, sports fans, curated products, etc. Slidegeeks is one of the best resources for PowerPoint templates. You can download easily and regulate Fitness Product Promotion Campaigns Sports Influencer Marketing For Enhanced Awareness Diagrams PDF for your personal presentations from our wonderful collection. A few clicks is all it takes to discover and get the most relevant and appropriate templates. Use our Templates to add a unique zing and appeal to your presentation and meetings. All the slides are easy to edit and you can use them even for advertisement purposes.
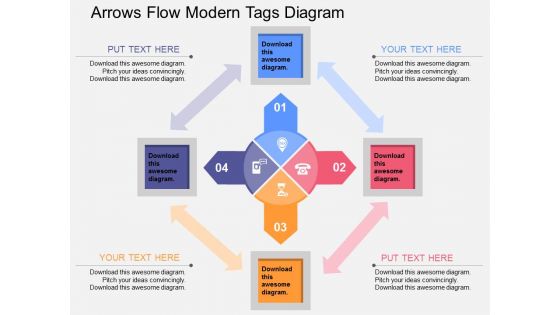
Arrows Flow Modern Tags Diagram Powerpoint Template
Modern tags with icons diagram has been used to design this power point template. This business diagram contains the concept of idea, deal, planning and process. Use this diagram for business and marketing related presentations.
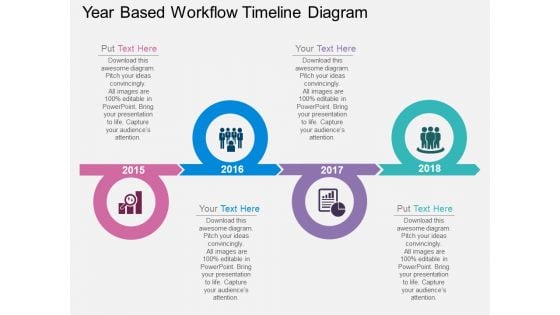
Year Based Workflow Timeline Diagram Powerpoint Template
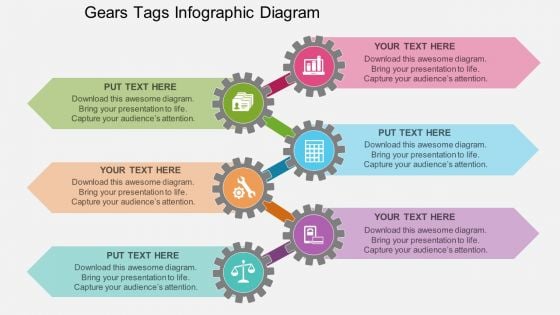
Gears Tags Infographic Diagram Powerpoint Template
Develop competitive advantage with our above template which contains a diagram of gears with icons. This gears infographic diagram may be used to depict concepts of quality and productivity. This diagram provides an effective way of displaying business information.
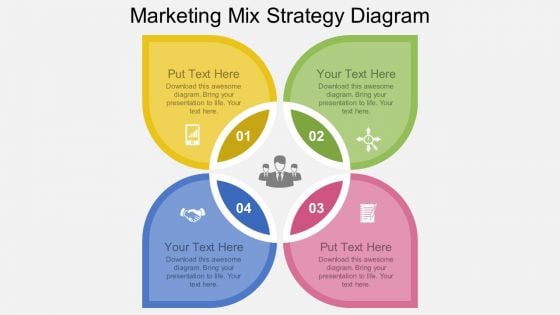
Marketing Mix Strategy Diagram Powerpoint Template

Beautiful Theme For Artistic Presentation PowerPoint Templates Ppt Backgrounds For Slides 0413
We present our Beautiful Theme For Artistic Presentation PowerPoint Templates PPT Backgrounds For Slides 0413.Use our Environment PowerPoint Templates because It will get your audience in sync. Download and present our Nature PowerPoint Templates because You can Be the star of the show with our PowerPoint Templates and Slides. Rock the stage with your ideas. Use our Success PowerPoint Templates because You aspire to touch the sky with glory. Let our PowerPoint Templates and Slides provide the fuel for your ascent. Present our Future PowerPoint Templates because our PowerPoint Templates and Slides are the string of your bow. Fire of your ideas and conquer the podium. Download and present our Business PowerPoint Templates because You can Raise a toast with our PowerPoint Templates and Slides. Spread good cheer amongst your audience.Use these PowerPoint slides for presentations relating to Beautiful multicolor background theme, environment, nature, success, future, business. The prominent colors used in the PowerPoint template are Orange, White, Purple. Conquer fatigue with our Beautiful Theme For Artistic Presentation PowerPoint Templates Ppt Backgrounds For Slides 0413. They are like a deep breath.
Icon For Product Pre Launch Activities Event To Enhance Customer Conversion Themes PDF
Persuade your audience using thisIcon For Product Pre Launch Activities Event To Enhance Customer Conversion Themes PDF. This PPT design covers Three stages, thus making it a great tool to use. It also caters to a variety of topics including Product Pre Launch, Activities Event To Enhance, Customer Conversion. Download this PPT design now to present a convincing pitch that not only emphasizes the topic but also showcases your presentation skills.
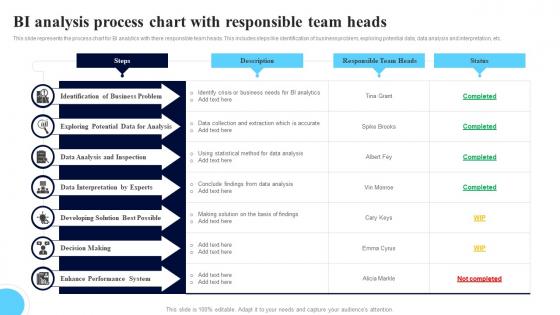
BI Analysis Process Chart With Responsible Team Heads Mockup Pdf
This slide represents the process chart for BI analytics with there responsible team heads. This includes steps like identification of business problem, exploring potential data, data analysis and interpretation, etc. Showcasing this set of slides titled BI Analysis Process Chart With Responsible Team Heads Mockup Pdf. The topics addressed in these templates are Identification Of Business, Data Analysis, Data Interpretation. All the content presented in this PPT design is completely editable. Download it and make adjustments in color, background, font etc. as per your unique business setting. This slide represents the process chart for BI analytics with there responsible team heads. This includes steps like identification of business problem, exploring potential data, data analysis and interpretation, etc.
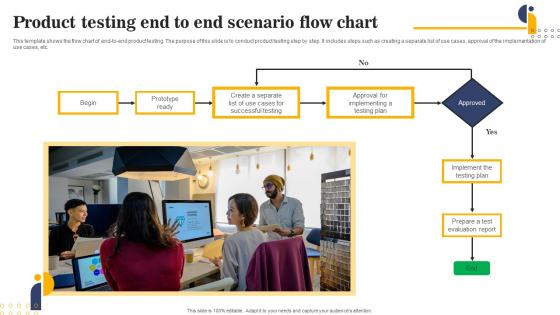
Product Testing End To End Scenario Flow Chart Download Pdf
This template shows the flow chart of end-to-end product testing. The purpose of this slide is to conduct product testing step by step. It includes steps such as creating a separate list of use cases, approval of the implementation of use cases, etc.Pitch your topic with ease and precision using this Product Testing End To End Scenario Flow Chart Download Pdf This layout presents information on Successful Testing, Prototype Ready, Approval Implementing It is also available for immediate download and adjustment. So, changes can be made in the color, design, graphics or any other component to create a unique layout. This template shows the flow chart of end to end product testing. The purpose of this slide is to conduct product testing step by step. It includes steps such as creating a separate list of use cases, approval of the implementation of use cases, etc.
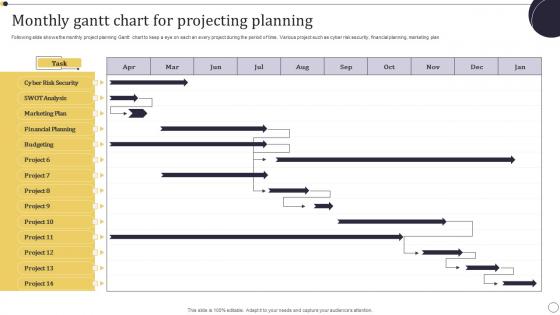
Monthly Gantt Chart For Projecting Planning Information Pdf
Following slide shows the monthly project planning Gantt chart to keep a eye on each an every project during the period of time. Various project such as cyber risk security, financial planning, marketing plan Showcasing this set of slides titled Monthly Gantt Chart For Projecting Planning Information Pdf. The topics addressed in these templates are Marketing Plan, Financial Planning, Cyber Risk Security . All the content presented in this PPT design is completely editable. Download it and make adjustments in color, background, font etc. as per your unique business setting. Following slide shows the monthly project planning Gantt chart to keep a eye on each an every project during the period of time. Various project such as cyber risk security, financial planning, marketing plan
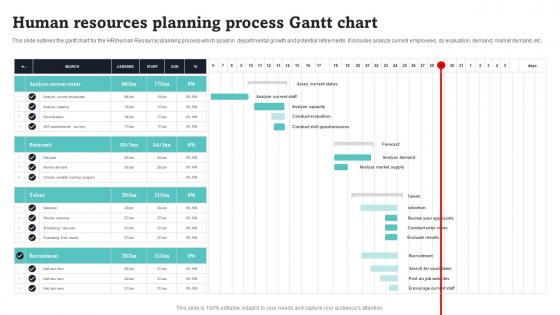
Human Resources Planning Process Gantt Chart Portrait Pdf
This slide outlines the gantt chart for the HRhuman Resource planning process which assist in departmental growth and potential retirements. It includes analyze current employees, do evaluation, demand, market demand, etc. Pitch your topic with ease and precision using this Human Resources Planning Process Gantt Chart Portrait Pdf. This layout presents information on Analyze Current Status, Forecast, Talent. It is also available for immediate download and adjustment. So, changes can be made in the color, design, graphics or any other component to create a unique layout. This slide outlines the gantt chart for the HRhuman Resource planning process which assist in departmental growth and potential retirements. It includes analyze current employees, do evaluation, demand, market demand, etc.

SAP Implementation Process Gantt Chart Ppt Slides Sample Pdf
This slide represents the timeline or Gantt chart of the SAP implementation process. It further includes various stages of process such as build team and identify business goal, evaluate business process, implement business blueprint, etc. Pitch your topic with ease and precision using this SAP Implementation Process Gantt Chart Ppt Slides Sample Pdf. This layout presents information on Business Goal, Evaluate Business Process, Implement Business Blueprint. It is also available for immediate download and adjustment. So, changes can be made in the color, design, graphics or any other component to create a unique layout. This slide represents the timeline or Gantt chart of the SAP implementation process. It further includes various stages of process such as build team and identify business goal, evaluate business process, implement business blueprint, etc.
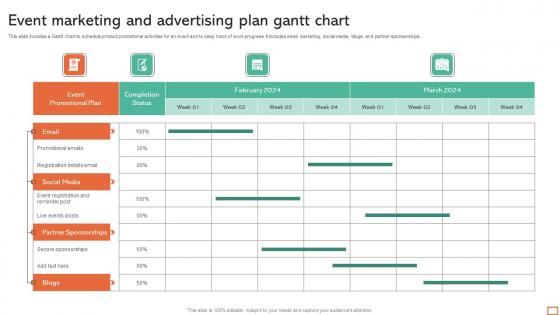
Event Marketing And Advertising Plan Gantt Chart Professional Pdf
This slide includes a Gantt chart to schedule product promotional activities for an event and to keep track of work progress. It includes email marketing, social media, blogs, and partner sponsorships. Pitch your topic with ease and precision using this Event Marketing And Advertising Plan Gantt Chart Professional Pdf. This layout presents information on Social Media, Partner Sponsorships. It is also available for immediate download and adjustment. So, changes can be made in the color, design, graphics or any other component to create a unique layout. This slide includes a Gantt chart to schedule product promotional activities for an event and to keep track of work progress. It includes email marketing, social media, blogs, and partner sponsorships.
Chart Extracellular In Powerpoint And Google Slides Cpb
Introducing our well designed Chart Extracellular In Powerpoint And Google Slides Cpb This PowerPoint design presents information on topics like Chart Extracellular As it is predesigned it helps boost your confidence level. It also makes you a better presenter because of its high quality content and graphics. This PPT layout can be downloaded and used in different formats like PDF, PNG, and JPG. Not only this, it is available in both Standard Screen and Widescreen aspect ratios for your convenience. Therefore, click on the download button now to persuade and impress your audience. Our Chart Extracellular In Powerpoint And Google Slides Cpb are topically designed to provide an attractive backdrop to any subject. Use them to look like a presentation pro.
Randomization Statistics Chart In Powerpoint And Google Slides Cpb
Introducing our well designed Randomization Statistics Chart In Powerpoint And Google Slides Cpb. This PowerPoint design presents information on topics like Randomization Statistics Chart. As it is predesigned it helps boost your confidence level. It also makes you a better presenter because of its high-quality content and graphics. This PPT layout can be downloaded and used in different formats like PDF, PNG, and JPG. Not only this, it is available in both Standard Screen and Widescreen aspect ratios for your convenience. Therefore, click on the download button now to persuade and impress your audience. Our Randomization Statistics Chart In Powerpoint And Google Slides Cpb are topically designed to provide an attractive backdrop to any subject. Use them to look like a presentation pro.
Levels Chart Examples In Powerpoint And Google Slides Cpb
Introducing our well designed Levels Chart Examples In Powerpoint And Google Slides Cpb This PowerPoint design presents information on topics like Levels Chart Examples As it is predesigned it helps boost your confidence level. It also makes you a better presenter because of its high quality content and graphics. This PPT layout can be downloaded and used in different formats like PDF, PNG, and JPG. Not only this, it is available in both Standard Screen and Widescreen aspect ratios for your convenience. Therefore, click on the download button now to persuade and impress your audience. Our Levels Chart Examples In Powerpoint And Google Slides Cpb are topically designed to provide an attractive backdrop to any subject. Use them to look like a presentation pro.
Immunoglobulins Function Chart In Powerpoint And Google Slides Cpb
Introducing our well designed Immunoglobulins Function Chart In Powerpoint And Google Slides Cpb. This PowerPoint design presents information on topics like Immunoglobulins Function Chart. As it is predesigned it helps boost your confidence level. It also makes you a better presenter because of its high-quality content and graphics. This PPT layout can be downloaded and used in different formats like PDF, PNG, and JPG. Not only this, it is available in both Standard Screen and Widescreen aspect ratios for your convenience. Therefore, click on the download button now to persuade and impress your audience. Our Immunoglobulins Function Chart In Powerpoint And Google Slides Cpb are topically designed to provide an attractive backdrop to any subject. Use them to look like a presentation pro.
Function Flow Chart In Powerpoint And Google Slides Cpb
Introducing our well designed Function Flow Chart In Powerpoint And Google Slides Cpb. This PowerPoint design presents information on topics like Function Flow Chart. As it is predesigned it helps boost your confidence level. It also makes you a better presenter because of its high quality content and graphics. This PPT layout can be downloaded and used in different formats like PDF, PNG, and JPG. Not only this, it is available in both Standard Screen and Widescreen aspect ratios for your convenience. Therefore, click on the download button now to persuade and impress your audience. Our Function Flow Chart In Powerpoint And Google Slides Cpb are topically designed to provide an attractive backdrop to any subject. Use them to look like a presentation pro.
Pregnancy Heart Rate Chart In Powerpoint And Google Slides Cpb
Introducing our well designed Pregnancy Heart Rate Chart In Powerpoint And Google Slides Cpb. This PowerPoint design presents information on topics like Pregnancy Heart Rate Chart. As it is predesigned it helps boost your confidence level. It also makes you a better presenter because of its high quality content and graphics. This PPT layout can be downloaded and used in different formats like PDF, PNG, and JPG. Not only this, it is available in both Standard Screen and Widescreen aspect ratios for your convenience. Therefore, click on the download button now to persuade and impress your audience. Our Pregnancy Heart Rate Chart In Powerpoint And Google Slides Cpb are topically designed to provide an attractive backdrop to any subject. Use them to look like a presentation pro.
Triptans Comparison Chart In Powerpoint And Google Slides Cpb
Presenting our innovatively designed set of slides titled Triptans Comparison Chart In Powerpoint And Google Slides Cpb This completely editable PowerPoint graphic exhibits Triptans Comparison Chart that will help you convey the message impactfully. It can be accessed with Google Slides and is available in both standard screen and widescreen aspect ratios. Apart from this, you can download this well structured PowerPoint template design in different formats like PDF, JPG, and PNG. So, click the download button now to gain full access to this PPT design. Our Triptans Comparison Chart In Powerpoint And Google Slides Cpb are topically designed to provide an attractive backdrop to any subject. Use them to look like a presentation pro.
Foods Chart In Powerpoint And Google Slides Cpb
Introducing our well designed Foods Chart In Powerpoint And Google Slides Cpb. This PowerPoint design presents information on topics like Foods Chart. As it is predesigned it helps boost your confidence level. It also makes you a better presenter because of its high-quality content and graphics. This PPT layout can be downloaded and used in different formats like PDF, PNG, and JPG. Not only this, it is available in both Standard Screen and Widescreen aspect ratios for your convenience. Therefore, click on the download button now to persuade and impress your audience. Our Foods Chart In Powerpoint And Google Slides Cpb are topically designed to provide an attractive backdrop to any subject. Use them to look like a presentation pro.
Sound Quality Chart In Powerpoint And Google Slides Cpb
Presenting our innovatively designed set of slides titled Sound Quality Chart In Powerpoint And Google Slides Cpb. This completely editable PowerPoint graphic exhibits Sound Quality Chart that will help you convey the message impactfully. It can be accessed with Google Slides and is available in both standard screen and widescreen aspect ratios. Apart from this, you can download this well structured PowerPoint template design in different formats like PDF, JPG, and PNG. So, click the download button now to gain full access to this PPT design. Our Sound Quality Chart In Powerpoint And Google Slides Cpb are topically designed to provide an attractive backdrop to any subject. Use them to look like a presentation pro.
Gantt Chart Multiple Projects In Powerpoint And Google Slides Cpb
Introducing our well designed Gantt Chart Multiple Projects In Powerpoint And Google Slides Cpb. This PowerPoint design presents information on topics like Gantt Chart Multiple Projects. As it is predesigned it helps boost your confidence level. It also makes you a better presenter because of its high quality content and graphics. This PPT layout can be downloaded and used in different formats like PDF, PNG, and JPG. Not only this, it is available in both Standard Screen and Widescreen aspect ratios for your convenience. Therefore, click on the download button now to persuade and impress your audience. Our Gantt Chart Multiple Projects In Powerpoint And Google Slides Cpb are topically designed to provide an attractive backdrop to any subject. Use them to look like a presentation pro.
CPU Charts In Powerpoint And Google Slides Cpb
Introducing our well-designed CPU Charts In Powerpoint And Google Slides Cpb. This PowerPoint design presents information on topics like CPU Charts. As it is predesigned it helps boost your confidence level. It also makes you a better presenter because of its high-quality content and graphics. This PPT layout can be downloaded and used in different formats like PDF, PNG, and JPG. Not only this, it is available in both Standard Screen and Widescreen aspect ratios for your convenience. Therefore, click on the download button now to persuade and impress your audience. Our CPU Charts In Powerpoint And Google Slides Cpb are topically designed to provide an attractive backdrop to any subject. Use them to look like a presentation pro.
Fitness Watch Comparison Chart In Powerpoint And Google Slides Cpb
Introducing our well designed Fitness Watch Comparison Chart In Powerpoint And Google Slides Cpb. This PowerPoint design presents information on topics like Fitness Watch Comparison Chart. As it is predesigned it helps boost your confidence level. It also makes you a better presenter because of its high quality content and graphics. This PPT layout can be downloaded and used in different formats like PDF, PNG, and JPG. Not only this, it is available in both Standard Screen and Widescreen aspect ratios for your convenience. Therefore, click on the download button now to persuade and impress your audience. Our Fitness Watch Comparison Chart In Powerpoint And Google Slides Cpb are topically designed to provide an attractive backdrop to any subject. Use them to look like a presentation pro.
Micro Expression Chart In Powerpoint And Google Slides Cpb
Introducing our well designed Micro Expression Chart In Powerpoint And Google Slides Cpb. This PowerPoint design presents information on topics like Micro Expression Chart. As it is predesigned it helps boost your confidence level. It also makes you a better presenter because of its high quality content and graphics. This PPT layout can be downloaded and used in different formats like PDF, PNG, and JPG. Not only this, it is available in both Standard Screen and Widescreen aspect ratios for your convenience. Therefore, click on the download button now to persuade and impress your audience. Our Micro Expression Chart In Powerpoint And Google Slides Cpb are topically designed to provide an attractive backdrop to any subject. Use them to look like a presentation pro.
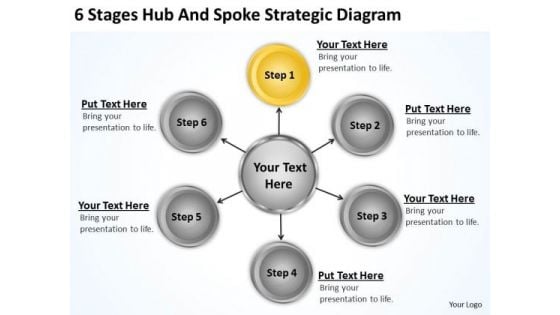
PowerPoint Graphics Business 6 Stages Hub And Spoke Strategic Diagram Ppt Templates
We present our Powerpoint Graphics Business 6 Stages Hub And Spoke Strategic Diagram Ppt Templates.Download our Arrows PowerPoint Templates because It will get your audience in sync. Present our Business PowerPoint Templates because You can Stir your ideas in the cauldron of our PowerPoint Templates and Slides. Cast a magic spell on your audience. Download and present our Circle Charts PowerPoint Templates because You have the co-ordinates for your destination of success. Let our PowerPoint Templates and Slides map out your journey. Present our Shapes PowerPoint Templates because You can Inspire your team with our PowerPoint Templates and Slides. Let the force of your ideas flow into their minds. Use our Process and Flows PowerPoint Templates because It is Aesthetically crafted by artistic young minds. Our PowerPoint Templates and Slides are designed to display your dexterity.Use these PowerPoint slides for presentations relating to 3d, Act, Arrow, Blue, Business, Chart, Circle, Concept, Control, Cycle, Design, Development, Diagram, Evaluate, Flow, Flow-Chart, Flowchart, Fresh, Graphic, Green, Idea, Management, Method, Model, Orange, Process, Purple, Quality, Rainbow, Red, Research, Schema, Spiral, Step, Strategy, Success, System, Vector, White, Work, Workflow, Yellow. The prominent colors used in the PowerPoint template are Gray, Black, White. Give a good account with our PowerPoint Graphics Business 6 Stages Hub And Spoke Strategic Diagram Ppt Templates. Put your views across with clarity.
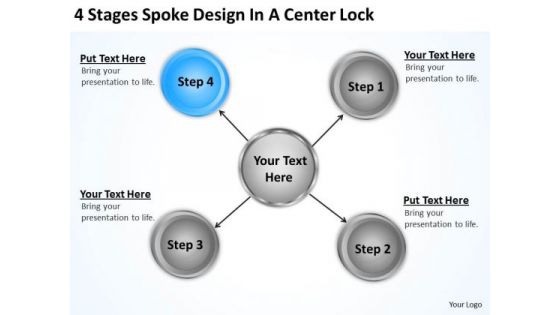
Work Flow Business Process Diagram Lock Ppt PowerPoint Templates Backgrounds For Slides
We present our Work Flow Business Process Diagram Lock Ppt Powerpoint Templates Backgrounds For Slides.Download our Arrows PowerPoint Templates because You can Double your output with our PowerPoint Templates and Slides. They make beating deadlines a piece of cake. Use our Business PowerPoint Templates because Our PowerPoint Templates and Slides are designed to help you succeed. They have all the ingredients you need. Use our Circle Charts PowerPoint Templates because Our PowerPoint Templates and Slides are the chords of your song. String them along and provide the lilt to your views. Download our Shapes PowerPoint Templates because You can Bait your audience with our PowerPoint Templates and Slides. They will bite the hook of your ideas in large numbers. Present our Process and Flows PowerPoint Templates because Our PowerPoint Templates and Slides will let Your superior ideas hit the target always and everytime.Use these PowerPoint slides for presentations relating to 3d, Act, Arrow, Blue, Business, Chart, Circle, Concept, Control, Cycle, Design, Development, Diagram, Evaluate, Flow, Flow-Chart, Flowchart, Fresh, Graphic, Green, Idea, Management, Method, Model, Orange, Process, Purple, Quality, Rainbow, Red, Research, Schema, Spiral, Step, Strategy, Success, System, Vector, White, Work, Workflow, Yellow. The prominent colors used in the PowerPoint template are Blue, Gray, Black. Meet your targets with our Work Flow Business Process Diagram Lock Ppt PowerPoint Templates Backgrounds For Slides. You will come out on top.
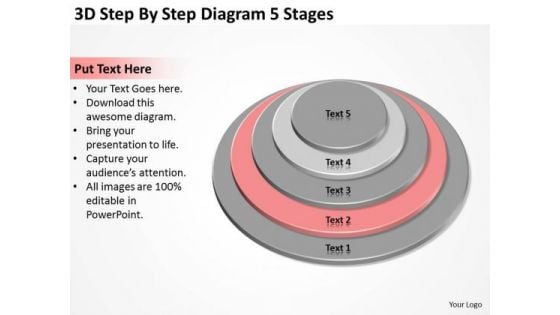
3d Step By Diagram 5 Stages Pizza Business Plan PowerPoint Slides
We present our 3d step by diagram 5 stages pizza business plan PowerPoint Slides.Download our Business PowerPoint Templates because Our PowerPoint Templates and Slides will give good value for money. They also have respect for the value of your time. Download and present our Circle Charts PowerPoint Templates because They will Put the wind in your sails. Skim smoothly over the choppy waters of the market. Download and present our Marketing PowerPoint Templates because You can Create a matrix with our PowerPoint Templates and Slides. Feel the strength of your ideas click into place. Download and present our Success PowerPoint Templates because It will Give impetus to the hopes of your colleagues. Our PowerPoint Templates and Slides will aid you in winning their trust. Download our Shapes PowerPoint Templates because you can Add colour to your speech with our PowerPoint Templates and Slides. Your presentation will leave your audience speechless.Use these PowerPoint slides for presentations relating to Bar, bar graph, chart, circle, column, graphic, concept, curve, diagram, formation, graph, group, growth, healthcare, height chart, level, nobody, objects, pharmacy, render, round, shape, steps, tablet, therapy, white. The prominent colors used in the PowerPoint template are Red, Gray, Black. Enhance the belief of your congregation. Our 3d Step By Diagram 5 Stages Pizza Business Plan PowerPoint Slides help add to their devotion.
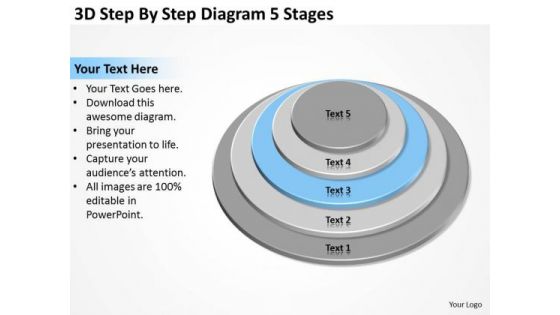
3d Step By Diagram 5 Stages Ppt Best Business Plan Templates PowerPoint Slides
We present our 3d step by diagram 5 stages ppt best business plan templates PowerPoint Slides.Download our Business PowerPoint Templates because You can Be the puppeteer with our PowerPoint Templates and Slides as your strings. Lead your team through the steps of your script. Download our Circle Charts PowerPoint Templates because our PowerPoint Templates and Slides will give your ideas the shape. Use our Marketing PowerPoint Templates because you can Add colour to your speech with our PowerPoint Templates and Slides. Your presentation will leave your audience speechless. Present our Success PowerPoint Templates because Watching this your Audience will Grab their eyeballs, they wont even blink. Use our Shapes PowerPoint Templates because Our PowerPoint Templates and Slides will provide you the cutting edge. Slice through the doubts in the minds of your listeners.Use these PowerPoint slides for presentations relating to Bar, bar graph, chart, circle, column, graphic, concept, curve, diagram, formation, graph, group, growth, healthcare, height chart, level, nobody, objects, pharmacy, render, round, shape, steps, tablet, therapy, white. The prominent colors used in the PowerPoint template are Blue light, Gray, Black. Balance it out with our 3d Step By Diagram 5 Stages Ppt Best Business Plan Templates PowerPoint Slides. Your suggestions will maintain the equilibrium.
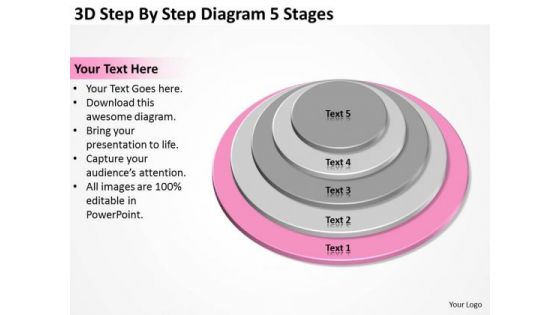
3d Step By Diagram 5 Stages Business Plan Template Word PowerPoint Templates
We present our 3d step by diagram 5 stages business plan template word PowerPoint templates.Present our Business PowerPoint Templates because Our PowerPoint Templates and Slides are topically designed to provide an attractive backdrop to any subject. Use our Circle Charts PowerPoint Templates because Our PowerPoint Templates and Slides will provide the perfect balance. Your weighty ideas will get the ideal impetus. Present our Marketing PowerPoint Templates because You should Press the right buttons with our PowerPoint Templates and Slides. They will take your ideas down the perfect channel. Present our Success PowerPoint Templates because Our PowerPoint Templates and Slides will provide weight to your words. They will bring out the depth of your thought process. Use our Shapes PowerPoint Templates because It can Bubble and burst with your ideas.Use these PowerPoint slides for presentations relating to Bar, bar graph, chart, circle, column, graphic, concept, curve, diagram, formation, graph, group, growth, healthcare, height chart, level, nobody, objects, pharmacy, render, round, shape, steps, tablet, therapy, white. The prominent colors used in the PowerPoint template are Pink, Gray, Black. Our 3d Step By Diagram 5 Stages Business Plan Template Word PowerPoint Templates make good companions. They also are dependable allies.
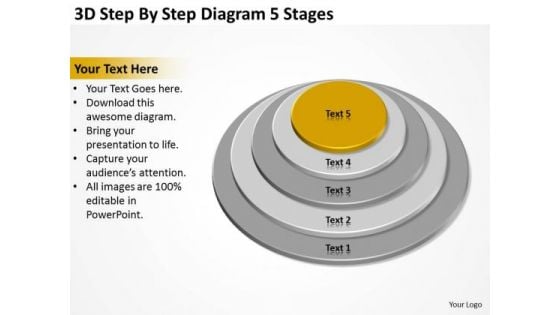
3d Step By Diagram 5 Stages Ppt Business Marketing Plan PowerPoint Slides
We present our 3d step by diagram 5 stages ppt business marketing plan PowerPoint Slides.Download our Business PowerPoint Templates because Our PowerPoint Templates and Slides will let you Hit the target. Go the full distance with ease and elan. Download and present our Circle Charts PowerPoint Templates because They will Put your wonderful verbal artistry on display. Our PowerPoint Templates and Slides will provide you the necessary glam and glitter. Download our Marketing PowerPoint Templates because Our PowerPoint Templates and Slides are created with admirable insight. Use them and give your group a sense of your logical mind. Use our Success PowerPoint Templates because Our PowerPoint Templates and Slides will let your team Walk through your plans. See their energy levels rise as you show them the way. Download our Shapes PowerPoint Templates because Our PowerPoint Templates and Slides come in all colours, shades and hues. They help highlight every nuance of your views.Use these PowerPoint slides for presentations relating to Bar, bar graph, chart, circle, column, graphic, concept, curve, diagram, formation, graph, group, growth, healthcare, height chart, level, nobody, objects, pharmacy, render, round, shape, steps, tablet, therapy, white. The prominent colors used in the PowerPoint template are Orange, Gray, Black. Our 3d Step By Diagram 5 Stages Ppt Business Marketing Plan PowerPoint Slides have a feel for it. They automatically create an ambience.
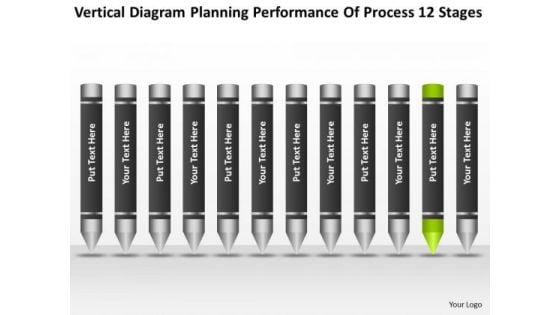
Diagram Planning Performance Of Process 12 Stages Ppt Business Strategy PowerPoint Templates
We present our diagram planning performance of process 12 stages ppt business strategy PowerPoint templates.Use our Process and Flows PowerPoint Templates because You have gained great respect for your brilliant ideas. Use our PowerPoint Templates and Slides to strengthen and enhance your reputation. Download our Education PowerPoint Templates because Watching this your Audience will Grab their eyeballs, they wont even blink. Download our Flow Charts PowerPoint Templates because Our PowerPoint Templates and Slides ensures Effective communication. They help you put across your views with precision and clarity. Use our Shapes PowerPoint Templates because Our PowerPoint Templates and Slides will let your team Walk through your plans. See their energy levels rise as you show them the way. Download and present our Flow Charts PowerPoint Templates because Our PowerPoint Templates and Slides will steer your racing mind. Hit the right buttons and spur on your audience.Use these PowerPoint slides for presentations relating to Mark, corporate, business, plan, concept, bright, symbol, diagram, crayon, stack, graphic, finance, stock,analysis, drawing, paint, calculation, accounting, creative, economic, creativity, chart, forecast, design, color, objects, stationary, pencil, education,profit, information, background, investment, figures, business, business process. The prominent colors used in the PowerPoint template are Green, Black, Gray. Enforce visions with our Diagram Planning Performance Of Process 12 Stages Ppt Business Strategy PowerPoint Templates. Download without worries with our money back guaranteee.
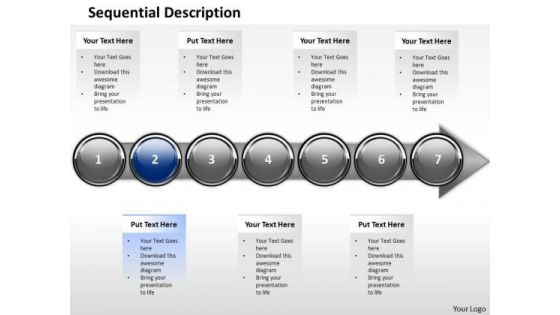
Ppt Arrow Description Of Business Process Using 7 State Diagram Stage 2 PowerPoint Templates
PPT arrow description of business process using 7 state diagram stage 2 PowerPoint Templates-Arrows PowerPoint Diagram is nice for financial PowerPoint Diagram presentations as well as other analysis or business PowerPoint diagram needs. The diagram contains some successful curve effect with a color chart making the sense that an employee from a large corporation is using it to demonstrate the boss that he was doing the right job in the right moment, or you can check the Wish list.-PPT arrow description of business process using 7 state diagram stage 2 PowerPoint Templates-Advertising, Arrow, Background, Banner, Blue, Bookmark, Card, Choice, Concept, Creative, Design, Direction, Flow, Illustration, Infographic, Instruction, Label, Layout, Manual, Marketing, Modern, Next, Number, Offer, One, Options, Order, Page, Paper, Pointer, Process, Product, Promotion, Sequence, Simple, Special, Step, Symbol, Tab, Tag, Template, Three, Tutorial, Two, Vector, Version, Web, Webdesign, Website The impact of your ideas will take time to fade. The images of our Ppt Arrow Description Of Business Process Using 7 State Diagram Stage 2 PowerPoint Templates will help their recall.
Enterprise Operational Framework Icon Showcasing Business Analytics Template PDF
Presenting Enterprise Operational Framework Icon Showcasing Business Analytics Template PDF to dispense important information. This template comprises four stages. It also presents valuable insights into the topics including Enterprise Operational, Framework, Showcasing Business Analytics. This is a completely customizable PowerPoint theme that can be put to use immediately. So, download it and address the topic impactfully.
PowerPoint Presentation Business Pie Chart List Ppt Presentation
PowerPoint Presentation Business Pie Chart list PPT Presentation-These high quality powerpoint pre-designed slides and powerpoint templates have been carefully created by our professional team to help you impress your audience. All slides have been created and are 100% editable in powerpoint. Each and every property of any graphic - color, size, orientation, shading, outline etc. can be modified to help you build an effective powerpoint presentation. Any text can be entered at any point in the powerpoint template or slide. Simply DOWNLOAD, TYPE and PRESENT! Display a fair minded approach with our PowerPoint Presentation Business Pie Chart List Ppt Presentation. Give due attention to all aspects.
PowerPoint Process Company Leadership 3d Circular Chart List Ppt Slide
PowerPoint Process Company Leadership 3d Circular Chart list PPT Slide-These high quality powerpoint pre-designed slides and powerpoint templates have been carefully created by our professional team to help you impress your audience. All slides have been created and are 100% editable in powerpoint. Each and every property of any graphic - color, size, orientation, shading, outline etc. can be modified to help you build an effective powerpoint presentation. Any text can be entered at any point in the powerpoint template or slide. Simply DOWNLOAD, TYPE and PRESENT! Entice them with our PowerPoint Process Company Leadership 3d Circular Chart List Ppt Slide. Lure them with your thoughts.
PowerPoint Process Download Pie Chart Puzzle Process Ppt Slide
PowerPoint Process Download Pie chart Puzzle Process PPT Slide-These high quality powerpoint pre-designed slides and powerpoint templates have been carefully created by our professional team to help you impress your audience. All slides have been created and are 100% editable in powerpoint. Each and every property of any graphic - color, size, orientation, shading, outline etc. can be modified to help you build an effective powerpoint presentation. Any text can be entered at any point in the powerpoint template or slide. Simply DOWNLOAD, TYPE and PRESENT! Get the correct coordination with our PowerPoint Process Download Pie Chart Puzzle Process Ppt Slide. They blend beautifully with your thoughts.
PowerPoint Process Strategy Pie Chart Puzzle Process Ppt Slide Designs
PowerPoint Process Strategy Pie chart Puzzle Process PPT Slide Designs-These high quality powerpoint pre-designed slides and powerpoint templates have been carefully created by our professional team to help you impress your audience. All slides have been created and are 100% editable in powerpoint. Each and every property of any graphic - color, size, orientation, shading, outline etc. can be modified to help you build an effective powerpoint presentation. Any text can be entered at any point in the powerpoint template or slide. Simply DOWNLOAD, TYPE and PRESENT! Audience approval is always sought after. Our PowerPoint Process Strategy Pie Chart Puzzle Process Ppt Slide Designs will fetch it for you.
PowerPoint Process Success Pie Chart Puzzle Process Ppt Slide
PowerPoint Process Success Pie chart Puzzle Process PPT Slide-These high quality powerpoint pre-designed slides and powerpoint templates have been carefully created by our professional team to help you impress your audience. All slides have been created and are 100% editable in powerpoint. Each and every property of any graphic - color, size, orientation, shading, outline etc. can be modified to help you build an effective powerpoint presentation. Any text can be entered at any point in the powerpoint template or slide. Simply DOWNLOAD, TYPE and PRESENT! Make your presentations helpful with our PowerPoint Process Success Pie Chart Puzzle Process Ppt Slide. Dont waste time struggling with PowerPoint. Let us do it for you.
PowerPoint Process Teamwork Pie Chart Puzzle Process Ppt Template
PowerPoint Process Teamwork Pie chart Puzzle Process PPT Template-These high quality powerpoint pre-designed slides and powerpoint templates have been carefully created by our professional team to help you impress your audience. All slides have been created and are 100% editable in powerpoint. Each and every property of any graphic - color, size, orientation, shading, outline etc. can be modified to help you build an effective powerpoint presentation. Any text can be entered at any point in the powerpoint template or slide. Simply DOWNLOAD, TYPE and PRESENT! Experience the exquisite designs of our PowerPoint Process Teamwork Pie Chart Puzzle Process Ppt Template. Combine them with your thoughts for a great package.


 Continue with Email

 Home
Home


