Portfolio Dashboard
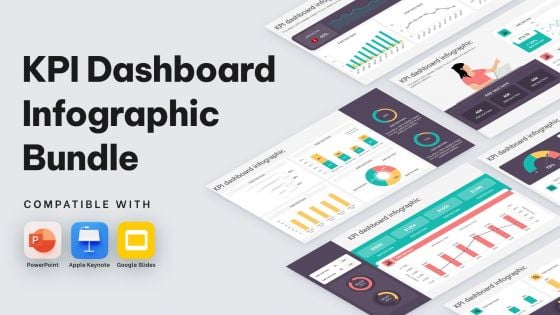
KPI Dashboard Infographic Bundle Powerpoint Ppt Templates And Slides

Sales Product Performance Dashboard Ppt PowerPoint Presentation Model Graphics Design
This is a sales product performance dashboard ppt powerpoint presentation model graphics design. This is a four stage process. The stages in this process are top products in revenue, incremental sales, cost of goods.
Application Performance Dashboard Mobile App Development Advertising Service Icons Pdf
This slide covers application performance in market KPIs and metrics such as impressions, clicks, searches for app, conversion rate etc. Find a pre designed and impeccable Application Performance Dashboard Mobile App Development Advertising Service Icons Pdf. The templates can ace your presentation without additional effort. You can download these easy to edit presentation templates to make your presentation stand out from others. So, what are you waiting for Download the template from Slidegeeks today and give a unique touch to your presentation. This slide covers application performance in market KPIs and metrics such as impressions, clicks, searches for app, conversion rate etc.
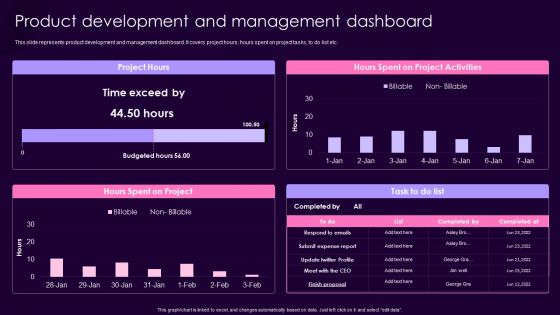
Product Management Techniques Product Development And Management Dashboard Professional PDF
This slide represents product development and management dashboard. It covers project hours, hours spent on project tasks, to do list etc. Deliver an awe inspiring pitch with this creative Product Management Techniques Product Development And Management Dashboard Professional PDF bundle. Topics like Project Hours, Hours Spent, Project Activities can be discussed with this completely editable template. It is available for immediate download depending on the needs and requirements of the user.
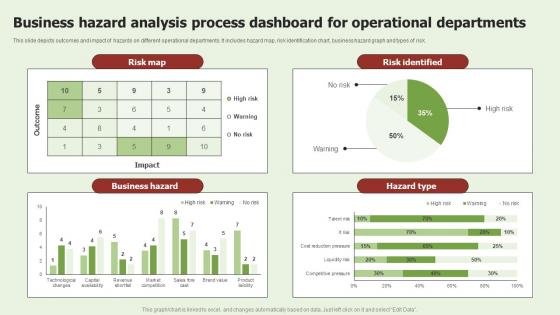
Business Hazard Analysis Process Dashboard For Operational Departments Microsoft Pdf
This slide depicts outcomes and impact of hazards on different operational departments. It includes hazard map, risk identification chart, business hazard graph and types of risk. Pitch your topic with ease and precision using this Business Hazard Analysis Process Dashboard For Operational Departments Microsoft Pdf. This layout presents information on Risk Map, Business Hazard, Hazard Type. It is also available for immediate download and adjustment. So, changes can be made in the color, design, graphics or any other component to create a unique layout. This slide depicts outcomes and impact of hazards on different operational departments. It includes hazard map, risk identification chart, business hazard graph and types of risk.
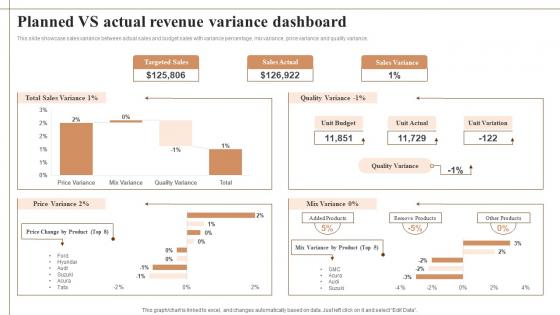
Planned Vs Actual Revenue Variance Dashboard Background Pdf
This slide showcase sales variance between actual sales and budget sales with variance percentage, mix variance, price variance and quality variance. Showcasing this set of slides titled Planned Vs Actual Revenue Variance Dashboard Background Pdf The topics addressed in these templates are Targeted Sales, Sales Actual, Sales Variance All the content presented in this PPT design is completely editable. Download it and make adjustments in color, background, font etc. as per your unique business setting. This slide showcase sales variance between actual sales and budget sales with variance percentage, mix variance, price variance and quality variance.
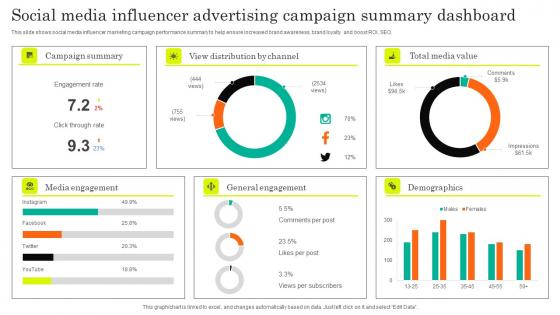
Social Media Influencer Advertising Campaign Summary Dashboard Formats Pdf
This slide shows social media influencer marketing campaign performance summary to help ensure increased brand awareness, brand loyalty and boost ROI, SEO. Showcasing this set of slides titled Social Media Influencer Advertising Campaign Summary Dashboard Formats Pdf. The topics addressed in these templates are Summary, Engagement, Demographics. All the content presented in this PPT design is completely editable. Download it and make adjustments in color, background, font etc. as per your unique business setting. This slide shows social media influencer marketing campaign performance summary to help ensure increased brand awareness, brand loyalty and boost ROI, SEO.

Quarterly Financial Performance Dashboard By Power BI Ppt Sample SS
This slide represents the pyramid showing the asset performance management. It includes details related to APM-centric, predictive, condition-based, preventive and reactive maintenance. Find a pre-designed and impeccable Quarterly Financial Performance Dashboard By Power BI Ppt Sample SS The templates can ace your presentation without additional effort. You can download these easy-to-edit presentation templates to make your presentation stand out from others. So, what are you waiting for Download the template from Slidegeeks today and give a unique touch to your presentation. This slide represents the pyramid showing the asset performance management. It includes details related to APM-centric, predictive, condition-based, preventive and reactive maintenance.

Data Center Infrastructure Management KPI Dashboard Designs PDF
This slide covers data center infrastructure management KPI dashboard. It involves details such as cabinets with free data and power ports, data ports usage per user and items per connected power supplies. Showcasing this set of slides titled Data Center Infrastructure Management KPI Dashboard Designs PDF. The topics addressed in these templates are Data Center Infrastructure, Management KPI Dashboard. All the content presented in this PPT design is completely editable. Download it and make adjustments in color, background, font etc. as per your unique business setting.
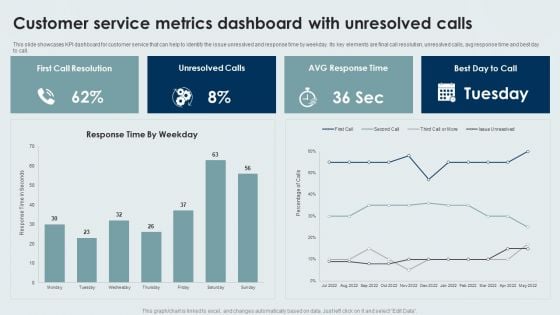
Customer Service Metrics Dashboard With Unresolved Calls Designs PDF
This slide showcases KPI dashboard for customer service that can help to identify the issue unresolved and response time by weekday. Its key elements are final call resolution, unresolved calls, avg response time and best day to call. Showcasing this set of slides titled Customer Service Metrics Dashboard With Unresolved Calls Designs PDF. The topics addressed in these templates are Customer Service, Metrics Dashboard, Unresolved Calls. All the content presented in this PPT design is completely editable. Download it and make adjustments in color, background, font etc. as per your unique business setting.
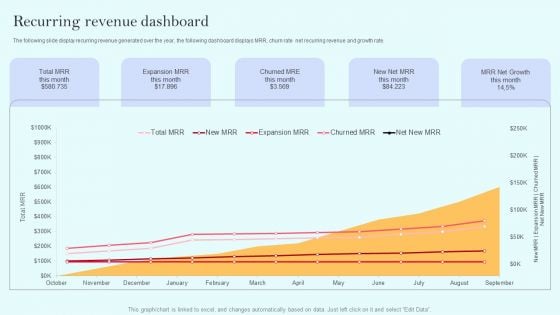
Recurring Income Generation Model Recurring Revenue Dashboard Pictures PDF
The following slide display recurring revenue generated over the year, the following dashboard displays MRR, churn rate net recurring revenue and growth rate. Explore a selection of the finest Recurring Income Generation Model Recurring Revenue Dashboard Pictures PDF here. With a plethora of professionally designed and pre made slide templates, you can quickly and easily find the right one for your upcoming presentation. You can use our Recurring Income Generation Model Recurring Revenue Dashboard Pictures PDF to effectively convey your message to a wider audience. Slidegeeks has done a lot of research before preparing these presentation templates. The content can be personalized and the slides are highly editable. Grab templates today from Slidegeeks.
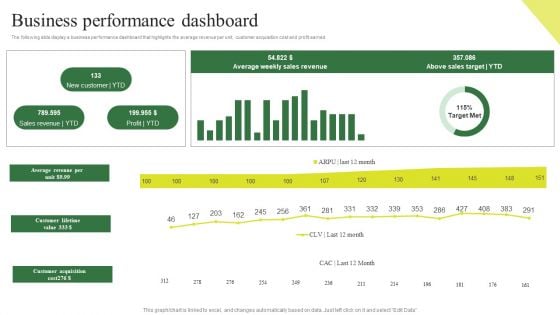
Consumption Based Pricing Model Business Performance Dashboard Demonstration PDF
The following slide display a business performance dashboard that highlights the average revenue per unit, customer acquisition cost and profit earned. Crafting an eye catching presentation has never been more straightforward. Let your presentation shine with this tasteful yet straightforward Consumption Based Pricing Model Business Performance Dashboard Demonstration PDF template. It offers a minimalistic and classy look that is great for making a statement. The colors have been employed intelligently to add a bit of playfulness while still remaining professional. Construct the ideal Consumption Based Pricing Model Business Performance Dashboard Demonstration PDF that effortlessly grabs the attention of your audience. Begin now and be certain to wow your customers.
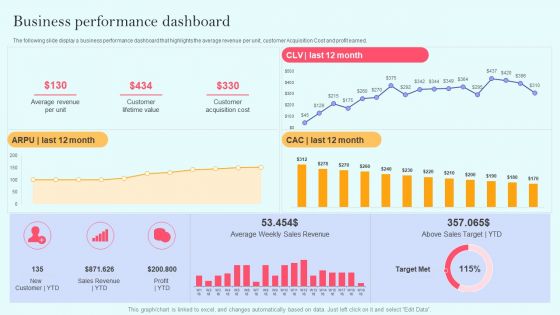
Recurring Income Generation Model Business Performance Dashboard Clipart PDF
The following slide display a business performance dashboard that highlights the average revenue per unit, customer Acquisition Cost and profit earned. Crafting an eye catching presentation has never been more straightforward. Let your presentation shine with this tasteful yet straightforward Recurring Income Generation Model Business Performance Dashboard Clipart PDF template. It offers a minimalistic and classy look that is great for making a statement. The colors have been employed intelligently to add a bit of playfulness while still remaining professional. Construct the ideal Recurring Income Generation Model Business Performance Dashboard Clipart PDF that effortlessly grabs the attention of your audience. Begin now and be certain to wow your customers.
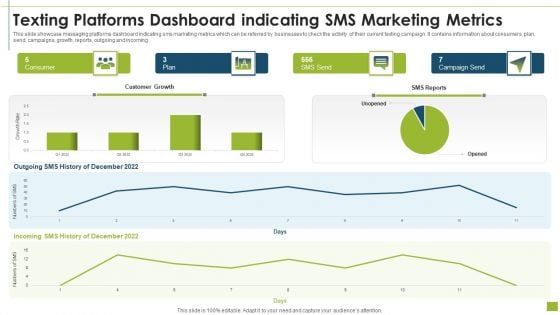
Texting Platforms Dashboard Indicating SMS Marketing Metrics Designs PDF
This slide showcase messaging platforms dashboard indicating sms marketing metrics which can be referred by businesses to check the activity of their current texting campaign. It contains information about consumers, plan, send, campaigns, growth, reports, outgoing and incoming.Pitch your topic with ease and precision using this texting platforms dashboard indicating sms marketing metrics designs pdf This layout presents information on texting platforms dashboard indicating sms marketing metrics It is also available for immediate download and adjustment. So, changes can be made in the color, design, graphics or any other component to create a unique layout.
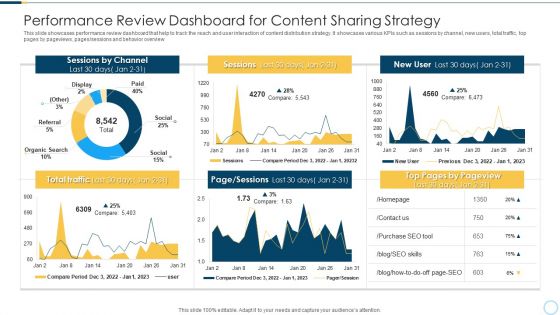
Performance Review Dashboard For Content Sharing Strategy Designs PDF
This slide showcases performance review dashboard that help to track the reach and user interaction of content distribution strategy. It showcases various KPIs such as sessions by channel, new users, total traffic, top pages by pageviews, pages or sessions and behavior overview Showcasing this set of slides titled performance review dashboard for content sharing strategy designs pdf. The topics addressed in these templates are performance review dashboard for content sharing strategy. All the content presented in this PPT design is completely editable. Download it and make adjustments in color, background, font etc. as per your unique business setting.
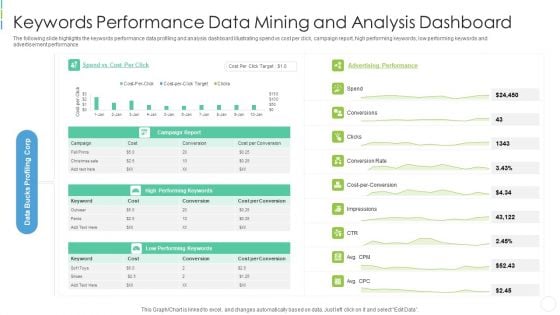
Keywords Performance Data Mining And Analysis Dashboard Microsoft PDF
The following slide highlights the keywords performance data profiling and analysis dashboard illustrating spend vs cost per click, campaign report, high performing keywords, low performing keywords and advertisement performance Showcasing this set of slides titled keywords performance data mining and analysis dashboard microsoft pdf . The topics addressed in these templates are keywords performance data mining and analysis dashboard . All the content presented in this PPT design is completely editable. Download it and make adjustments in color, background, font etc. as per your unique business setting.
Personnel Salary Disbursement Dashboard With Trend Designs PDF
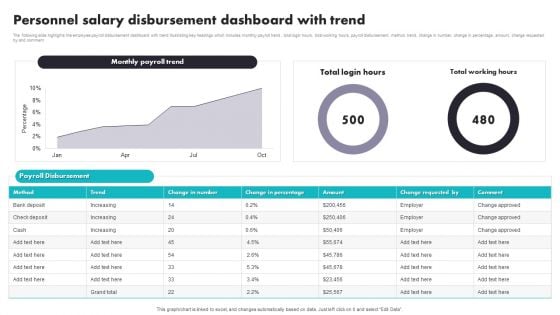
The following slide highlights the employee payroll disbursement dashboard with trend illustrating key headings which includes monthly payroll trend , total login hours, total working hours, payroll disbursement, method, trend, change in number, change in percentage, amount, change requested by and comment. Showcasing this set of slides titled Personnel Salary Disbursement Dashboard With Trend Designs PDF. The topics addressed in these templates are Personnel Salary Disbursement, Dashboard With Trend. All the content presented in this PPT design is completely editable. Download it and make adjustments in color, background, font etc. as per your unique business setting.
Performance Analytical Dashboard Based On Data Architecture Model Elements PDF
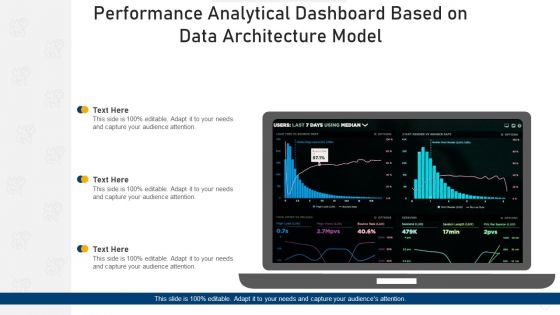
Persuade your audience using this performance analytical dashboard based on data architecture model elements pdf. This PPT design covers one stages, thus making it a great tool to use. It also caters to a variety of topics including performance analytical dashboard based on data architecture model. Download this PPT design now to present a convincing pitch that not only emphasizes the topic but also showcases your presentation skills.
Weekly Email Marketing Campaign Performance Dashboard Analysis Structure PDF
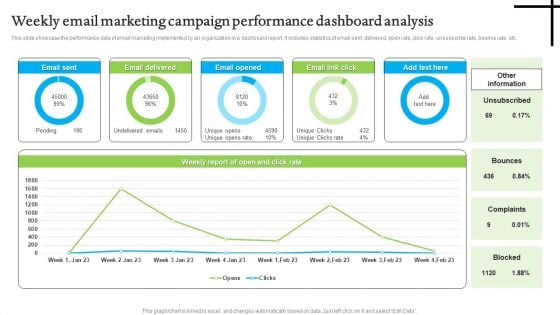
This slide showcase the performance data of email marketing implemented by an organization in a dashboard report. It includes statistics of email sent, delivered, open rate, click rate, unsubscribe rate, bounce rate, etc. Pitch your topic with ease and precision using this Weekly Email Marketing Campaign Performance Dashboard Analysis Structure PDF. This layout presents information on Weekly Email Marketing, Campaign Performance Dashboard Analysis. It is also available for immediate download and adjustment. So, changes can be made in the color, design, graphics or any other component to create a unique layout.
Employee Demographics Data And Designation Analysis Dashboard Introduction PDF
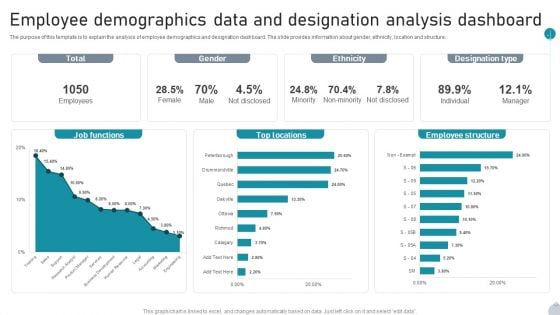
The purpose of this template is to explain the analysis of employee demographics and designation dashboard. The slide provides information about gender, ethnicity, location and structure. Pitch your topic with ease and precision using this Employee Demographics Data And Designation Analysis Dashboard Introduction PDF. This layout presents information on Job Functions, Top Locations, Employee Structure It is also available for immediate download and adjustment. So, changes can be made in the color, design, graphics or any other component to create a unique layout.
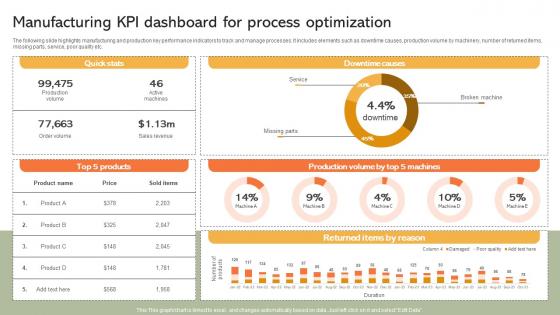
Manufacturing KPI Dashboard For Process Implementing Manufacturing Strategy SS V
The following slide highlights manufacturing and production key performance indicators to track and manage processes. It includes elements such as downtime causes, production volume by machinery, number of returned items, missing parts, service, poor quality etc. Formulating a presentation can take up a lot of effort and time, so the content and message should always be the primary focus. The visuals of the PowerPoint can enhance the presenters message, so our Manufacturing KPI Dashboard For Process Implementing Manufacturing Strategy SS V was created to help save time. Instead of worrying about the design, the presenter can concentrate on the message while our designers work on creating the ideal templates for whatever situation is needed. Slidegeeks has experts for everything from amazing designs to valuable content, we have put everything into Manufacturing KPI Dashboard For Process Implementing Manufacturing Strategy SS V The following slide highlights manufacturing and production key performance indicators to track and manage processes. It includes elements such as downtime causes, production volume by machinery, number of returned items, missing parts, service, poor quality etc.
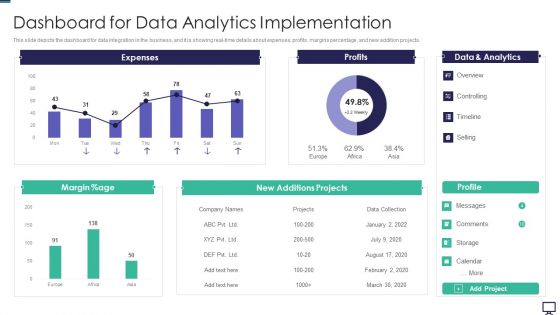
Dashboard For Data Analytics Implementation Ppt Model Files PDF
This slide depicts the dashboard for data integration in the business, and it is showing real time details about expenses, profits, margins percentage, and new addition projects. Deliver and pitch your topic in the best possible manner with this dashboard for data analytics implementation ppt model files pdf. Use them to share invaluable insights on expenses, profits, analytics, data and impress your audience. This template can be altered and modified as per your expectations. So, grab it now.
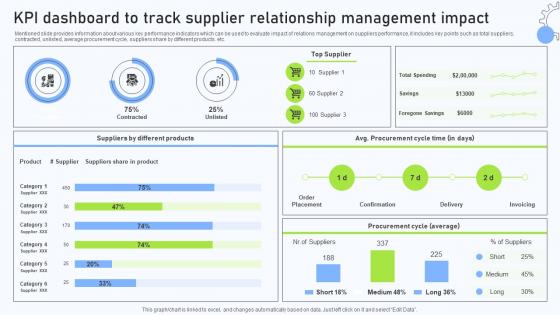
Relationship Management Automation KPI Dashboard To Track Supplier Relationship
Mentioned slide provides information about various key performance indicators which can be used to evaluate impact of relations management on suppliers performance, it includes key points such as total suppliers, contracted, unlisted, average procurement cycle, suppliers share by different products. etc. This Relationship Management Automation KPI Dashboard To Track Supplier Relationship is perfect for any presentation, be it in front of clients or colleagues. It is a versatile and stylish solution for organizing your meetings. The Relationship Management Automation KPI Dashboard To Track Supplier Relationship features a modern design for your presentation meetings. The adjustable and customizable slides provide unlimited possibilities for acing up your presentation. Slidegeeks has done all the homework before launching the product for you. So, do not wait, grab the presentation templates today Mentioned slide provides information about various key performance indicators which can be used to evaluate impact of relations management on suppliers performance, it includes key points such as total suppliers, contracted, unlisted, average procurement cycle, suppliers share by different products. etc.
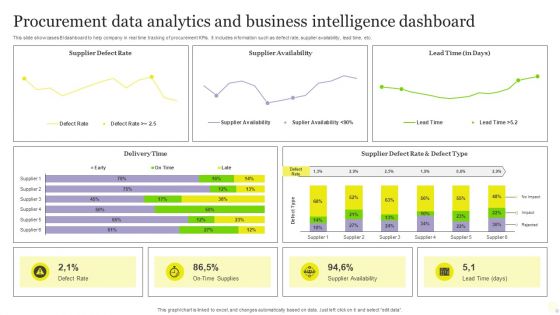
Procurement Data Analytics And Business Intelligence Dashboard Pictures PDF
This slide showcases BI dashboard to help company in real time tracking of procurement KPIs. It includes information such as defect rate, supplier availability, lead time, etc. Pitch your topic with ease and precision using this Procurement Data Analytics And Business Intelligence Dashboard Pictures PDF. This layout presents information on Procurement Data Analytics, Business Intelligence Dashboard. It is also available for immediate download and adjustment. So, changes can be made in the color, design, graphics or any other component to create a unique layout.
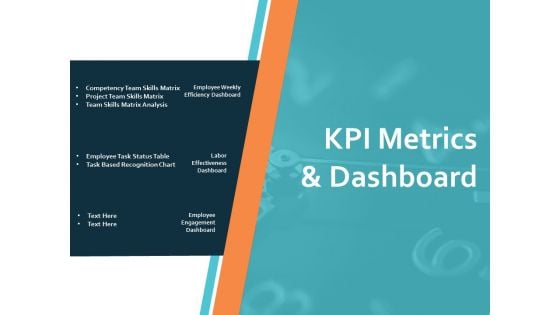
KPI Metrics And Dashboard Ppt PowerPoint Presentation Infographics Model
This is a kpi metrics and dashboard ppt powerpoint presentation infographics model. This is a three stage process. The stages in this process are business, planning, strategy, marketing, management.
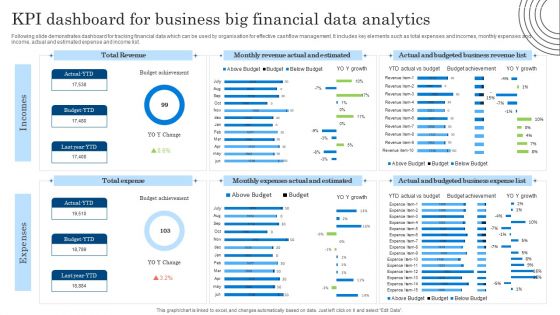
KPI Dashboard For Business Big Financial Data Analytics Diagrams PDF
Following slide demonstrates dashboard for tracking financial data which can be used by organisation for effective cashflow management. It includes key elements such as total expenses and incomes, monthly expenses and income, actual and estimated expense and income list. Showcasing this set of slides titled KPI Dashboard For Business Big Financial Data Analytics Diagrams PDF. The topics addressed in these templates are KPI Dashboard, Business Big Financial, Data Analytics. All the content presented in this PPT design is completely editable. Download it and make adjustments in color, background, font etc. as per your unique business setting.
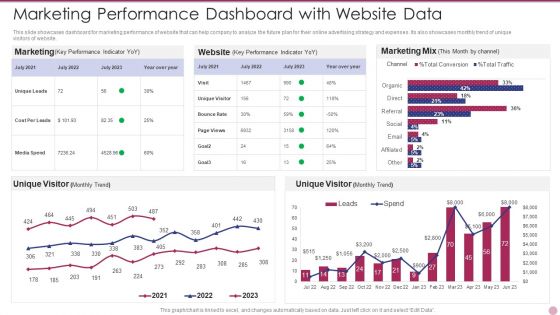
Marketing Performance Dashboard With Website Data Elements PDF
This slide showcases dashboard for marketing performance of website that can help company to analyze the future plan for their online advertising strategy and expenses. Its also showcases monthly trend of unique visitors of website. Pitch your topic with ease and precision using this Marketing Performance Dashboard With Website Data Elements PDF. This layout presents information on Marketing Performance Dashboard With Website Data. It is also available for immediate download and adjustment. So, changes can be made in the color, design, graphics or any other component to create a unique layout.
Key Business Metrics Dashboard Ppt Powerpoint Presentation Icon Graphics Design
This is a key business metrics dashboard ppt powerpoint presentation icon graphics design. This is a five stage process. The stages in this process are finance, marketing, management, investment, analysis.
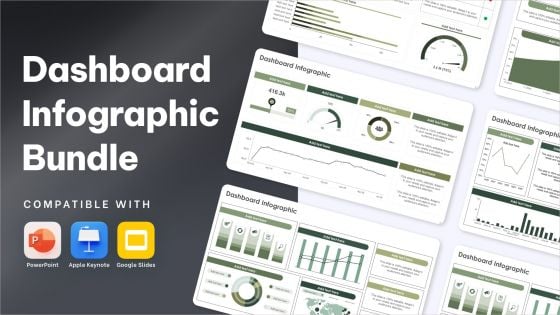
Dashboard Infographic Bundle Powerpoint Ppt Templates And Slides
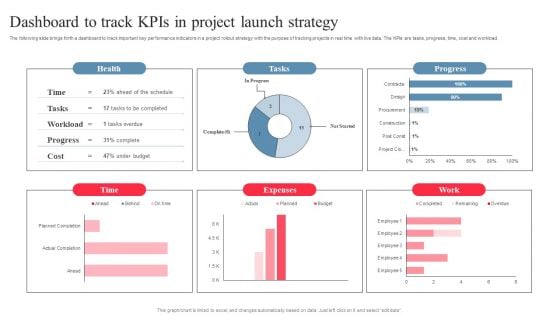
Dashboard To Track Kpis In Project Launch Strategy Pictures PDF
The following slide brings forth a dashboard to track important key performance indicators in a project rollout strategy with the purpose of tracking projects in real time with live data. The KPIs are tasks, progress, time, cost and workload. Showcasing this set of slides titled Dashboard To Track Kpis In Project Launch Strategy Pictures PDF. The topics addressed in these templates are Expenses, Project Launch Strategy, Dashboard To Track Kpis. All the content presented in this PPT design is completely editable. Download it and make adjustments in color, background, font etc. as per your unique business setting.
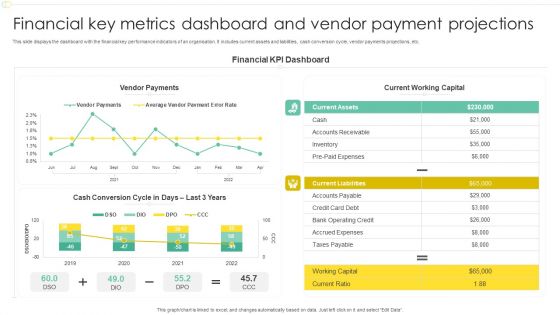
Financial Key Metrics Dashboard And Vendor Payment Projections Professional PDF
This slide displays the dashboard with the financial key performance indicators of an organisation. It includes current assets and liabilities, cash conversion cycle, vendor payments projections, etc. Pitch your topic with ease and precision using this Financial Key Metrics Dashboard And Vendor Payment Projections Professional PDF. This layout presents information on Financial KPI Dashboard, Current Working Capital, Vendor Payments. It is also available for immediate download and adjustment. So, changes can be made in the color, design, graphics or any other component to create a unique layout.
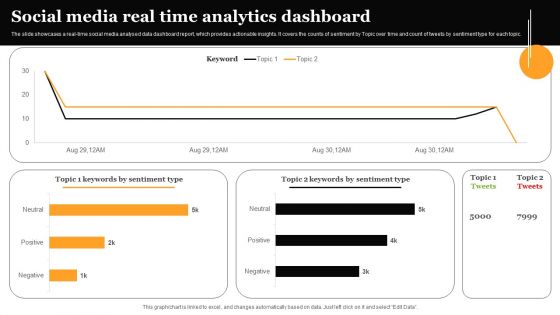
Social Media Real Time Analytics Dashboard Formats PDF
The slide showcases a real-time social media analysed data dashboard report, which provides actionable insights. It covers the counts of sentiment by Topic over time and count of tweets by sentiment type for each topic. Showcasing this set of slides titled Social Media Real Time Analytics Dashboard Formats PDF. The topics addressed in these templates are Social Media Real, Time Analytics, Dashboard. All the content presented in this PPT design is completely editable. Download it and make adjustments in color, background, font etc. as per your unique business setting.
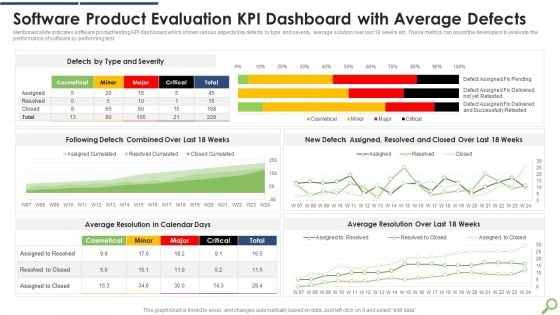
Software Product Evaluation KPI Dashboard With Average Defects Infographics PDF
Mentioned slide indicates software product testing KPI dashboard which shows various aspects like defects by type and severity, average solution over last 18 weeks etc. These metrics can assist the developers to evaluate the performance of software by performing test.Showcasing this set of slides titled Software Product Evaluation KPI Dashboard With Average Defects Infographics PDF The topics addressed in these templates are Software Product, Evaluation Dashboard, Average Defects All the content presented in this PPT design is completely editable. Download it and make adjustments in color, background, font etc. as per your unique business setting.

Dashboard And Kpis Ppt PowerPoint Presentation Layouts Graphics Design
This is a dashboard and kpis ppt powerpoint presentation layouts graphics design. This is a one stage process. The stages in this process are marketing, business, management, planning, strategy.
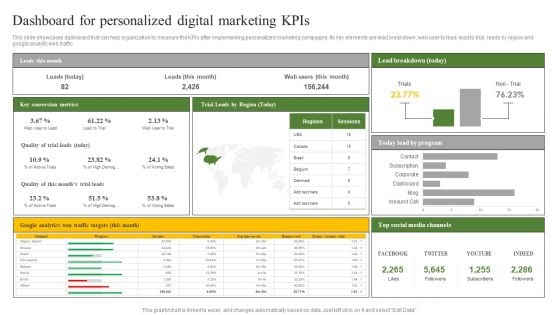
Dashboard For Personalized Digital Marketing Kpis Ppt Background Designs PDF
This slide showcases dashboard that can help organization to measure the KPIs after implementing personalized marketing campaigns. Its key elements are lead breakdown, web user to lead, lead to trial, leads by region and google analytic web traffic. Presenting this PowerPoint presentation, titled Dashboard For Personalized Digital Marketing Kpis Ppt Background Designs PDF, with topics curated by our researchers after extensive research. This editable presentation is available for immediate download and provides attractive features when used. Download now and captivate your audience. Presenting this Dashboard For Personalized Digital Marketing Kpis Ppt Background Designs PDF. Our researchers have carefully researched and created these slides with all aspects taken into consideration. This is a completely customizable Dashboard For Personalized Digital Marketing Kpis Ppt Background Designs PDF that is available for immediate downloading. Download now and make an impact on your audience. Highlight the attractive features available with our PPTs.
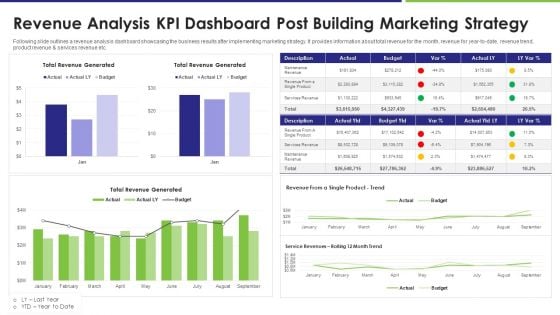
Revenue Analysis KPI Dashboard Post Building Marketing Strategy Infographics PDF
Following slide outlines a revenue analysis dashboard showcasing the business results after implementing marketing strategy. It provides information about total revenue for the month, revenue for year to date, revenue trend, product revenue and services revenue etc. Pitch your topic with ease and precision using this revenue analysis kpi dashboard post building marketing strategy infographics pdf. This layout presents information on revenue analysis kpi dashboard post building marketing strategy. It is also available for immediate download and adjustment. So, changes can be made in the color, design, graphics or any other component to create a unique layout.
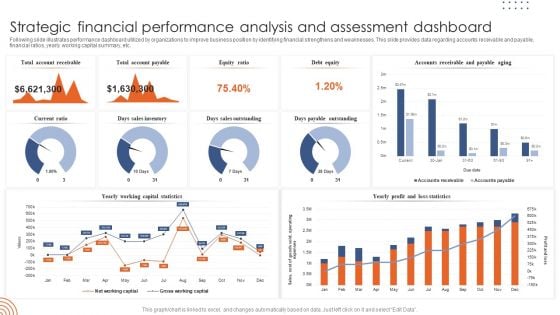
Strategic Financial Performance Analysis And Assessment Dashboard Template PDF
Following slide illustrates performance dashboard utilized by organizations to improve business position by identifying financial strengthens and weaknesses. This slide provides data regarding accounts receivable and payable, financial ratios, yearly working capital summary, etc. Showcasing this set of slides titled Strategic Financial Performance Analysis And Assessment Dashboard Template PDF. The topics addressed in these templates are Strategic Financial Performance, Analysis Assessment Dashboard. All the content presented in this PPT design is completely editable. Download it and make adjustments in color, background, font etc. as per your unique business setting.
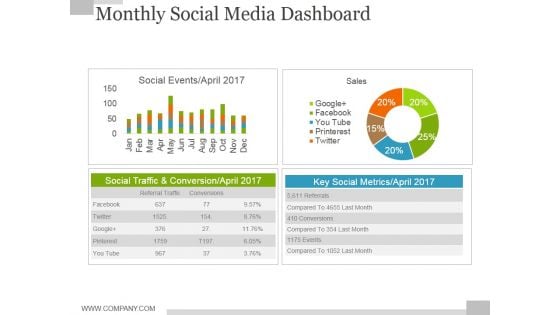
Monthly Social Media Dashboard Ppt PowerPoint Presentation Model Slide
This is a monthly social media dashboard ppt powerpoint presentation model slide. This is a four stage process. The stages in this process are sales, social events, business, finance, key social metrics.
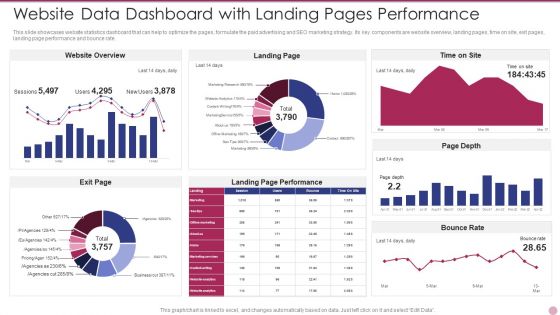
Website Data Dashboard With Landing Pages Performance Formats PDF
This slide showcases website statistics dashboard that can help to optimize the pages, formulate the paid advertising and SEO marketing strategy. Its key components are website overview, landing pages, time on site, exit pages, landing page performance and bounce rate. Showcasing this set of slides titled Website Data Dashboard With Landing Pages Performance Formats PDF. The topics addressed in these templates are Website Data Dashboard With Landing Pages Performance. All the content presented in this PPT design is completely editable. Download it and make adjustments in color, background, font etc. as per your unique business setting.
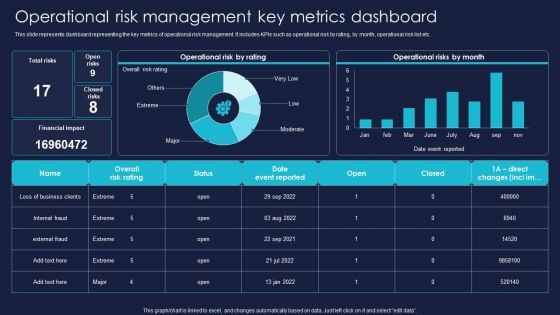
Operational Risk Management Key Metrics Dashboard Professional PDF
This slide represents dashboard representing the key metrics of operational risk management. It includes KPIs such as operational risk by rating, by month, operational risk list etc. Get a simple yet stunning designed Operational Risk Management Key Metrics Dashboard Professional PDF. It is the best one to establish the tone in your meetings. It is an excellent way to make your presentations highly effective. So, download this PPT today from Slidegeeks and see the positive impacts. Our easy to edit Operational Risk Management Key Metrics Dashboard Professional PDF can be your go-to option for all upcoming conferences and meetings. So, what are you waiting for Grab this template today.
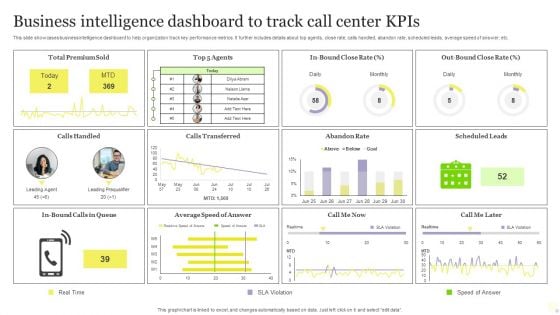
Business Intelligence Dashboard To Track Call Center Kpis Download PDF
This slide showcases business intelligence dashboard to help organization track key performance metrics. It further includes details about top agents, close rate, calls handled, abandon rate, scheduled leads, average speed of answer, etc. Pitch your topic with ease and precision using this Business Intelligence Dashboard To Track Call Center Kpis Download PDF. This layout presents information on Business Intelligence Dashboard, Track Call Center Kpis. It is also available for immediate download and adjustment. So, changes can be made in the color, design, graphics or any other component to create a unique layout.
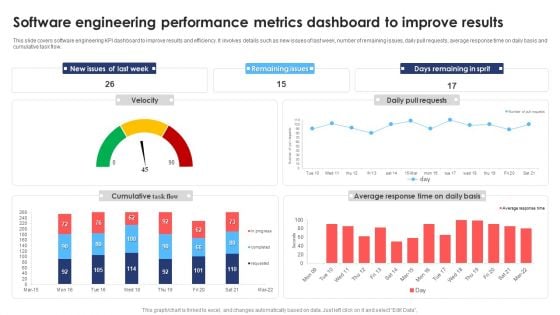
Software Engineering Performance Metrics Dashboard To Improve Results Infographics PDF
This slide covers software engineering KPI dashboard to improve results and efficiency. It involves details such as new issues of last week, number of remaining issues, daily pull requests, average response time on daily basis and cumulative task flow. Pitch your topic with ease and precision using this Software Engineering Performance Metrics Dashboard To Improve Results Infographics PDF. This layout presents information on Software Engineering Performance, Metrics Dashboard Improve Results. It is also available for immediate download and adjustment. So, changes can be made in the color, design, graphics or any other component to create a unique layout.
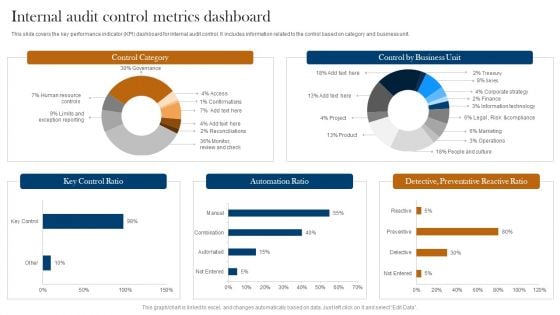
Internal Audit Control Metrics Dashboard Ppt Professional Design Templates PDF
This slide covers the key performance indicator KPI dashboard for internal audit control. It includes information related to the control based on category and business unit. Showcasing this set of slides titled Internal Audit Control Metrics Dashboard Ppt Professional Design Templates PDF. The topics addressed in these templates are Control Category, Key Control Ratio, Automation Ratio. All the content presented in this PPT design is completely editable. Download it and make adjustments in color, background, font etc. as per your unique business setting.
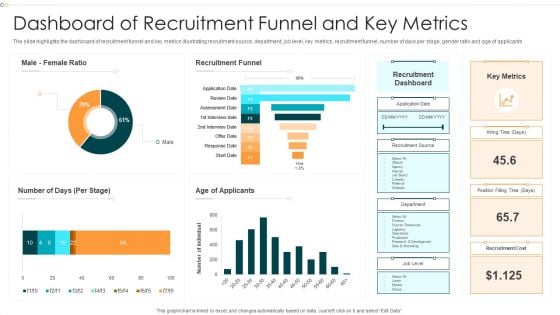
Dashboard Of Recruitment Funnel And Key Metrics Information PDF
The slide highlights the dashboard of recruitment funnel and key metrics illustrating recruitment source, department, job level, key metrics, recruitment funnel, number of days per stage, gender ratio and age of applicants.Pitch your topic with ease and precision using this Dashboard Of Recruitment Funnel And Key Metrics Information PDF This layout presents information on Recruitment Funnel, Recruitment Dashboard, Recruitment Cost It is also available for immediate download and adjustment. So, changes can be made in the color, design, graphics or any other component to create a unique layout.
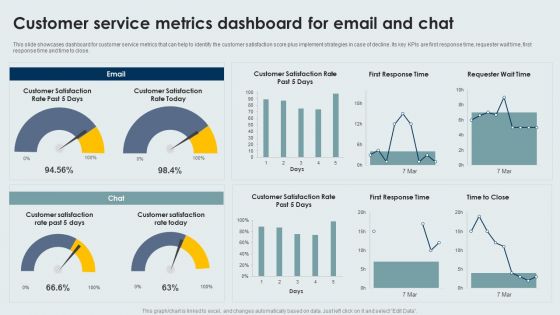
Customer Service Metrics Dashboard For Email And Chat Infographics PDF
This slide showcases dashboard for customer service metrics that can help to identify the customer satisfaction score plus implement strategies in case of decline. Its key KPIs are first response time, requester wait time, first response time and time to close. Pitch your topic with ease and precision using this Customer Service Metrics Dashboard For Email And Chat Infographics PDF. This layout presents information on Customer Service, Metrics Dashboard, Email And Chat. It is also available for immediate download and adjustment. So, changes can be made in the color, design, graphics or any other component to create a unique layout.
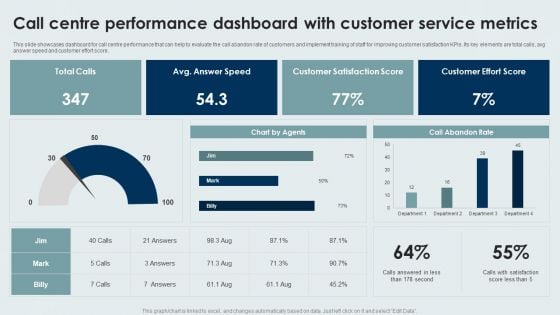
Call Centre Performance Dashboard With Customer Service Metrics Background PDF
This slide showcases dashboard for call centre performance that can help to evaluate the call abandon rate of customers and implement training of staff for improving customer satisfaction KPIs. Its key elements are total calls, avg answer speed and customer effort score. Showcasing this set of slides titled Call Centre Performance Dashboard With Customer Service Metrics Background PDF. The topics addressed in these templates are Call Centre Performance Dashboard, Customer Service Metrics. All the content presented in this PPT design is completely editable. Download it and make adjustments in color, background, font etc. as per your unique business setting.
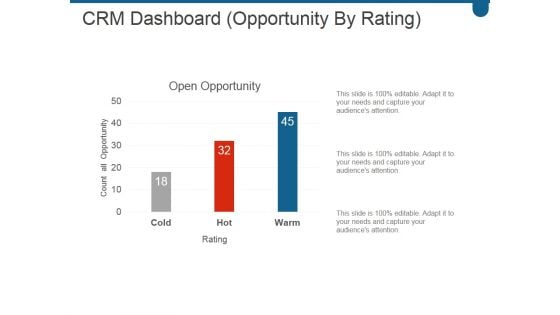
Crm Dashboard Opportunity By Rating Ppt PowerPoint Presentation Model
This is a crm dashboard opportunity by rating ppt powerpoint presentation model. This is a three stage process. The stages in this process are open opportunity, cold, hot, warm.
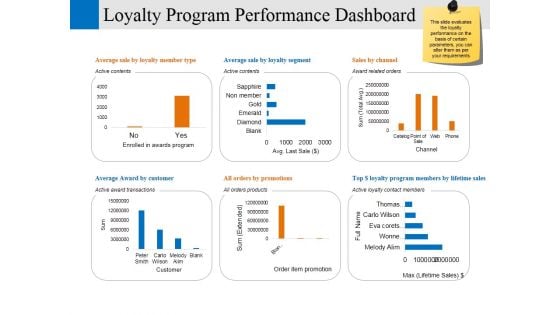
Loyalty Program Performance Dashboard Ppt PowerPoint Presentation Professional Model
This is a loyalty program performance dashboard ppt powerpoint presentation professional model. This is a six stage process. The stages in this process are enrolled in awards program, customer, order item promotion, channel, business.
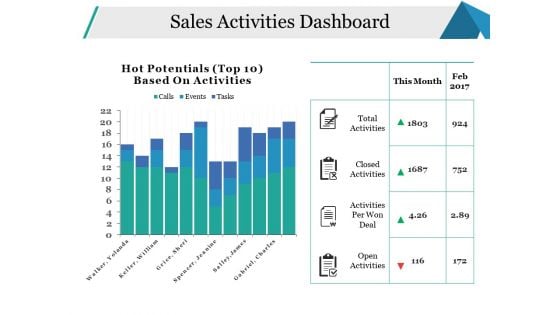
Sales Activities Dashboard Ppt PowerPoint Presentation Pictures Model
This is a sales activities dashboard ppt powerpoint presentation pictures model. This is a two stage process. The stages in this process are open activities, activities per won deal, closed activities, total activities, business.
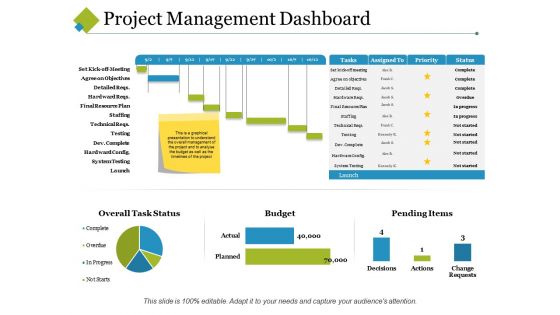
Project Management Dashboard Ppt PowerPoint Presentation Model Graphics Template
This is a project management dashboard ppt powerpoint presentation model graphics template. This is a four stage process. The stages in this process are assigned to, task, priority, cost, budget.
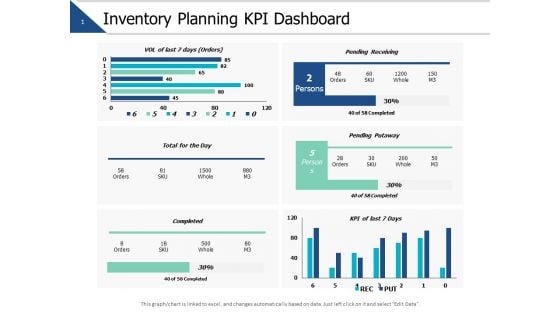
Inventory Planning Kpi Dashboard Ppt PowerPoint Presentation Model Show
This is a inventory planning kpi dashboard ppt powerpoint presentation model show. This is a four stage process. The stages in this process are finance, marketing, management, investment, analysis.
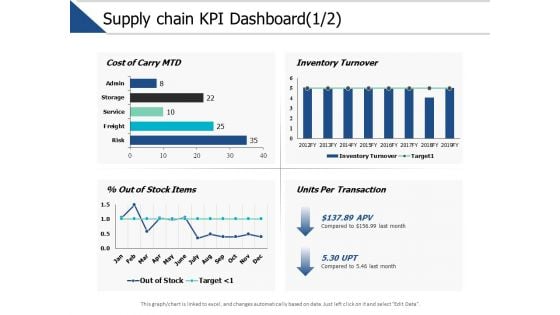
Supply Chain Kpi Dashboard Management Ppt PowerPoint Presentation Model Picture
This is a supply chain kpi dashboard management ppt powerpoint presentation model picture. This is a three stage process. The stages in this process are finance, marketing, management, investment, analysis.
Employee Training And Development Plan Performance Tracking Dashboard Portrait PDF
Mentioned slide outlines key performance indicator KPI dashboard which can be used by organization to monitor training and development strategies. The major metrics covered in the template are cost per participant, per hour, number of trainees , etc. Showcasing this set of slides titled Employee Training And Development Plan Performance Tracking Dashboard Portrait PDF. The topics addressed in these templates are Employee Training, Development Plan Performance, Tracking Dashboard. All the content presented in this PPT design is completely editable. Download it and make adjustments in color, background, font etc. as per your unique business setting.
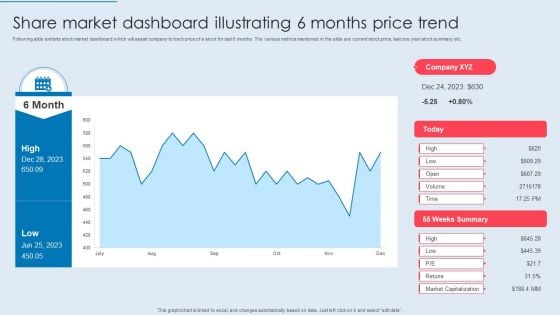
Share Market Dashboard Illustrating 6 Months Price Trend Ideas PDF
Following slide exhibits stock market dashboard which will assist company to track price of a stock for last 6 months. The various metrics mentioned in the slide are current stock price, last one year stock summary etc. Showcasing this set of slides titled Share Market Dashboard Illustrating 6 Months Price Trend Ideas PDF. The topics addressed in these templates are Share Market, Dashboard Illustrating, Months Price Trend. All the content presented in this PPT design is completely editable. Download it and make adjustments in color, background, font etc. as per your unique business setting.
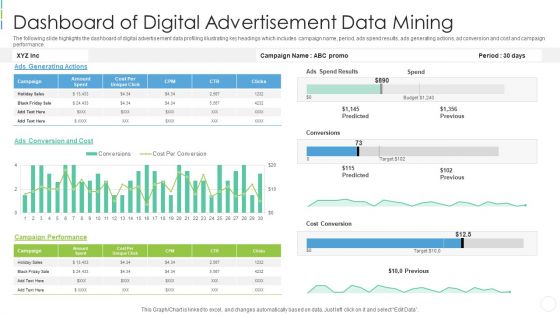
Dashboard Of Digital Advertisement Data Mining Professional PDF
The following slide highlights the dashboard of digital advertisement data profiling illustrating key headings which includes campaign name, period, ads spend results, ads generating actions, ad conversion and cost and campaign performance. Pitch your topic with ease and precision using this dashboard of digital advertisement data mining professional pdf . This layout presents information on dashboard of digital advertisement data mining . It is also available for immediate download and adjustment. So, changes can be made in the color, design, graphics or any other component to create a unique layout.
Data Mining Dashboard Of Gender And Age Demographics Icons PDF
The following slide highlights the data profiling dashboard of gender and age demographics illustrating gender and age per month, gender and general age, average age per month and individual per age group to find the gender and age composition of area Showcasing this set of slides titled data mining dashboard of gender and age demographics icons pdf . The topics addressed in these templates are data mining dashboard of gender and age demographics . All the content presented in this PPT design is completely editable. Download it and make adjustments in color, background, font etc. as per your unique business setting.
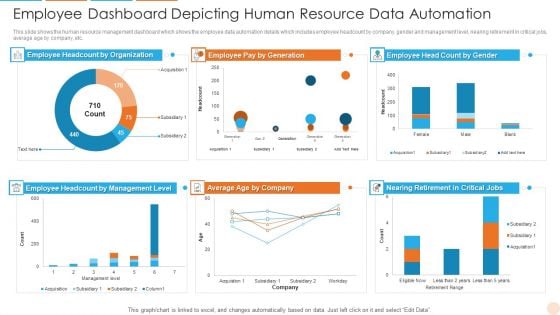
Employee Dashboard Depicting Human Resource Data Automation Professional PDF
This slide shows the human resource management dashboard which shows the employee data automation details which includes employee headcount by company, gender and management level, nearing retirement in critical jobs, average age by company, etc. Showcasing this set of slides titled Employee Dashboard Depicting Human Resource Data Automation Professional PDF. The topics addressed in these templates are Employee Dashboard Depicting Human Resource Data Automation. All the content presented in this PPT design is completely editable. Download it and make adjustments in color, background, font etc. as per your unique business setting.
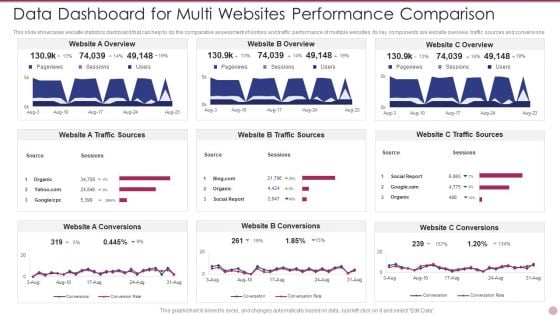
Data Dashboard For Multi Websites Performance Comparison Themes PDF
This slide showcases website statistics dashboard that can help to do the comparative assessment of visitors and traffic performance of multiple websites. Its key components are website overview, traffic sources and conversions. Showcasing this set of slides titled Data Dashboard For Multi Websites Performance Comparison Themes PDF. The topics addressed in these templates are Data Dashboard For Multi Websites Performance Comparison. All the content presented in this PPT design is completely editable. Download it and make adjustments in color, background, font etc. as per your unique business setting.
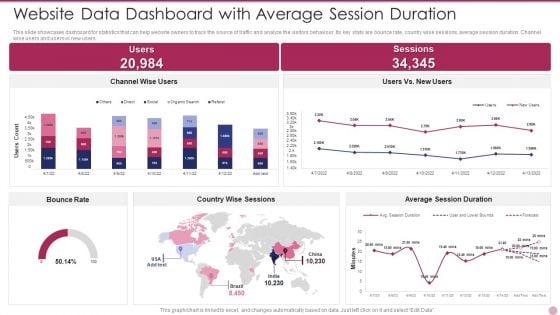
Website Data Dashboard With Average Session Duration Ideas PDF
This slide showcases dashboard for statistics that can help website owners to track the source of traffic and analyze the visitors behaviour. Its key stats are bounce rate, country wise sessions, average session duration. Channel wise users and users vs new users. Pitch your topic with ease and precision using this Website Data Dashboard With Average Session Duration Ideas PDF. This layout presents information on Website Data Dashboard With Average Session Duration. It is also available for immediate download and adjustment. So, changes can be made in the color, design, graphics or any other component to create a unique layout.
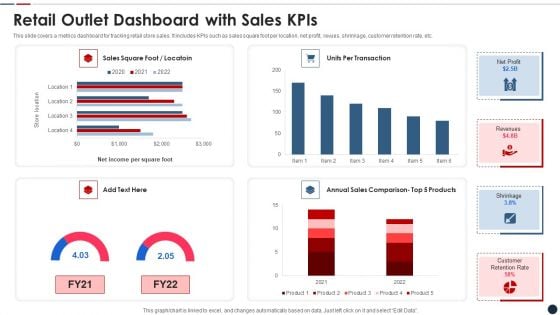
Retail Outlet Dashboard With Sales Kpis Clipart PDF
This slide covers a metrics dashboard for tracking retail store sales. It includes KPIs such as sales square foot per location, net profit, revues, shrinkage, customer retention rate, etc. Pitch your topic with ease and precision using this retail outlet dashboard with sales kpis clipart pdf This layout presents information on Retail outlet dashboard with sales kpis It is also available for immediate download and adjustment. So, changes can be made in the color, design, graphics or any other component to create a unique layout.


 Continue with Email

 Home
Home


