Portfolio Dashboard
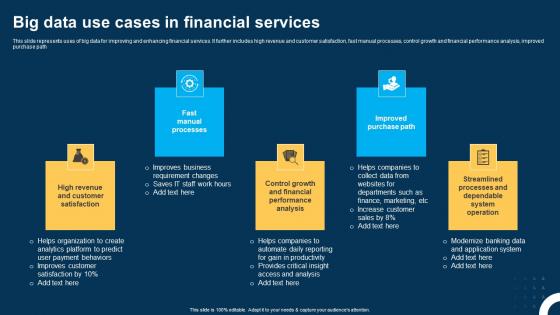
Big Data Use Cases In Financial Services Ppt Layouts Infographic Template pdf
This slide represents uses of big data for improving and enhancing financial services. It further includes high revenue and customer satisfaction, fast manual processes, control growth and financial performance analysis, improved purchase path. Showcasing this set of slides titled Big Data Use Cases In Financial Services Ppt Layouts Infographic Template pdf. The topics addressed in these templates are Fast Manual Processes, Improved Purchase Path, High Revenue. All the content presented in this PPT design is completely editable. Download it and make adjustments in color, background, font etc. as per your unique business setting. This slide represents uses of big data for improving and enhancing financial services. It further includes high revenue and customer satisfaction, fast manual processes, control growth and financial performance analysis, improved purchase path.
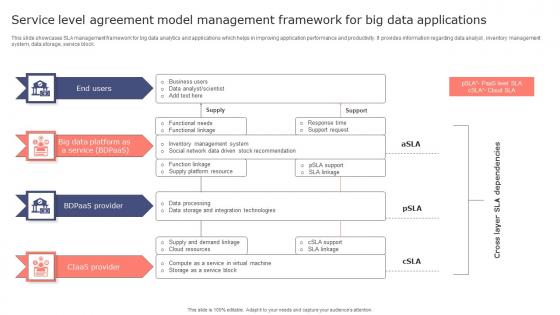
Service Level Agreement Model Management Framework For Big Data Applications Professional Pdf
This slide showcases SLA management framework for big data analytics and applications which helps in improving application performance and productivity. It provides information regarding data analyst , inventory management system, data storage, service block. Showcasing this set of slides titled Service Level Agreement Model Management Framework For Big Data Applications Professional Pdf. The topics addressed in these templates are End Users, Ciaas Provider, Bdpaas Provider. All the content presented in this PPT design is completely editable. Download it and make adjustments in color, background, font etc. as per your unique business setting. This slide showcases SLA management framework for big data analytics and applications which helps in improving application performance and productivity. It provides information regarding data analyst , inventory management system, data storage, service block.
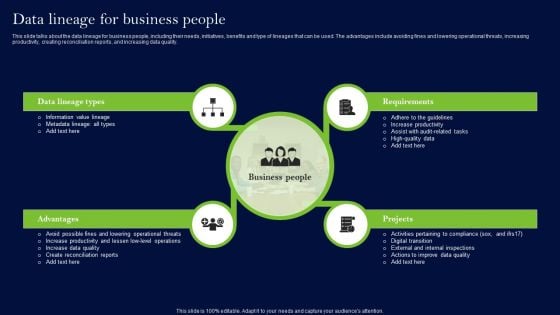
Data Lineage Methods Data Lineage For Business People Designs PDF
This slide talks about the data lineage for business people, including their needs, initiatives, benefits and type of lineages that can be used. The advantages include avoiding fines and lowering operational threats, increasing productivity, creating reconciliation reports, and increasing data quality. Find a pre-designed and impeccable Data Lineage Methods Data Lineage For Business People Designs PDF. The templates can ace your presentation without additional effort. You can download these easy-to-edit presentation templates to make your presentation stand out from others. So, what are you waiting for Download the template from Slidegeeks today and give a unique touch to your presentation.
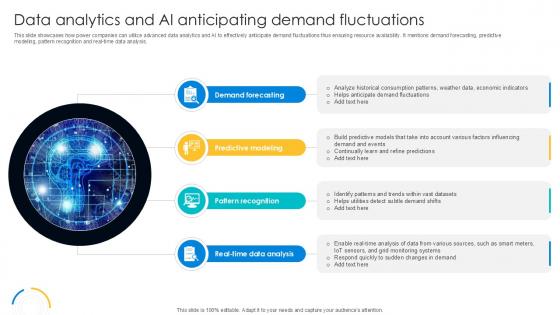
Data Analytics And AI Anticipating Digital Transformation Journey PPT Example DT SS V
This slide showcases how power companies can utilize advanced data analytics and AI to effectively anticipate demand fluctuations thus ensuring resource availability. It mentions demand forecasting, predictive modeling, pattern recognition and real-time data analysis. Formulating a presentation can take up a lot of effort and time, so the content and message should always be the primary focus. The visuals of the PowerPoint can enhance the presenters message, so our Data Analytics And AI Anticipating Digital Transformation Journey PPT Example DT SS V was created to help save time. Instead of worrying about the design, the presenter can concentrate on the message while our designers work on creating the ideal templates for whatever situation is needed. Slidegeeks has experts for everything from amazing designs to valuable content, we have put everything into Data Analytics And AI Anticipating Digital Transformation Journey PPT Example DT SS V This slide showcases how power companies can utilize advanced data analytics and AI to effectively anticipate demand fluctuations thus ensuring resource availability. It mentions demand forecasting, predictive modeling, pattern recognition and real-time data analysis.
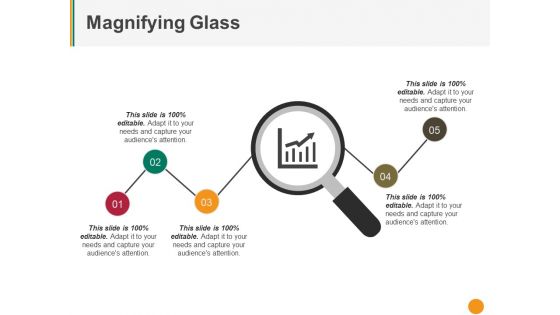
Magnifying Glass Ppt PowerPoint Presentation Ideas Graphics Design
This is a magnifying glass ppt powerpoint presentation ideas graphics design. This is a five stage process. The stages in this process are magnifying glass, business, marketing, management.
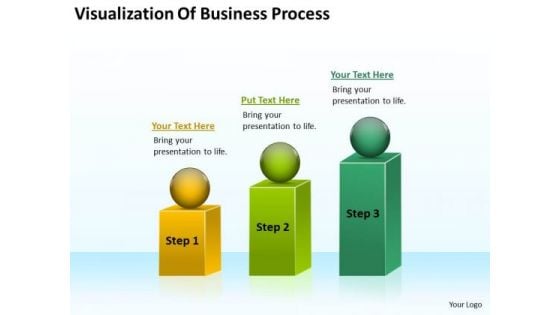
Visualization Of Business Process Ppt Plan PowerPoint Templates
We present our visualization of business process ppt plan PowerPoint templates.Present our Process and Flows PowerPoint Templates because Our PowerPoint Templates and Slides will Embellish your thoughts. They will help you illustrate the brilliance of your ideas. Download and present our Spheres PowerPoint Templates because It will Raise the bar of your Thoughts. They are programmed to take you to the next level. Use our Flow Charts PowerPoint Templates because Our PowerPoint Templates and Slides are conceived by a dedicated team. Use them and give form to your wondrous ideas. Use our Shapes PowerPoint Templates because Our PowerPoint Templates and Slides has conjured up a web of all you need with the help of our great team. Use them to string together your glistening ideas. Download and present our Marketing PowerPoint Templates because Our PowerPoint Templates and Slides will let you Leave a lasting impression to your audiences. They possess an inherent longstanding recall factor.Use these PowerPoint slides for presentations relating to Diagram, chart, market, statistics, square, grow, infograph, bar, corporate, business, vector, success, presentation, growing, circle, finance,analyst, goal, report, marketing, different, accounting, management, graph, illustration, geometric, sphere, design, growth, infographic, progress, profit,information, increase, aim, analyze, financial, rising, measure, block. The prominent colors used in the PowerPoint template are Green, Green lime, Yellow. Make an exhibition characteristic of you. Display your effectiveness on our Visualization Of Business Process Ppt Plan PowerPoint Templates.
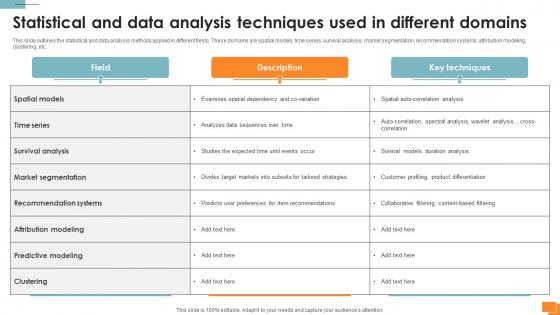
Statistical Tools For Evidence Statistical And Data Analysis Techniques Used
This slide outlines the statistical and data analysis methods applied in different fields. These domains are spatial models, time series, survival analysis, market segmentation, recommendation systems, attribution modeling, clustering, etc. There are so many reasons you need a Statistical Tools For Evidence Statistical And Data Analysis Techniques Used. The first reason is you can not spend time making everything from scratch, Thus, Slidegeeks has made presentation templates for you too. You can easily download these templates from our website easily. This slide outlines the statistical and data analysis methods applied in different fields. These domains are spatial models, time series, survival analysis, market segmentation, recommendation systems, attribution modeling, clustering, etc.

Magnifying Glass Ppt PowerPoint Presentation Ideas Background Designs
This is a magnifying glass ppt powerpoint presentation ideas background designs. This is a three stage process. The stages in this process are magnifying glass, research, marketing, management, business.
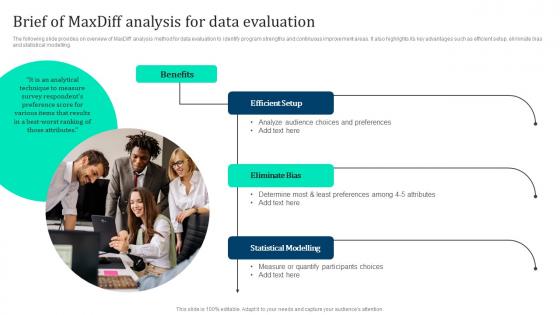
Brief Of MaxDiff Analysis Data Marketing Intelligence Guide Data Gathering Topics Pdf
The following slide provides on overview of MaxDiff analysis method for data evaluation to identify program strengths and continuous improvement areas. It also highlights its key advantages such as efficient setup, eliminate bias and statistical modelling. There are so many reasons you need a Brief Of MaxDiff Analysis Data Marketing Intelligence Guide Data Gathering Topics Pdf. The first reason is you can not spend time making everything from scratch, Thus, Slidegeeks has made presentation templates for you too. You can easily download these templates from our website easily. The following slide provides on overview of MaxDiff analysis method for data evaluation to identify program strengths and continuous improvement areas. It also highlights its key advantages such as efficient setup, eliminate bias and statistical modelling.

PowerPoint Business 3d Man And Blue Folder Slides
We present our powerpoint business 3d man and blue folder Slides.Present our Computer PowerPoint Templates because Our PowerPoint Templates and Slides offer you the needful to organise your thoughts. Use them to list out your views in a logical sequence. Use our Business PowerPoint Templates because You are working at that stage with an air of royalty. Let our PowerPoint Templates and Slides be the jewels in your crown. Use our Symbol PowerPoint Templates because You should Bet on your luck with our PowerPoint Templates and Slides. Be assured that you will hit the jackpot. Use our Technology PowerPoint Templates because These PowerPoint Templates and Slides will give the updraft to your ideas. See them soar to great heights with ease. Present our Symbol PowerPoint Templates because These PowerPoint Templates and Slides will give the updraft to your ideas. See them soar to great heights with ease.Use these PowerPoint slides for presentations relating to 3d, Archives, Arranging, Blue, Bureaucracy, Character, Collection, Computer, Data, Different, Digitally, Directory, Document, Figure, File, Folder, Generated, Group, Guy, Human, Icon, Illustration, Information, Isolated, Men, One, Order, Organization, Organized, Paper, Paperwork, People, Person, Portfolio, Puppet, Red, Reflection, Render, Report, Row, Storage, Supported, Symbol, Unique. The prominent colors used in the PowerPoint template are Blue, Red, White. We assure you our powerpoint business 3d man and blue folder Slides are the best it can get when it comes to presenting. Use our Collection PowerPoint templates and PPT Slides are effectively colour coded to prioritise your plans They automatically highlight the sequence of events you desire. We assure you our powerpoint business 3d man and blue folder Slides will save the presenter time. Professionals tell us our Collection PowerPoint templates and PPT Slides will help them to explain complicated concepts. The feedback we get is that our powerpoint business 3d man and blue folder Slides are specially created by a professional team with vast experience. They diligently strive to come up with the right vehicle for your brilliant Ideas. You can be sure our Arranging PowerPoint templates and PPT Slides will help them to explain complicated concepts. Create alliances with our PowerPoint Business 3d Man And Blue Folder Slides. Generate familiarity within your team.
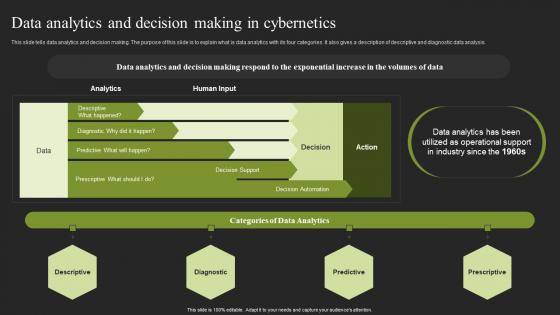
Data Analytics And Decision Making In Cybernetics Cybernetic Systems Inspiration Pdf
This slide tells data analytics and decision making. The purpose of this slide is to explain what is data analytics with its four categories. It also gives a description of descriptive and diagnostic data analysis. Welcome to our selection of the Data Analytics And Decision Making In Cybernetics Cybernetic Systems Inspiration Pdf. These are designed to help you showcase your creativity and bring your sphere to life. Planning and Innovation are essential for any business that is just starting out. This collection contains the designs that you need for your everyday presentations. All of our PowerPoints are 100 percent editable, so you can customize them to suit your needs. This multi purpose template can be used in various situations. Grab these presentation templates today This slide tells data analytics and decision making. The purpose of this slide is to explain what is data analytics with its four categories. It also gives a description of descriptive and diagnostic data analysis.
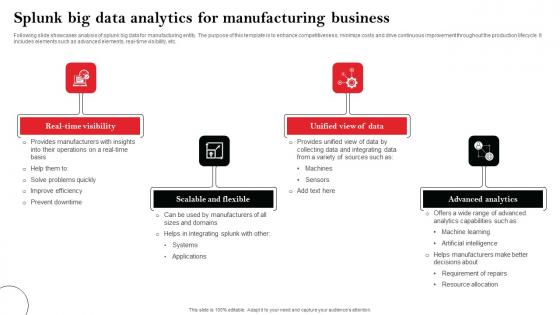
Splunk Big Data Analytics For Manufacturing Business Ideas Pdf
Following slide showcases analysis of splunk big data for manufacturing entity. The purpose of this template is to enhance competitiveness, minimize costs and drive continuous improvement throughout the production lifecycle. It includes elements such as advanced elements, real-time visibility, etc. Pitch your topic with ease and precision using this Splunk Big Data Analytics For Manufacturing Business Ideas Pdf This layout presents information on Real-Time Visibility, Scalable And Flexible, Advanced Analytics It is also available for immediate download and adjustment. So, changes can be made in the color, design, graphics or any other component to create a unique layout. Following slide showcases analysis of splunk big data for manufacturing entity. The purpose of this template is to enhance competitiveness, minimize costs and drive continuous improvement throughout the production lifecycle. It includes elements such as advanced elements, real-time visibility, etc.
Icons Slide For Predictive Analytics For Empowering Data Driven Decision Making Designs Pdf
Download our innovative and attention grabbing Icons Slide For Predictive Analytics For Empowering Data Driven Decision Making Designs Pdf template. The set of slides exhibit completely customizable icons. These icons can be incorporated into any business presentation. So download it immediately to clearly communicate with your clientele. Our Icons Slide For Predictive Analytics For Empowering Data Driven Decision Making Designs Pdf are topically designed to provide an attractive backdrop to any subject. Use them to look like a presentation pro.

Web Marketing Analysis Diagram Ppt Slides Design
This is a web marketing analysis diagram ppt slides design. This is a five stage process. The stages in this process are communication, global reach, growth, business plan, financial.

Data Analytics Metrics For Internal Audit Ppt Model Outfit PDF
This slide covers the KPIs key performance indicators of data analytics for conducting internal audit. It includes information related to the reporting, planning and audit execution. Presenting Data Analytics Metrics For Internal Audit Ppt Model Outfit PDF to dispense important information. This template comprises three stages. It also presents valuable insights into the topics including Planning, Audit Execution, Reporting. This is a completely customizable PowerPoint theme that can be put to use immediately. So, download it and address the topic impactfully.
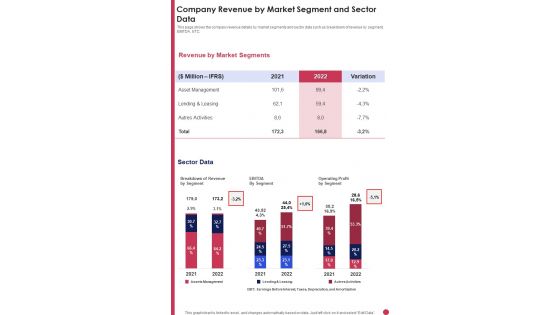
Company Revenue By Market Segment And Sector Data Template 281 One Pager Documents
This page shows the company revenue details by market segments and sector data such as breakdown of revenue by segment, EBITDA, ETC. Presenting you a fantastic Company Revenue By Market Segment And Sector Data Template 281 One Pager Documents. This piece is crafted on hours of research and professional design efforts to ensure you have the best resource. It is completely editable and its design allow you to rehash its elements to suit your needs. Get this Company Revenue By Market Segment And Sector Data Template 281 One Pager Documents A4 One-pager now.
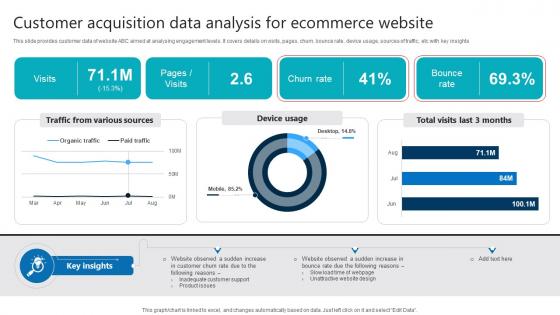
Customer Acquisition Data Analysis For Ecommerce Website Product Analytics Implementation Data Analytics V
This slide provides customer data of website ABC aimed at analysing engagement levels. It covers details on visits, pages, churn, bounce rate, device usage, sources of traffic, etc with key insights If you are looking for a format to display your unique thoughts, then the professionally designed Customer Acquisition Data Analysis For Ecommerce Website Product Analytics Implementation Data Analytics V is the one for you. You can use it as a Google Slides template or a PowerPoint template. Incorporate impressive visuals, symbols, images, and other charts. Modify or reorganize the text boxes as you desire. Experiment with shade schemes and font pairings. Alter, share or cooperate with other people on your work. Download Customer Acquisition Data Analysis For Ecommerce Website Product Analytics Implementation Data Analytics V and find out how to give a successful presentation. Present a perfect display to your team and make your presentation unforgettable. This slide provides customer data of website ABC aimed at analysing engagement levels. It covers details on visits, pages, churn, bounce rate, device usage, sources of traffic, etc with key insights
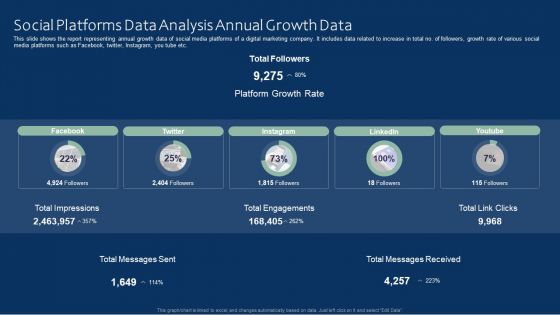
Social Platforms Data Analysis Annual Growth Data Ideas PDF
This slide shows the report representing annual growth data of social media platforms of a digital marketing company. It includes data related to increase in total no. of followers, growth rate of various social media platforms such as Facebook, twitter, Instagram, you tube etc. Pitch your topic with ease and precision using this Social Platforms Data Analysis Annual Growth Data Ideas PDF. This layout presents information on Social Platforms Data Analysis, Annual Growth Data. It is also available for immediate download and adjustment. So, changes can be made in the color, design, graphics or any other component to create a unique layout.
Analysis Icon Of Latest Market Research Trend Ppt PowerPoint Presentation File Images PDF
Persuade your audience using this analysis icon of latest market research trend ppt powerpoint presentation file images pdf. This PPT design covers one stages, thus making it a great tool to use. It also caters to a variety of topics including analysis icon of latest market research trend. Download this PPT design now to present a convincing pitch that not only emphasizes the topic but also showcases your presentation skills.
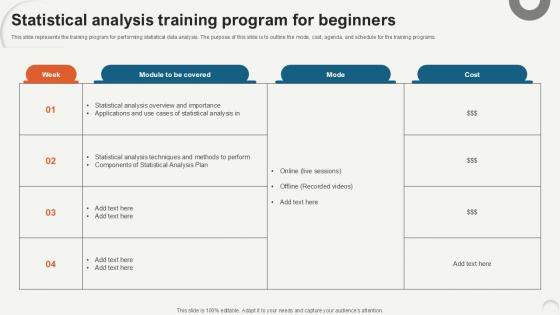
Statistical Analysis Training Program Data Analytics For Informed Decision Ppt Template
This slide represents the training program for performing statistical data analysis. The purpose of this slide is to outline the mode, cost, agenda, and schedule for the training programs. Take your projects to the next level with our ultimate collection of Statistical Analysis Training Program Data Analytics For Informed Decision Ppt Template. Slidegeeks has designed a range of layouts that are perfect for representing task or activity duration, keeping track of all your deadlines at a glance. Tailor these designs to your exact needs and give them a truly corporate look with your own brand colors they will make your projects stand out from the rest This slide represents the training program for performing statistical data analysis. The purpose of this slide is to outline the mode, cost, agenda, and schedule for the training programs.
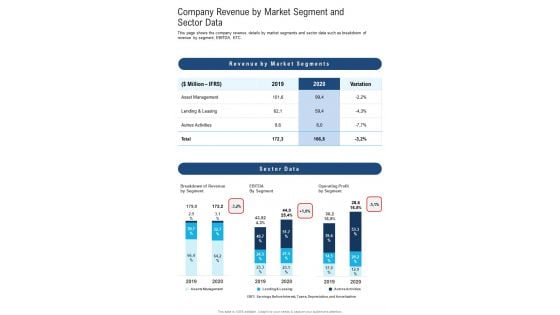
Company Revenue By Market Segment And Sector Data One Pager Documents
Presenting you an exemplary Company Revenue By Market Segment And Sector Data One Pager Documents. Our one-pager comprises all the must-have essentials of an inclusive document. You can edit it with ease, as its layout is completely editable. With such freedom, you can tweak its design and other elements to your requirements. Download this Company Revenue By Market Segment And Sector Data One Pager Documents brilliant piece now.
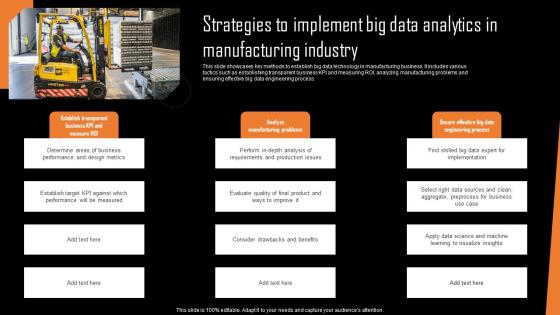
Strategies To Implement Big Data Analytics In Manufacturing Industry Portrait Pdf
This slide showcases key methods to establish big data technology in manufacturing business. It includes various tactics such as establishing transparent business KPI and measuring ROI, analyzing manufacturing problems and ensuring effective big data engineering process.Pitch your topic with ease and precision using this Strategies To Implement Big Data Analytics In Manufacturing Industry Portrait Pdf This layout presents information on Determine Areas, Performance Design Metrics, Performance Measured It is also available for immediate download and adjustment. So, changes can be made in the color, design, graphics or any other component to create a unique layout. This slide showcases key methods to establish big data technology in manufacturing business. It includes various tactics such as establishing transparent business KPI and measuring ROI, analyzing manufacturing problems and ensuring effective big data engineering process.
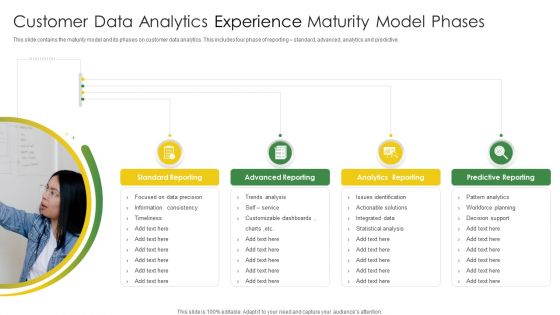
Customer Data Analytics Experience Maturity Model Phases Download PDF
This slide contains the maturity model and its phases on customer data analytics. This includes four phase of reporting standard, advanced, analytics and predictive. Presenting Customer Data Analytics Experience Maturity Model Phases Download PDF to dispense important information. This template comprises four stages. It also presents valuable insights into the topics including Advanced Reporting, Analytics Reporting, Predictive Reporting, Standard Reporting. This is a completely customizable PowerPoint theme that can be put to use immediately. So, download it and address the topic impactfully.
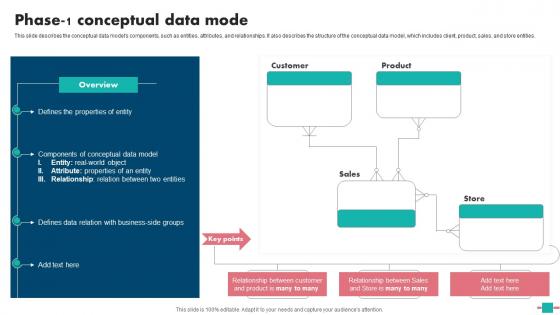
Database Modeling Phase 1 Conceptual Data Mode Formats Pdf
This slide describes the conceptual data models components, such as entities, attributes, and relationships. It also describes the structure of the conceptual data model, which includes client, product, sales, and store entities. Are you in need of a template that can accommodate all of your creative concepts This one is crafted professionally and can be altered to fit any style. Use it with Google Slides or PowerPoint. Include striking photographs, symbols, depictions, and other visuals. Fill, move around, or remove text boxes as desired. Test out color palettes and font mixtures. Edit and save your work, or work with colleagues. Download Database Modeling Phase 1 Conceptual Data Mode Formats Pdf and observe how to make your presentation outstanding. Give an impeccable presentation to your group and make your presentation unforgettable. This slide describes the conceptual data models components, such as entities, attributes, and relationships. It also describes the structure of the conceptual data model, which includes client, product, sales, and store entities.
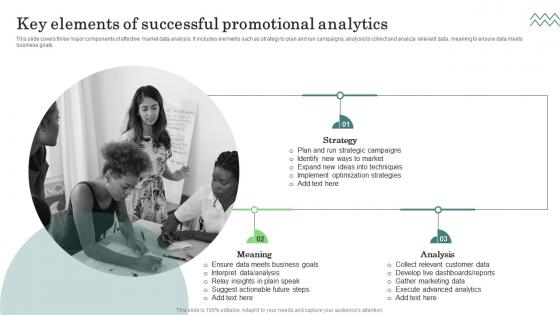
Key Elements Successful Major Promotional Analytics Future Trends Summary Pdf
This slide covers three major components of effective market data analysis. It includes elements such as strategy to plan and run campaigns, analysis to collect and analyze relevant data, meaning to ensure data meets business goals. Explore a selection of the finest Key Elements Successful Major Promotional Analytics Future Trends Summary Pdf here. With a plethora of professionally designed and pre made slide templates, you can quickly and easily find the right one for your upcoming presentation. You can use our Key Elements Successful Major Promotional Analytics Future Trends Summary Pdf to effectively convey your message to a wider audience. Slidegeeks has done a lot of research before preparing these presentation templates. The content can be personalized and the slides are highly editable. Grab templates today from Slidegeeks. This slide covers three major components of effective market data analysis. It includes elements such as strategy to plan and run campaigns, analysis to collect and analyze relevant data, meaning to ensure data meets business goals.
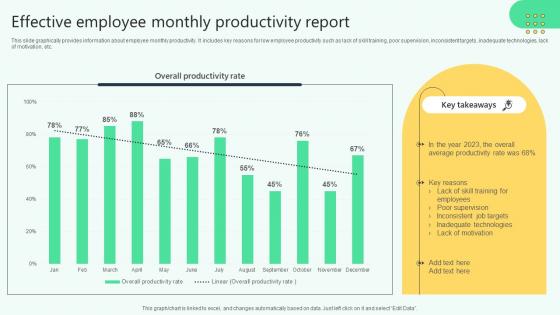
Effective Employee Monthly Productivity Report Analysing Hr Data For Effective Decision Making
This slide graphically provides information about employee monthly productivity. It includes key reasons for low employee productivity such as lack of skill training, poor supervision, inconsistent targets, inadequate technologies, lack of motivation, etc. If your project calls for a presentation, then Slidegeeks is your go-to partner because we have professionally designed, easy-to-edit templates that are perfect for any presentation. After downloading, you can easily edit Effective Employee Monthly Productivity Report Analysing Hr Data For Effective Decision Making and make the changes accordingly. You can rearrange slides or fill them with different images. Check out all the handy templates This slide graphically provides information about employee monthly productivity. It includes key reasons for low employee productivity such as lack of skill training, poor supervision, inconsistent targets, inadequate technologies, lack of motivation, etc.
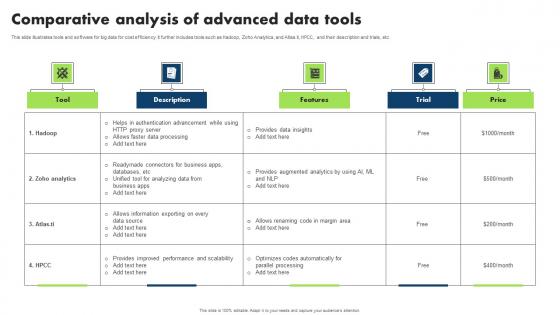
Comparative Analysis Of Advanced Data Tools Template Pdf
This slide illustrates tools and software for big data for cost efficiency. It further includes tools such as Hadoop, Zoho Analytics, and Atlas.ti, HPCC, and their description and trials, etc Showcasing this set of slides titled Comparative Analysis Of Advanced Data Tools Template Pdf. The topics addressed in these templates are Hadoop, Readymade Connectors Business, Unified Tool Analyzing Data. All the content presented in this PPT design is completely editable. Download it and make adjustments in color, background, font etc. as per your unique business setting. This slide illustrates tools and software for big data for cost efficiency. It further includes tools such as Hadoop, Zoho Analytics, and Atlas.ti, HPCC, and their description and trials, etc
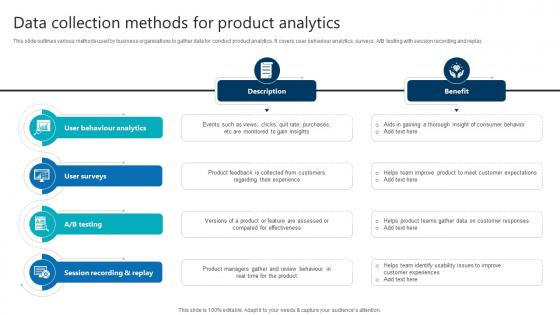
Data Collection Methods For Product Analytics Product Analytics Implementation Data Analytics V
This slide outlines various methods used by business organisations to gather data for conduct product analytics. It covers user behaviour analytics, surveys, A or B testing with session recording and replay.Crafting an eye-catching presentation has never been more straightforward. Let your presentation shine with this tasteful yet straightforward Data Collection Methods For Product Analytics Product Analytics Implementation Data Analytics V template. It offers a minimalistic and classy look that is great for making a statement. The colors have been employed intelligently to add a bit of playfulness while still remaining professional. Construct the ideal Data Collection Methods For Product Analytics Product Analytics Implementation Data Analytics V that effortlessly grabs the attention of your audience Begin now and be certain to wow your customers This slide outlines various methods used by business organisations to gather data for conduct product analytics. It covers user behaviour analytics, surveys, A or B testing with session recording and replay.
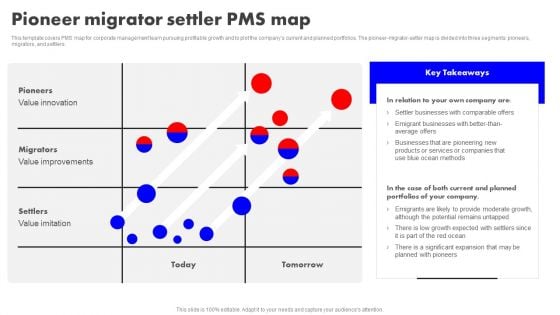
Detailed Analysis Of Red Ocean Vs Blue Ocean Approach Pioneer Migrator Settler PMS Map Brochure PDF
This template covers PMS map for corporate management team pursuing profitable growth and to plot the companys current and planned portfolios. The pioneer-migrator-setter map is divided into three segments pioneers, migrators, and settlers. The Detailed Analysis Of Red Ocean Vs Blue Ocean Approach Pioneer Migrator Settler PMS Map Brochure PDF is a compilation of the most recent design trends as a series of slides. It is suitable for any subject or industry presentation, containing attractive visuals and photo spots for businesses to clearly express their messages. This template contains a variety of slides for the user to input data, such as structures to contrast two elements, bullet points, and slides for written information. Slidegeeks is prepared to create an impression.
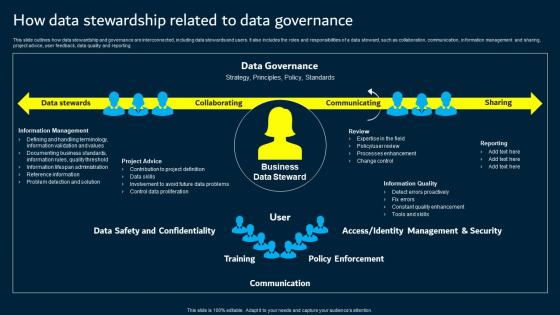
How Data Stewardship Related To Data Governance Data Custodianship Portrait Pdf
This slide outlines how data stewardship and governance are interconnected, including data stewards and users. It also includes the roles and responsibilities of a data steward, such as collaboration, communication, information management and sharing, project advice, user feedback, data quality and reporting. If your project calls for a presentation, then Slidegeeks is your go to partner because we have professionally designed, easy to edit templates that are perfect for any presentation. After downloading, you can easily edit How Data Stewardship Related To Data Governance Data Custodianship Portrait Pdf and make the changes accordingly. You can rearrange slides or fill them with different images. Check out all the handy templates This slide outlines how data stewardship and governance are interconnected, including data stewards and users. It also includes the roles and responsibilities of a data steward, such as collaboration, communication, information management and sharing, project advice, user feedback, data quality and reporting.
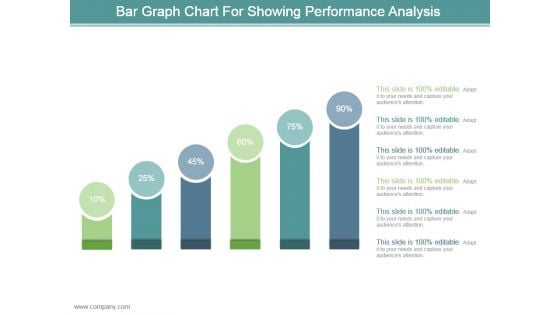
Bar Graph Chart For Showing Performance Analysis Ppt Design
This is a bar graph chart for showing performance analysis ppt design. This is a six stage process. The stages in this process are business, marketing, process, success, presentation.
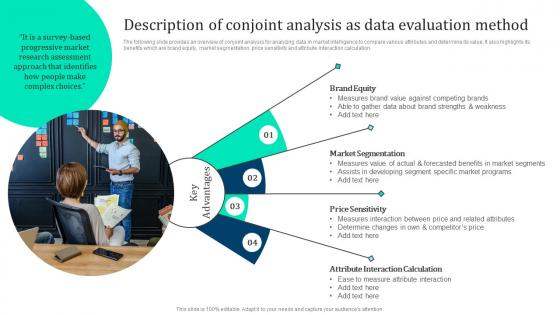
Description Conjoint Analysis Data Marketing Intelligence Guide Data Gathering Microsoft Pdf
The following slide provides an overview of conjoint analysis for analyzing data in market intelligence to compare various attributes and determine its value. It also highlights its benefits which are brand equity, market segmentation, price sensitivity and attribute interaction calculation. Do you have an important presentation coming up Are you looking for something that will make your presentation stand out from the rest Look no further than Description Conjoint Analysis Data Marketing Intelligence Guide Data Gathering Microsoft Pdf. With our professional designs, you can trust that your presentation will pop and make delivering it a smooth process. And with Slidegeeks, you can trust that your presentation will be unique and memorable. So why wait Grab Description Conjoint Analysis Data Marketing Intelligence Guide Data Gathering Microsoft Pdf today and make your presentation stand out from the rest The following slide provides an overview of conjoint analysis for analyzing data in market intelligence to compare various attributes and determine its value. It also highlights its benefits which are brand equity, market segmentation, price sensitivity and attribute interaction calculation.
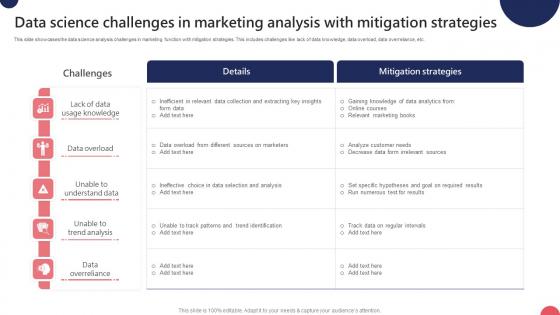
Data Science Challenges In Marketing Analysis With Mitigation Strategies Ppt Outline Pdf
This slide showcases the data science analysis challenges in marketing function with mitigation strategies. This includes challenges like lack of data knowledge, data overload, data overreliance, etc. Pitch your topic with ease and precision using this Data Science Challenges In Marketing Analysis With Mitigation Strategies Ppt Outline Pdf. This layout presents information on Data Knowledge, Data Overload, Data Overreliance. It is also available for immediate download and adjustment. So, changes can be made in the color, design, graphics or any other component to create a unique layout. This slide showcases the data science analysis challenges in marketing function with mitigation strategies. This includes challenges like lack of data knowledge, data overload, data overreliance, etc.
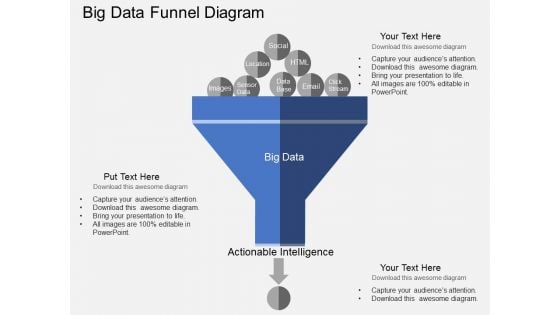
Big Data Funnel Diagram Powerpoint Templates
Our above business slide has been designed with graphics of big data funnel diagram. This slide is suitable to present data analysis, storage and sharing. Use this business diagram to present your work in a more smart and precise manner.
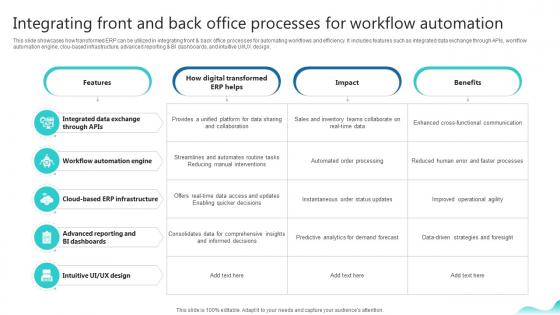
Integrating Front And Back Office Processes For Workflow Erp And Digital Transformation For Maximizing DT SS V
This slide showcases how transformed ERP can be utilized in integrating front and back office processes for automating workflows and efficiency. It includes features such as integrated data exchange through APIs, workflow automation engine, clou-based infrastructure, advanced reporting and BI dashboards, and intuitive UI or UX design. Slidegeeks is here to make your presentations a breeze with Integrating Front And Back Office Processes For Workflow Erp And Digital Transformation For Maximizing DT SS V With our easy-to-use and customizable templates, you can focus on delivering your ideas rather than worrying about formatting. With a variety of designs to choose from, you are sure to find one that suits your needs. And with animations and unique photos, illustrations, and fonts, you can make your presentation pop. So whether you are giving a sales pitch or presenting to the board, make sure to check out Slidegeeks first This slide showcases how transformed ERP can be utilized in integrating front and back office processes for automating workflows and efficiency. It includes features such as integrated data exchange through APIs, workflow automation engine, clou-based infrastructure, advanced reporting and BI dashboards, and intuitive UI or UX design.
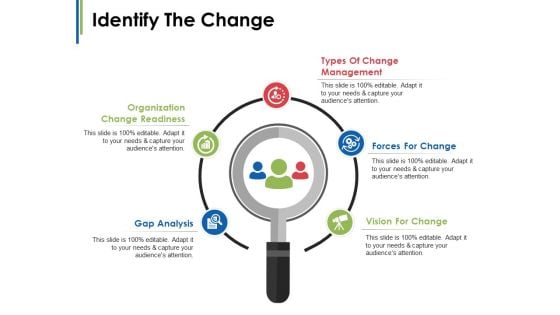
Identify The Change Ppt PowerPoint Presentation Model Introduction
This is a identify the change ppt powerpoint presentation model introduction. This is a five stage process. The stages in this process are organization change readiness, gap analysis, types of change management, forces for change, vision for change.

Data Analysis Types Provides By BI Mockup Pdf
This slide represents the type of analytics provided by the business intelligence for business performance enhancement. This includes descriptive analysis, diagnostic analysis, predictive analytics, etc. Pitch your topic with ease and precision using this Data Analysis Types Provides By BI Mockup Pdf. This layout presents information on Descriptive Analytics, Diagnostic Analytics, Predictive Analytics. It is also available for immediate download and adjustment. So, changes can be made in the color, design, graphics or any other component to create a unique layout. This slide represents the type of analytics provided by the business intelligence for business performance enhancement. This includes descriptive analysis, diagnostic analysis, predictive analytics, etc.
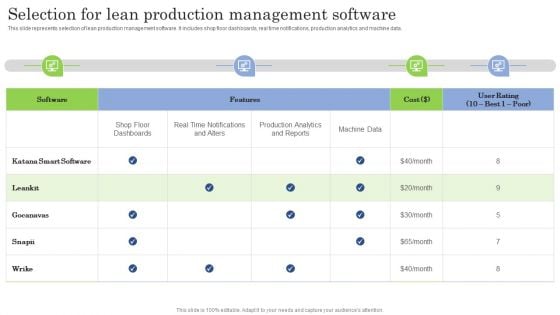
Selection For Lean Production Management Software Ppt PowerPoint Presentation Diagram PDF
This slide represents selection of lean production management software. It includes shop floor dashboards, real time notifications, production analytics and machine data. Are you searching for a Selection For Lean Production Management Software Ppt PowerPoint Presentation Diagram PDF that is uncluttered, straightforward, and original Its easy to edit, and you can change the colors to suit your personal or business branding. For a presentation that expresses how much effort you have put in, this template is ideal. With all of its features, including tables, diagrams, statistics, and lists, its perfect for a business plan presentation. Make your ideas more appealing with these professional slides. Download Selection For Lean Production Management Software Ppt PowerPoint Presentation Diagram PDF from Slidegeeks today.
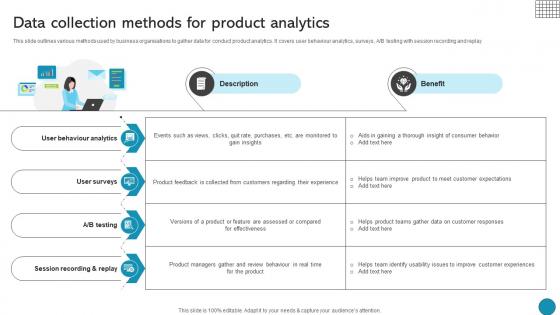
Data Collection Methods For Product Analytics Driving Business Success Integrating Product
This slide outlines various methods used by business organisations to gather data for conduct product analytics. It covers user behaviour analytics, surveys, A or B testing with session recording and replay Crafting an eye-catching presentation has never been more straightforward. Let your presentation shine with this tasteful yet straightforward Data Collection Methods For Product Analytics Driving Business Success Integrating Product template. It offers a minimalistic and classy look that is great for making a statement. The colors have been employed intelligently to add a bit of playfulness while still remaining professional. Construct the ideal Data Collection Methods For Product Analytics Driving Business Success Integrating Product that effortlessly grabs the attention of your audience Begin now and be certain to wow your customers This slide outlines various methods used by business organisations to gather data for conduct product analytics. It covers user behaviour analytics, surveys, A or B testing with session recording and replay
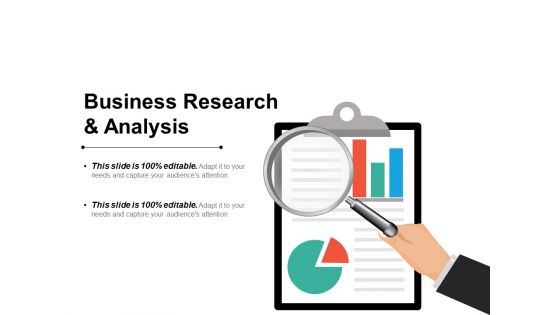
Business Research And Analysis Ppt PowerPoint Presentation Ideas Graphics Design
This is a business research and analysis ppt powerpoint presentation ideas graphics design. This is a three stage process. The stages in this process are support, assistance, hand holding.
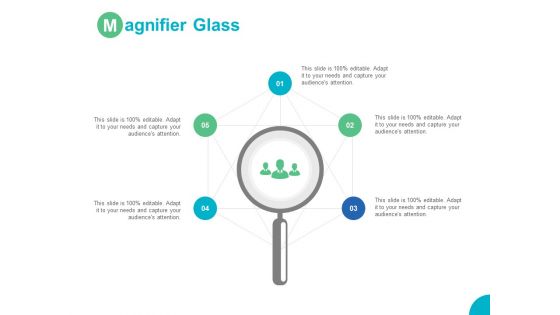
Magnifier Glass Data Analysis Ppt PowerPoint Presentation Model Elements
Presenting this set of slides with name magnifier glass data analysis ppt powerpoint presentation model elements. This is a five stage process. The stages in this process are technology, marketing, planning, business, management. This is a completely editable PowerPoint presentation and is available for immediate download. Download now and impress your audience.
Recent BI Analysis Trends For Performance Enhancements Icons Pdf
This slide showcases the recent trends in BI analytics for business performance enhancement. This includes trends like augmented analytics, data discovery, data storytelling, Data quality management, etc. Pitch your topic with ease and precision using this Recent BI Analysis Trends For Performance Enhancements Icons Pdf. This layout presents information on Collaborative Business Intelligence, Embedded Analytics, Data Governance. It is also available for immediate download and adjustment. So, changes can be made in the color, design, graphics or any other component to create a unique layout. This slide showcases the recent trends in BI analytics for business performance enhancement. This includes trends like augmented analytics, data discovery, data storytelling, Data quality management, etc.
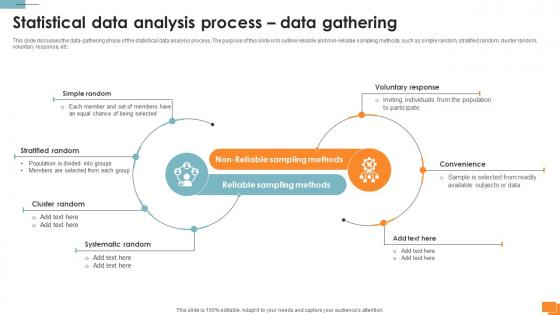
A132 Statistical Tools For Evidence Statistical Data Analysis Process Data Gathering
This slide discusses the data-gathering phase of the statistical data analysis process. The purpose of this slide is to outline reliable and non-reliable sampling methods, such as simple random, stratified random, cluster random, voluntary response, etc. Find a pre-designed and impeccable A132 Statistical Tools For Evidence Statistical Data Analysis Process Data Gathering. The templates can ace your presentation without additional effort. You can download these easy-to-edit presentation templates to make your presentation stand out from others. So, what are you waiting for Download the template from Slidegeeks today and give a unique touch to your presentation. This slide discusses the data-gathering phase of the statistical data analysis process. The purpose of this slide is to outline reliable and non-reliable sampling methods, such as simple random, stratified random, cluster random, voluntary response, etc.

Product Analytics Tool 2 Adobe Analytics To Generate Data Product Analytics Implementation Data Analytics V
This slide provides an overview of product analytic tool Adobe Analytics. It covers details regarding tool description, benefits and pricing plans such as select, prime and ultimate.Slidegeeks is here to make your presentations a breeze with Product Analytics Tool 2 Adobe Analytics To Generate Data Product Analytics Implementation Data Analytics V With our easy-to-use and customizable templates, you can focus on delivering your ideas rather than worrying about formatting. With a variety of designs to choose from, you are sure to find one that suits your needs. And with animations and unique photos, illustrations, and fonts, you can make your presentation pop. So whether you are giving a sales pitch or presenting to the board, make sure to check out Slidegeeks first This slide provides an overview of product analytic tool Adobe Analytics. It covers details regarding tool description, benefits and pricing plans such as select, prime and ultimate.

Marketing Intelligence Guide For Data Gathering And Analysis Ppt Powerpoint Presentation Complete Deck
Heres another Marketing Intelligence Guide For Data Gathering And Analysis Ppt Powerpoint Presentation Complete Deck that highlights your vision and mission for business. You can customize this template as per your liking and bring your passion and skills in the industry you have chosen to be in under the spotlight. Moreover,you can print this business plan template and share it with your employees to maintain clarity of thought. Click the link below and gain instant access to this complete deck of seventy nine slides. All of this is,of course,made even better with the capability of editability and complete customization that we offer. Download now. Our Marketing Intelligence Guide For Data Gathering And Analysis Ppt Powerpoint Presentation Complete Deck are topically designed to provide an attractive backdrop to any subject. Use them to look like a presentation pro.
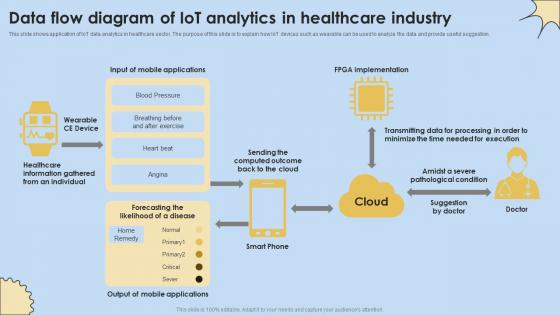
Data Flow Diagram Of IoT Analytics In Healthcare Industry Internet Of Things Analysis Clipart Pdf
This slide shows application of IoT data analytics in healthcare sector. The purpose of this slide is to explain how IoT devices such as wearable can be used to analyze the data and provide useful suggestion. If you are looking for a format to display your unique thoughts, then the professionally designed Data Flow Diagram Of IoT Analytics In Healthcare Industry Internet Of Things Analysis Clipart Pdf is the one for you. You can use it as a Google Slides template or a PowerPoint template. Incorporate impressive visuals, symbols, images, and other charts. Modify or reorganize the text boxes as you desire. Experiment with shade schemes and font pairings. Alter, share or cooperate with other people on your work. Download Data Flow Diagram Of IoT Analytics In Healthcare Industry Internet Of Things Analysis Clipart Pdf and find out how to give a successful presentation. Present a perfect display to your team and make your presentation unforgettable. This slide shows application of IoT data analytics in healthcare sector. The purpose of this slide is to explain how IoT devices such as wearable can be used to analyze the data and provide useful suggestion.

Integration Of Big Data Text And Predictive Analytics PPT Example SS
This slide outlines the integrated architecture of big data, text analytics, and predictive analytics, including elements deployment, modeling, statistics, etc. Welcome to our selection of the Integration Of Big Data Text And Predictive Analytics PPT Example SS. These are designed to help you showcase your creativity and bring your sphere to life. Planning and Innovation are essential for any business that is just starting out. This collection contains the designs that you need for your everyday presentations. All of our PowerPoints are 100Percent editable, so you can customize them to suit your needs. This multi-purpose template can be used in various situations. Grab these presentation templates today. This slide outlines the integrated architecture of big data, text analytics, and predictive analytics, including elements deployment, modeling, statistics, etc.

Data Democratization Challenges In Product Data Analytics Ideas Pdf
This slide represents the data democratization challenges for product data analytics with relevant mitigation strategies. These challenges include challenges like complication of data analytics architecture, lack of data centralization, etc. Showcasing this set of slides titled Data Democratization Challenges In Product Data Analytics Ideas Pdf. The topics addressed in these templates are Data Privacy And Security, Data Literacy , Data Reliability And Homogeneity. All the content presented in this PPT design is completely editable. Download it and make adjustments in color, background, font etc. as per your unique business setting. This slide represents the data democratization challenges for product data analytics with relevant mitigation strategies. These challenges include challenges like complication of data analytics architecture, lack of data centralization, etc.
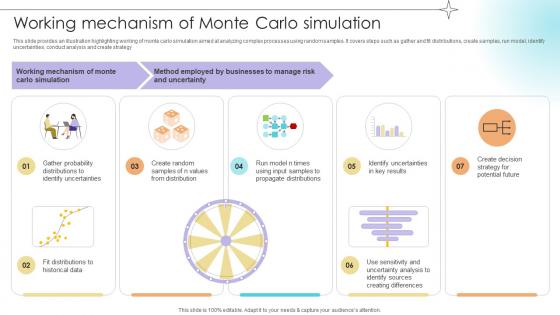
Working Mechanism Of Monte Carlo Simulation Data Analytics SS V
This slide provides an illustration highlighting working of monte carlo simulation aimed at analyzing complex processes using random samples. It covers steps such as gather and fit distributions, create samples, run model, identify uncertainties, conduct analysis and create strategy.Slidegeeks has constructed Working Mechanism Of Monte Carlo Simulation Data Analytics SS V after conducting extensive research and examination. These presentation templates are constantly being generated and modified based on user preferences and critiques from editors. Here, you will find the most attractive templates for a range of purposes while taking into account ratings and remarks from users regarding the content. This is an excellent jumping-off point to explore our content and will give new users an insight into our top-notch PowerPoint Templates. This slide provides an illustration highlighting working of monte carlo simulation aimed at analyzing complex processes using random samples. It covers steps such as gather and fit distributions, create samples, run model, identify uncertainties, conduct analysis and create strategy.
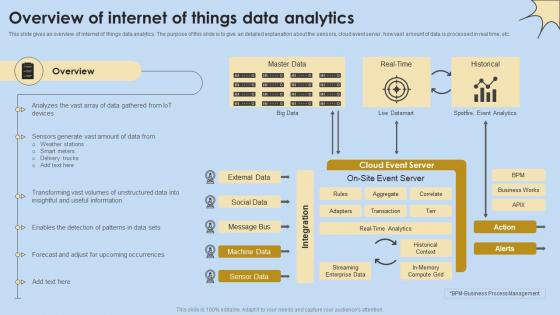
Overview Of Internet Of Things Data Analytics Internet Of Things Analysis Clipart Pdf
This slide gives an overview of internet of things data analytics. The purpose of this slide is to give an detailed explanation about the sensors, cloud event server, how vast amount of data is processed in real time, etc. Retrieve professionally designed Overview Of Internet Of Things Data Analytics Internet Of Things Analysis Clipart Pdf to effectively convey your message and captivate your listeners. Save time by selecting pre-made slideshows that are appropriate for various topics, from business to educational purposes. These themes come in many different styles, from creative to corporate, and all of them are easily adjustable and can be edited quickly. Access them as PowerPoint templates or as Google Slides themes. You do not have to go on a hunt for the perfect presentation because Slidegeeks got you covered from everywhere. This slide gives an overview of internet of things data analytics. The purpose of this slide is to give an detailed explanation about the sensors, cloud event server, how vast amount of data is processed in real time, etc.
Comparing Future Analytics Based Marketing With Other Trends Icons Pdf
This slide shows comparison of future data driven marketing size with other trends such as digital marketing and influencer marketing. It include key insights, future market size of various marketing trends etc.Pitch your topic with ease and precision using this Comparing Future Analytics Based Marketing With Other Trends Icons Pdf This layout presents information on Influencer Marketing, Digital Marketing, Data Driven Marketing It is also available for immediate download and adjustment. So, changes can be made in the color, design, graphics or any other component to create a unique layout. This slide shows comparison of future data driven marketing size with other trends such as digital marketing and influencer marketing. It include key insights, future market size of various marketing trends etc.
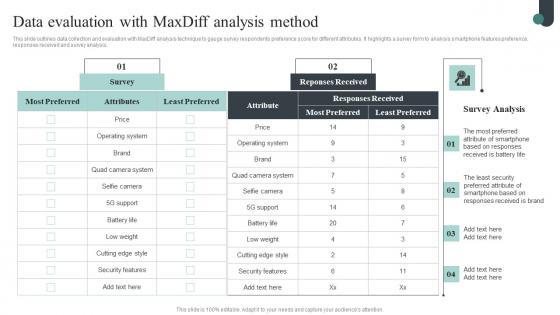
Data Evaluation With Maxdiff Analysis Competitive Intelligence Guide To Determine Market Sample Pdf
This slide outlines data collection and evaluation with MaxDiff analysis technique to gauge survey respondents preference score for different attributes. It highlights a survey form to analysis smartphone features preference, responses received and survey analysis. This Data Collection Sample From Marketing Competitive Intelligence Guide To Determine Market Topics Pdf from Slidegeeks makes it easy to present information on your topic with precision. It provides customization options, so you can make changes to the colors, design, graphics, or any other component to create a unique layout. It is also available for immediate download, so you can begin using it right away. Slidegeeks has done good research to ensure that you have everything you need to make your presentation stand out. Make a name out there for a brilliant performance. This slide outlines data collection and evaluation with MaxDiff analysis technique to gauge survey respondents preference score for different attributes. It highlights a survey form to analysis smartphone features preference, responses received and survey analysis.
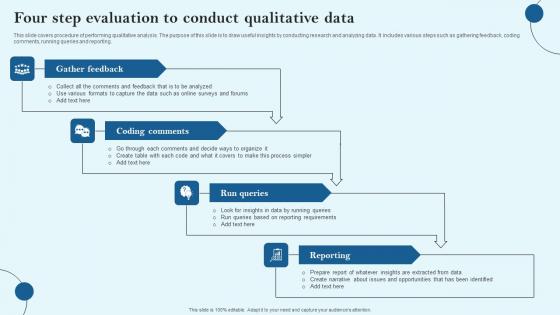
Four Step Evaluation To Conduct Qualitative Data Graphics Pdf
This slide covers procedure of performing qualitative analysis. The purpose of this slide is to draw useful insights by conducting research and analyzing data. It includes various steps such as gathering feedback, coding comments, running queries and reporting. Showcasing this set of slides titled Four Step Evaluation To Conduct Qualitative Data Graphics Pdf The topics addressed in these templates are Gather Feedback, Coding Comments, Run Queries All the content presented in this PPT design is completely editable. Download it and make adjustments in color, background, font etc. as per your unique business setting. This slide covers procedure of performing qualitative analysis. The purpose of this slide is to draw useful insights by conducting research and analyzing data. It includes various steps such as gathering feedback, coding comments, running queries and reporting.
Cybersecurity Key Performance Indicator And Padlock Icon Clipart Pdf
Showcasing this set of slides titled Cybersecurity Key Performance Indicator And Padlock Icon Clipart Pdf The topics addressed in these templates are Cybersecurity Key, Performance Indicator, Padlock Icon All the content presented in this PPT design is completely editable. Download it and make adjustments in color, background, font etc. as per your unique business setting. Our Cybersecurity Key Performance Indicator And Padlock Icon Clipart Pdf are topically designed to provide an attractive backdrop to any subject. Use them to look like a presentation pro.
Human Resource Analytics Key Performance Indicator Icon Elements Pdf
Showcasing this set of slides titled Human Resource Analytics Key Performance Indicator Icon Elements Pdf The topics addressed in these templates are Human Resource, Analytics Key Performance, Indicator Icon All the content presented in this PPT design is completely editable. Download it and make adjustments in color, background, font etc. as per your unique business setting. Our Human Resource Analytics Key Performance Indicator Icon Elements Pdf are topically designed to provide an attractive backdrop to any subject. Use them to look like a presentation pro.

Key Performance Indicators For Power Strategy Template Pdf
This slide shows key performance indicators for energy plan. The purpose of this slide is to highlight main key performance indicators that should be considered for performance measurement. It include indicators such as facility wide units and process unit levels, etc.Pitch your topic with ease and precision using this Key Performance Indicators For Power Strategy Template Pdf This layout presents information on Electricity Consumption, Process Measuring, Temperature Steam Systems It is also available for immediate download and adjustment. So, changes can be made in the color, design, graphics or any other component to create a unique layout. This slide shows key performance indicators for energy plan. The purpose of this slide is to highlight main key performance indicators that should be considered for performance measurement. It include indicators such as facility wide units and process unit levels, etc.

Company Description Big Data Analytics Investor Funding Elevator Pitch Deck
This slide provides information about the company description that helps to give an introduction to investors. It covers details such as mission, vision, business model, industry, founding year, customer, and introduction of the company. Slidegeeks is one of the best resources for PowerPoint templates. You can download easily and regulate Company Description Big Data Analytics Investor Funding Elevator Pitch Deck for your personal presentations from our wonderful collection. A few clicks is all it takes to discover and get the most relevant and appropriate templates. Use our Templates to add a unique zing and appeal to your presentation and meetings. All the slides are easy to edit and you can use them even for advertisement purposes. This slide provides information about the company description that helps to give an introduction to investors. It covers details such as mission, vision, business model, industry, founding year, customer, and introduction of the company.
Analytics Based Marketing Operation Model Icons Pdf
This slide shows operating model for data driven marketing strategy to gather valuable insights and implement same for increasing profit margins. It include steps such as gathering valuable insights, data management and team establishment etc.Showcasing this set of slides titled Analytics Based Marketing Operation Model Icons Pdf The topics addressed in these templates are Gathering Valuable Insights, Systematic Data Management, Team Establishment All the content presented in this PPT design is completely editable. Download it and make adjustments in color, background, font etc. as per your unique business setting. This slide shows operating model for data driven marketing strategy to gather valuable insights and implement same for increasing profit margins. It include steps such as gathering valuable insights, data management and team establishment etc.
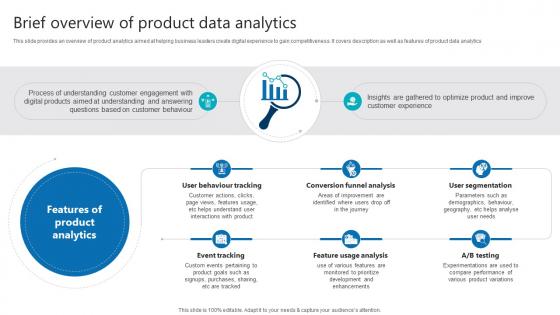
Brief Overview Of Product Data Analytics Product Analytics Implementation Data Analytics V
This slide provides an overview of product analytics aimed at helping business leaders create digital experience to gain competitiveness. It covers description as well as features of product data analytics Get a simple yet stunning designed Brief Overview Of Product Data Analytics Product Analytics Implementation Data Analytics V. It is the best one to establish the tone in your meetings. It is an excellent way to make your presentations highly effective. So, download this PPT today from Slidegeeks and see the positive impacts. Our easy-to-edit Brief Overview Of Product Data Analytics Product Analytics Implementation Data Analytics V can be your go-to option for all upcoming conferences and meetings. So, what are you waiting for Grab this template today. This slide provides an overview of product analytics aimed at helping business leaders create digital experience to gain competitiveness. It covers description as well as features of product data analytics

Best Data Mining Tools TIBCO Using Data Mining Tools To Optimize Processes AI SS V
This slide showcases TIBCO, one of the best data mining tools available in the latter market. It provides details about data sources, data preparation, data exploration, data analytics, shared workspace, drag and drop. Get a simple yet stunning designed Best Data Mining Tools TIBCO Using Data Mining Tools To Optimize Processes AI SS V. It is the best one to establish the tone in your meetings. It is an excellent way to make your presentations highly effective. So, download this PPT today from Slidegeeks and see the positive impacts. Our easy-to-edit Best Data Mining Tools TIBCO Using Data Mining Tools To Optimize Processes AI SS V can be your go-to option for all upcoming conferences and meetings. So, what are you waiting for Grab this template today. This slide showcases TIBCO, one of the best data mining tools available in the latter market. It provides details about data sources, data preparation, data exploration, data analytics, shared workspace, drag and drop.


 Continue with Email

 Home
Home


