Portfolio Dashboard
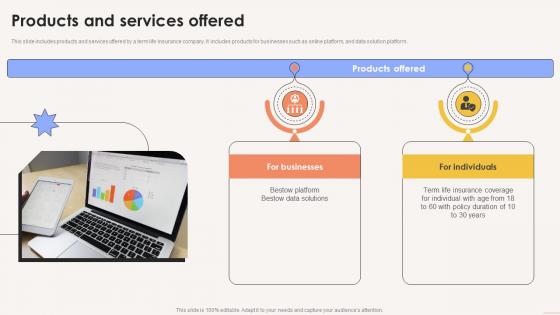
Products And Services Offered Term Life Insurance Platform Investor Funding Elevator Pitch Deck
This slide includes products and services offered by a term life insurance company. It includes products for businesses such as online platform, and data solution platform. Coming up with a presentation necessitates that the majority of the effort goes into the content and the message you intend to convey. The visuals of a PowerPoint presentation can only be effective if it supplements and supports the story that is being told. Keeping this in mind our experts created Products And Services Offered Term Life Insurance Platform Investor Funding Elevator Pitch Deck to reduce the time that goes into designing the presentation. This way, you can concentrate on the message while our designers take care of providing you with the right template for the situation. This slide includes products and services offered by a term life insurance company. It includes products for businesses such as online platform, and data solution platform.
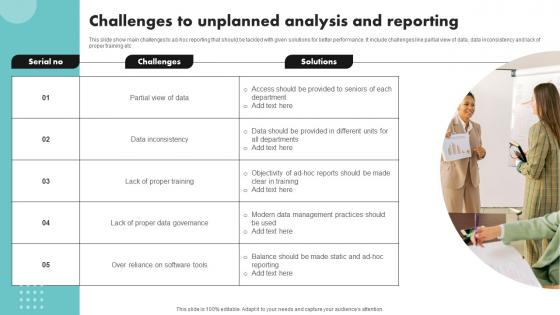
Challenges To Unplanned Analysis And Reporting Pictures Pdf
This slide show main challenges to ad-hoc reporting that should be tackled with given solutions for better performance. It include challenges like partial view of data, data inconsistency and lack of proper training etc Showcasing this set of slides titled Challenges To Unplanned Analysis And Reporting Pictures Pdf The topics addressed in these templates are Partial View Of Data, Data Inconsistency, Lack Of Proper Training All the content presented in this PPT design is completely editable. Download it and make adjustments in color, background, font etc. as per your unique business setting. This slide show main challenges to ad-hoc reporting that should be tackled with given solutions for better performance. It include challenges like partial view of data, data inconsistency and lack of proper training etc
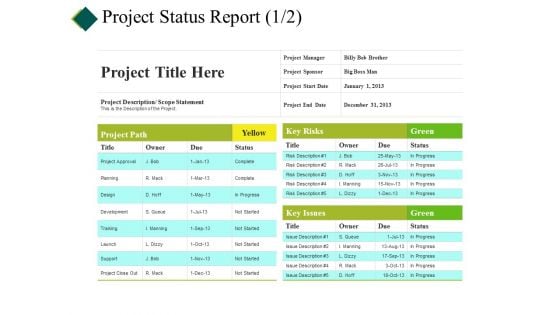
Project Status Report Ppt PowerPoint Presentation Infographics Designs Download
This is a project status report ppt powerpoint presentation infographics designs download. This is a four stage process. The stages in this process are cost, planning, table, project report, data management.
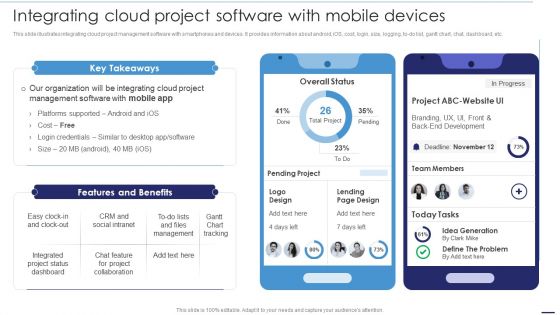
Deploying Cloud Technology Integrating Cloud Project Software With Mobile Devices Ppt Model Infographic Template PDF
This slide illustrates integrating cloud project management software with smartphones and devices. It provides information about android, iOS, cost, login, size, logging, to-do list, gantt chart, chat, dashboard, etc. Crafting an eye-catching presentation has never been more straightforward. Let your presentation shine with this tasteful yet straightforward Deploying Cloud Technology Integrating Cloud Project Software With Mobile Devices Ppt Model Infographic Template PDF template. It offers a minimalistic and classy look that is great for making a statement. The colors have been employed intelligently to add a bit of playfulness while still remaining professional. Construct the ideal Deploying Cloud Technology Integrating Cloud Project Software With Mobile Devices Ppt Model Infographic Template PDF that effortlessly grabs the attention of your audience Begin now and be certain to wow your customers.
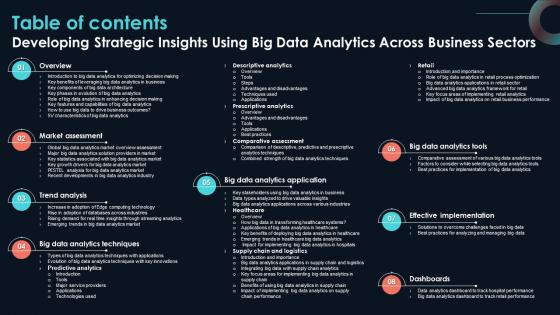
Table Of Contents Developing Strategic Insights Using Big Data Analytics Across Business Sectors
Retrieve professionally designed Table Of Contents Developing Strategic Insights Using Big Data Analytics Across Business Sectors to effectively convey your message and captivate your listeners. Save time by selecting pre-made slideshows that are appropriate for various topics, from business to educational purposes. These themes come in many different styles, from creative to corporate, and all of them are easily adjustable and can be edited quickly. Access them as PowerPoint templates or as Google Slides themes. You do not have to go on a hunt for the perfect presentation because Slidegeeks got you covered from everywhere. Our Table Of Contents Developing Strategic Insights Using Big Data Analytics Across Business Sectors are topically designed to provide an attractive backdrop to any subject. Use them to look like a presentation pro.
Risk Analysis Vector Icon Ppt PowerPoint Presentation Model Portrait
Presenting this set of slides with name risk analysis vector icon ppt powerpoint presentation model portrait. This is a one stage process. The stages in this process are opportunity assessment, market analysis, business opportunities. This is a completely editable PowerPoint presentation and is available for immediate download. Download now and impress your audience.
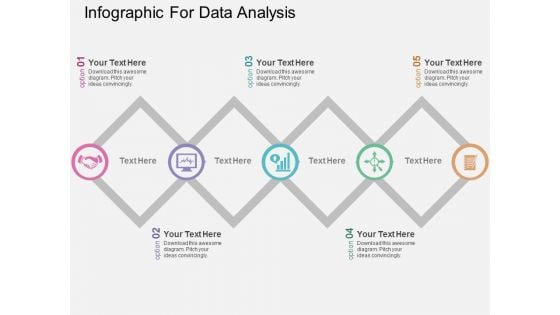
Infographic For Data Analysis Powerpoint Templates
This PowerPoint slide has been designed with process infographic. This PPT diagram may be used to display evaluation of business process. This diagram slide can be used to make impressive presentations.
Quantitative Data Analysis Icon For Predictive Modelling Ppt Ideas Images PDF
Presenting Quantitative Data Analysis Icon For Predictive Modelling Ppt Ideas Images PDF to dispense important information. This template comprises one stages. It also presents valuable insights into the topics including Quantitative Data, Analysis Icon, Predictive Modelling. This is a completely customizable PowerPoint theme that can be put to use immediately. So, download it and address the topic impactfully.
Website Content Performance Analysis Review Icon Designs PDF
Persuade your audience using this Website Content Performance Analysis Review Icon Designs PDF. This PPT design covers four stages, thus making it a great tool to use. It also caters to a variety of topics including Website Content Performance, Analysis Review Icon. Download this PPT design now to present a convincing pitch that not only emphasizes the topic but also showcases your presentation skills.

Project Conclusion Report Open Issues Ppt PowerPoint Presentation Background Designs
This is a project conclusion report open issues ppt powerpoint presentation background designs. This is a three stage process. The stages in this process are project name, table, cost, data, management.
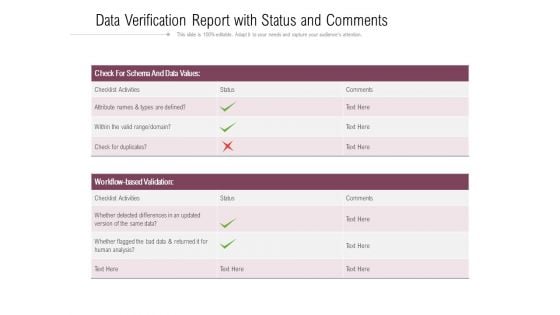
Data Verification Report With Status And Comments Ppt PowerPoint Presentation Gallery Designs Download PDF
Pitch your topic with ease and precision using this data verification report with status and comments ppt powerpoint presentation gallery designs download pdf. This layout presents information on data values, validation, analysis. It is also available for immediate download and adjustment. So, changes can be made in the color, design, graphics or any other component to create a unique layout.
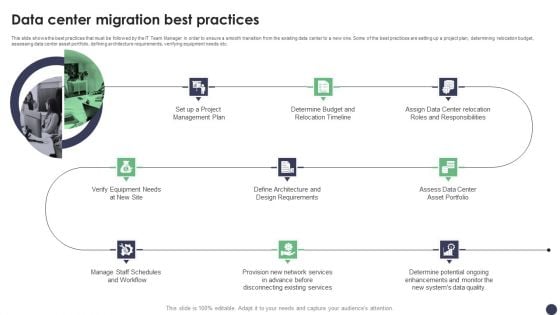
Data Center Migration Best Practices Ppt PowerPoint Presentation File Example File PDF
This slide shows the best practices that must be followed by the IT Team Manager in order to ensure a smooth transition from the existing data center to a new one. Some of the best practices are setting up a project plan, determining relocation budget, assessing data center asset portfolio, defining architecture requirements, verifying equipment needs etc. Present like a pro with Data Center Migration Best Practices Ppt PowerPoint Presentation File Example File PDF Create beautiful presentations together with your team, using our easy to use presentation slides. Share your ideas in real time and make changes on the fly by downloading our templates. So whether you are in the office, on the go, or in a remote location, you can stay in sync with your team and present your ideas with confidence. With Slidegeeks presentation got a whole lot easier. Grab these presentations today.
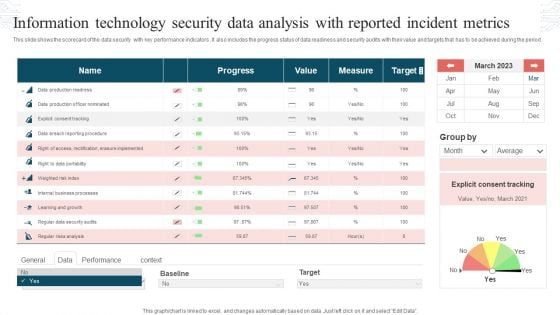
Information Technology Security Data Analysis With Reported Incident Metrics Rules PDF
This slide shows the scorecard of the data security with key performance indicators. It also includes the progress status of data readiness and security audits with their value and targets that has to be achieved during the period. Pitch your topic with ease and precision using this Information Technology Security Data Analysis With Reported Incident Metrics Rules PDF. This layout presents information on Progress, Value, Measure, Target. It is also available for immediate download and adjustment. So, changes can be made in the color, design, graphics or any other component to create a unique layout.
Data Analysis With Bar Chart In Magnifying Glass Vector Icon Ppt PowerPoint Presentation File Model PDF
Presenting this set of slides with name data analysis with bar chart in magnifying glass vector icon ppt powerpoint presentation file model pdf. This is a one stage process. The stages in this process is data analysis with bar chart in magnifying glass vector icon. This is a completely editable PowerPoint presentation and is available for immediate download. Download now and impress your audience.

Lead Metrics For Software Performance Testing Ppt Show Visual Aids Pdf
This slide highlights various key performance indicators to track and calculate product success in market. It includes key metrics such as net promoter score, client retention rate, active user percentage, customer lifetime value and churn rate. Showcasing this set of slides titled Lead Metrics For Software Performance Testing Ppt Show Visual Aids Pdf. The topics addressed in these templates are Client Retention Rate, Active User Percentage, Customer Lifetime. All the content presented in this PPT design is completely editable. Download it and make adjustments in color, background, font etc. as per your unique business setting. This slide highlights various key performance indicators to track and calculate product success in market. It includes key metrics such as net promoter score, client retention rate, active user percentage, customer lifetime value and churn rate.
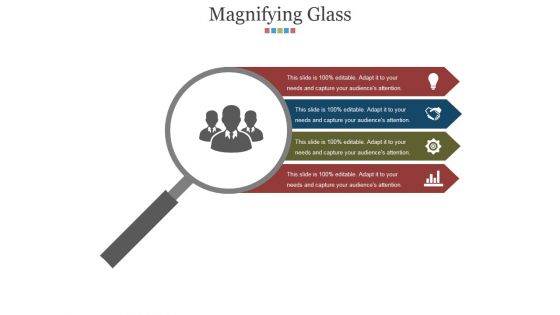
Magnifying Glass Ppt PowerPoint Presentation Model Designs Download
This is a magnifying glass ppt powerpoint presentation model designs download. This is a four stage process. The stages in this process are business, icons, magnifier glass, search, marketing.
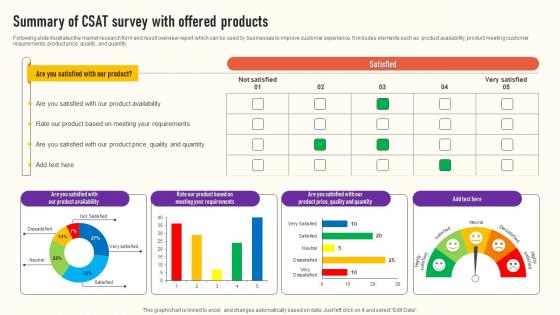
Summary Of CSAT Survey With Offered Products Survey Ss
Following slide illustrates the market research form and result overview report which can be used by businesses to improve customer experience. It includes elements such as product availability, product meeting customer requirements, product price, quality, and quantity Showcasing this set of slides titled Summary Of CSAT Survey With Offered Products Survey Ss The topics addressed in these templates are Product Availability, Satisfied, Quality And Quantity All the content presented in this PPT design is completely editable. Download it and make adjustments in color, background, font etc. as per your unique business setting. Following slide illustrates the market research form and result overview report which can be used by businesses to improve customer experience. It includes elements such as product availability, product meeting customer requirements, product price, quality, and quantity
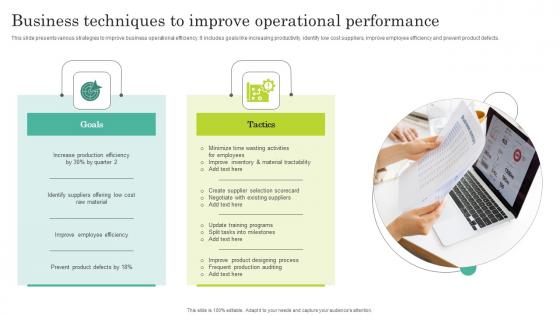
Business Techniques To Improve Operational Performance Infographics Pdf
This slide presents various strategies to improve business operational efficiency. It includes goals like increasing productivity, identify low cost suppliers, improve employee efficiency and prevent product defects. Pitch your topic with ease and precision using this Business Techniques To Improve Operational Performance Infographics Pdf. This layout presents information on Goals, Tactics, Minimize Time Wasting Activities. It is also available for immediate download and adjustment. So, changes can be made in the color, design, graphics or any other component to create a unique layout. This slide presents various strategies to improve business operational efficiency. It includes goals like increasing productivity, identify low cost suppliers, improve employee efficiency and prevent product defects.
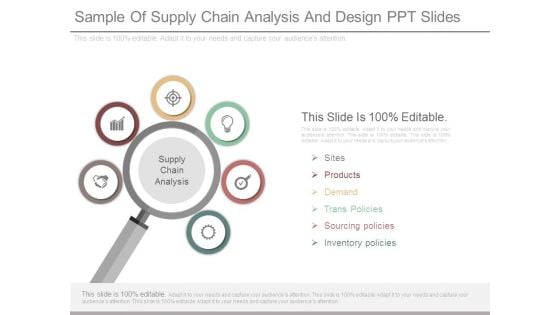
Sample Of Supply Chain Analysis And Design Ppt Slides
This is a sample of supply chain analysis and design ppt slides. This is a six stage process. The stages in this process are supply chain analysis, sites, products, demand, trans policies, sourcing policies, inventory policies.
Target Market Assessment Analysis Icon Mockup PDF
Persuade your audience using this Target Market Assessment Analysis Icon Mockup PDF. This PPT design covers four stages, thus making it a great tool to use. It also caters to a variety of topics including Target Market Assessment, Analysis Icon. Download this PPT design now to present a convincing pitch that not only emphasizes the topic but also showcases your presentation skills.
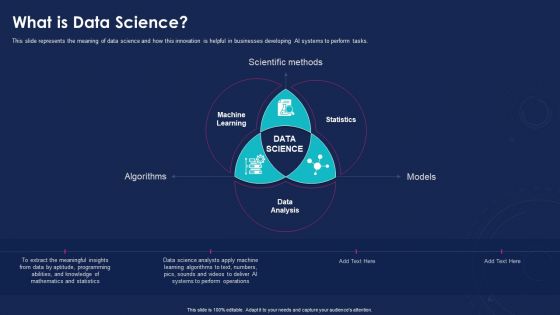
Data Analytics IT What Is Data Science Ppt Infographics Design Templates PDF
This slide represents the meaning of data science and how this innovation is helpful in businesses developing AI systems to perform tasks. This is a data analytics it what is data science ppt infographics design templates pdf template with various stages. Focus and dispense information on three stages using this creative set, that comes with editable features. It contains large content boxes to add your information on topics like algorithms, models, scientific methods. You can also showcase facts, figures, and other relevant content using this PPT layout. Grab it now.
Magnifying Glass Big Data Analysis Ppt PowerPoint Presentation Layouts Designs Download
Presenting this set of slides with name magnifying glass big data analysis ppt powerpoint presentation layouts designs download. This is a four stage process. The stages in this process are magnifying glass, research, marketing, strategy, business. This is a completely editable PowerPoint presentation and is available for immediate download. Download now and impress your audience.
Business Data Insights Report Icon Download PDF
Showcasing this set of slides titled Business Data Insights Report Icon Download PDF. The topics addressed in these templates are Business, Data Insights, Report. All the content presented in this PPT design is completely editable. Download it and make adjustments in color, background, font etc. as per your unique business setting.
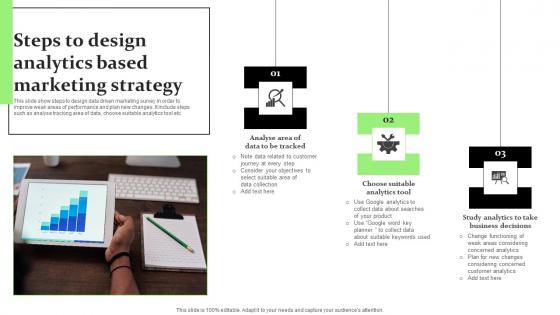
Steps To Design Analytics Based Marketing Strategy Diagrams Pdf
This slide show steps to design data driven marketing survey in order to improve weak areas of performance and plan new changes. It include steps such as analyse tracking area of data, choose suitable analytics tool etc.Pitch your topic with ease and precision using this Steps To Design Analytics Based Marketing Strategy Diagrams Pdf This layout presents information on Data Tracked, Analytics Tool, Business Decisions It is also available for immediate download and adjustment. So, changes can be made in the color, design, graphics or any other component to create a unique layout. This slide show steps to design data driven marketing survey in order to improve weak areas of performance and plan new changes. It include steps such as analyse tracking area of data, choose suitable analytics tool etc.
Icon For Financial Analytics With Splunk Big Data Designs Pdf
Showcasing this set of slides titled Icon For Financial Analytics With Splunk Big Data Designs Pdf The topics addressed in these templates are Icon For Financial, Analytics With Splunk, Big Data All the content presented in this PPT design is completely editable. Download it and make adjustments in color, background, font etc. as per your unique business setting. Our Icon For Financial Analytics With Splunk Big Data Designs Pdf are topically designed to provide an attractive backdrop to any subject. Use them to look like a presentation pro.

Kpis To Evaluate Performance Of Commercial Banks Complete Guide On Managing Banking Fin SS V
This slide shows information regarding various key performance indicators or metrics which can be used to measure or analyse the performance of commercial banks. It includes ROA, ROE, NIM, NPL, etc. Take your projects to the next level with our ultimate collection of Kpis To Evaluate Performance Of Commercial Banks Complete Guide On Managing Banking Fin SS V. Slidegeeks has designed a range of layouts that are perfect for representing task or activity duration, keeping track of all your deadlines at a glance. Tailor these designs to your exact needs and give them a truly corporate look with your own brand colors they will make your projects stand out from the rest This slide shows information regarding various key performance indicators or metrics which can be used to measure or analyse the performance of commercial banks. It includes ROA, ROE, NIM, NPL, etc.
Kpis To Monitor Quarterly Marketing Performance Strategic Marketing Campaign Themes Pdf
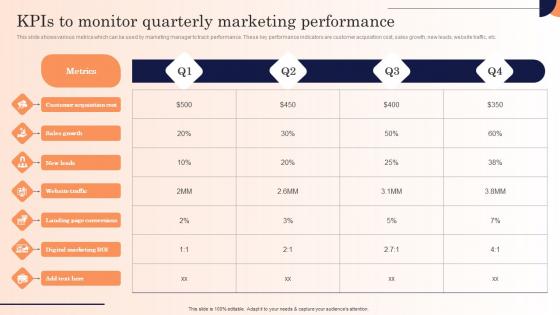
This slide shows various metrics which can be used by marketing manager to track performance. These key performance indicators are customer acquisition cost, sales growth, new leads, website traffic, etc.Explore a selection of the finest Kpis To Monitor Quarterly Marketing Performance Strategic Marketing Campaign Themes Pdf here. With a plethora of professionally designed and pre-made slide templates, you can quickly and easily find the right one for your upcoming presentation. You can use our Kpis To Monitor Quarterly Marketing Performance Strategic Marketing Campaign Themes Pdf to effectively convey your message to a wider audience. Slidegeeks has done a lot of research before preparing these presentation templates. The content can be personalized and the slides are highly editable. Grab templates today from Slidegeeks. This slide shows various metrics which can be used by marketing manager to track performance. These key performance indicators are customer acquisition cost, sales growth, new leads, website traffic, etc.
Real Estate Market Snapshot Ppt PowerPoint Presentation Model
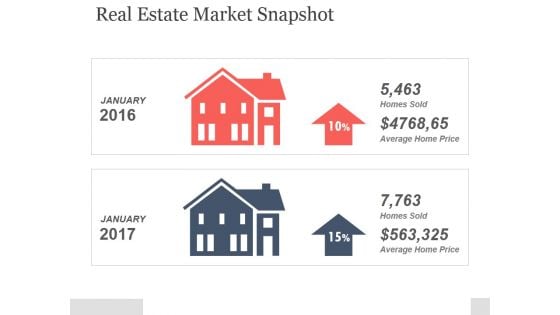
This is a real estate market snapshot ppt powerpoint presentation model. This is a two stage process. The stages in this process are real estate, market snapshot, business, marketing, success.
Products And Services Offered Digital Pharmacy Company Investor Funding Ppt Slide
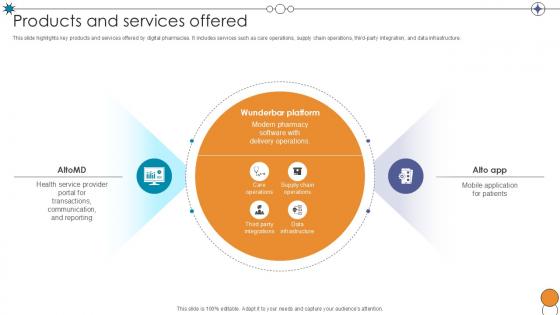
This slide highlights key products and services offered by digital pharmacies. It includes services such as care operations, supply chain operations, third-party integration, and data infrastructure. Slidegeeks has constructed Products And Services Offered Digital Pharmacy Company Investor Funding Ppt Slide after conducting extensive research and examination. These presentation templates are constantly being generated and modified based on user preferences and critiques from editors. Here, you will find the most attractive templates for a range of purposes while taking into account ratings and remarks from users regarding the content. This is an excellent jumping-off point to explore our content and will give new users an insight into our top-notch PowerPoint Templates. This slide highlights key products and services offered by digital pharmacies. It includes services such as care operations, supply chain operations, third-party integration, and data infrastructure.
KPIs To Monitor Quarterly Marketing Performance Digital Advertising Strategies Mockup Pdf
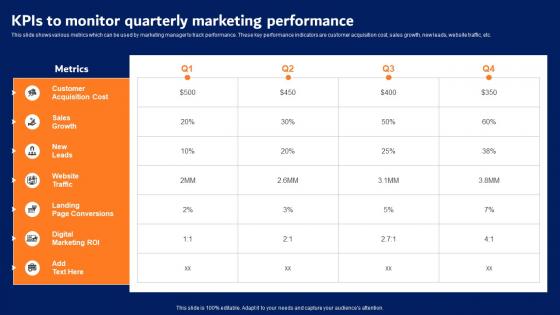
This slide shows various metrics which can be used by marketing manager to track performance. These key performance indicators are customer acquisition cost, sales growth, new leads, website traffic, etc. Find a pre designed and impeccable KPIs To Monitor Quarterly Marketing Performance Digital Advertising Strategies Mockup Pdf. The templates can ace your presentation without additional effort. You can download these easy to edit presentation templates to make your presentation stand out from others. So, what are you waiting for Download the template from Slidegeeks today and give a unique touch to your presentation. This slide shows various metrics which can be used by marketing manager to track performance. These key performance indicators are customer acquisition cost, sales growth, new leads, website traffic, etc.
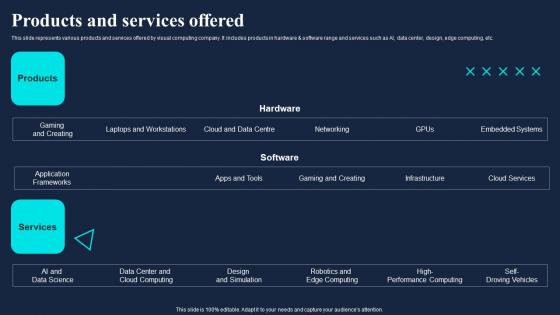
Products And Services Offered Gaming Company Fund Raising Pitch Deck Guidelines Pdf
This slide represents various products and services offered by visual computing company. It includes products in hardware and software range and services such as AI, data center, design, edge computing, etc. Formulating a presentation can take up a lot of effort and time, so the content and message should always be the primary focus. The visuals of the PowerPoint can enhance the presenters message, so our Products And Services Offered Gaming Company Fund Raising Pitch Deck Guidelines Pdf was created to help save time. Instead of worrying about the design, the presenter can concentrate on the message while our designers work on creating the ideal templates for whatever situation is needed. Slidegeeks has experts for everything from amazing designs to valuable content, we have put everything into Products And Services Offered Gaming Company Fund Raising Pitch Deck Guidelines Pdf This slide represents various products and services offered by visual computing company. It includes products in hardware and software range and services such as AI, data center, design, edge computing, etc.
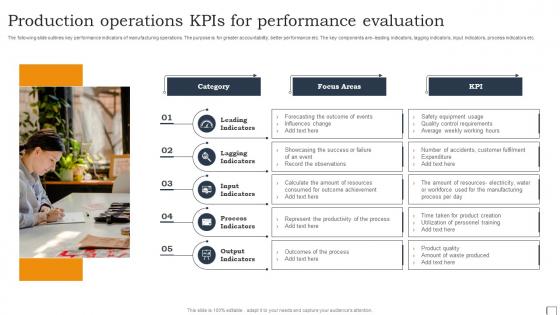
Production Operations KPIs For Performance Evaluation Structure Pdf
The following slide outlines key performance indicators of manufacturing operations. The purpose is for greater accountability, better performance etc. The key components are- leading indicators, lagging indicators, input indicators, process indicators etc. Pitch your topic with ease and precision using this Production Operations KPIs For Performance Evaluation Structure Pdf. This layout presents information on Leading Indicators, Lagging Indicators, Input Indicators. It is also available for immediate download and adjustment. So, changes can be made in the color, design, graphics or any other component to create a unique layout. The following slide outlines key performance indicators of manufacturing operations. The purpose is for greater accountability, better performance etc. The key components are- leading indicators, lagging indicators, input indicators, process indicators etc.
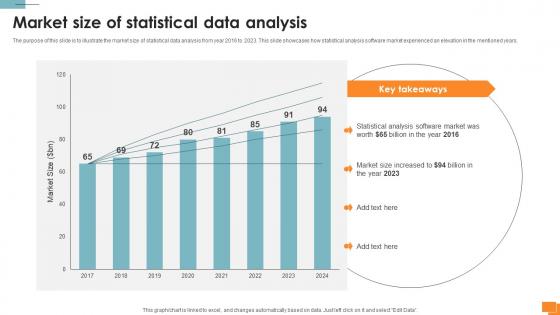
Statistical Tools For Evidence Market Size Of Statistical Data Analysis
The purpose of this slide is to illustrate the market size of statistical data analysis from year 2016 to 2023. This slide showcases how statistical analysis software market experienced an elevation in the mentioned years. Retrieve professionally designed Statistical Tools For Evidence Market Size Of Statistical Data Analysis to effectively convey your message and captivate your listeners. Save time by selecting pre-made slideshows that are appropriate for various topics, from business to educational purposes. These themes come in many different styles, from creative to corporate, and all of them are easily adjustable and can be edited quickly. Access them as PowerPoint templates or as Google Slides themes. You do not have to go on a hunt for the perfect presentation because Slidegeeks got you covered from everywhere. The purpose of this slide is to illustrate the market size of statistical data analysis from year 2016 to 2023. This slide showcases how statistical analysis software market experienced an elevation in the mentioned years.
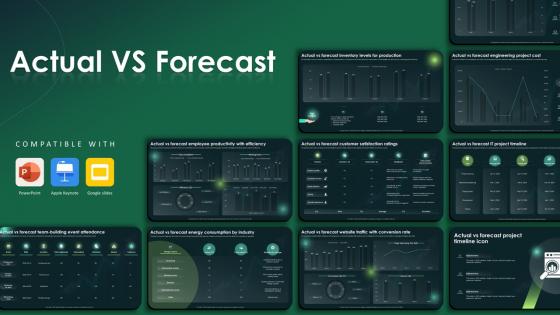
Actual Vs Forecast Powerpoint Ppt Template Bundles
This Actual Vs Forecast Powerpoint Ppt Template Bundles is designed to help you retain your audiences attention. This content-ready PowerPoint Template enables you to take your audience on a journey and share information in a way that is easier to recall. It helps you highlight the crucial parts of your work so that the audience does not get saddled with information download. This KPI Dashboard, Data Driven Marketing, Campaign Performance, Marketing Evaluation, Inventory Assessment-slide PPT Deck comes prepared with the graphs and charts you could need to showcase your information through visuals. You only need to enter your own data in them. Download this editable PowerPoint Theme and walk into that meeting with confidence. Our Actual vs. Forecast PowerPoint presentation can provide you with valuable business insights. Analyze sales figures, budgets, and financial predictions. Identify major differences, modify methods, and match projections with results to improve decision-making. Download now to accelerate your success.
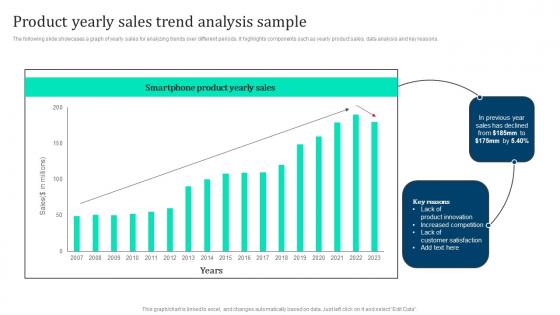
Product Yearly Sales Trend Analysis Marketing Intelligence Guide Data Gathering Introduction Pdf
The following slide showcases a graph of yearly sales for analyzing trends over different periods. It highlights components such as yearly product sales, data analysis and key reasons. Create an editable Product Yearly Sales Trend Analysis Marketing Intelligence Guide Data Gathering Introduction Pdf that communicates your idea and engages your audience. Whether you are presenting a business or an educational presentation, pre designed presentation templates help save time. Product Yearly Sales Trend Analysis Marketing Intelligence Guide Data Gathering Introduction Pdf is highly customizable and very easy to edit, covering many different styles from creative to business presentations. Slidegeeks has creative team members who have crafted amazing templates. So, go and get them without any delay. The following slide showcases a graph of yearly sales for analyzing trends over different periods. It highlights components such as yearly product sales, data analysis and key reasons.
Icon For Big Data Analytics In Digital Marketing Introduction Pdf
Pitch your topic with ease and precision using this Icon For Big Data Analytics In Digital Marketing Introduction Pdf. This layout presents information on Big Data, Analytics, Digital Marketing. It is also available for immediate download and adjustment. So, changes can be made in the color, design, graphics or any other component to create a unique layout. Our Icon For Big Data Analytics In Digital Marketing Introduction Pdf are topically designed to provide an attractive backdrop to any subject. Use them to look like a presentation pro.
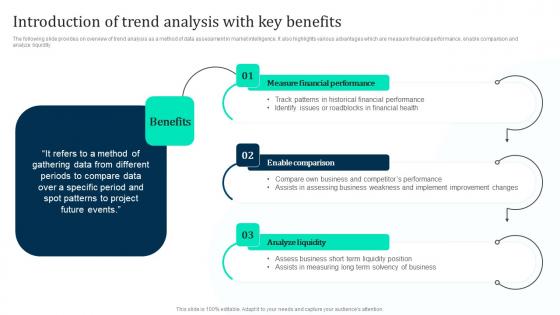
Introduction Of Trend Analysis Key Marketing Intelligence Guide Data Gathering Structure Pdf
The following slide provides on overview of trend analysis as a method of data assessment in market intelligence. It also highlights various advantages which are measure financial performance, enable comparison and analyze liquidity. Formulating a presentation can take up a lot of effort and time, so the content and message should always be the primary focus. The visuals of the PowerPoint can enhance the presenters message, so our Introduction Of Trend Analysis Key Marketing Intelligence Guide Data Gathering Structure Pdf was created to help save time. Instead of worrying about the design, the presenter can concentrate on the message while our designers work on creating the ideal templates for whatever situation is needed. Slidegeeks has experts for everything from amazing designs to valuable content, we have put everything into Introduction Of Trend Analysis Key Marketing Intelligence Guide Data Gathering Structure Pdf The following slide provides on overview of trend analysis as a method of data assessment in market intelligence. It also highlights various advantages which are measure financial performance, enable comparison and analyze liquidity.
Business Organizational Chart Template 3d Man And Red Folder PowerPoint Templates
We present our business organizational chart template 3d man and red folder PowerPoint templates.Use our Computer PowerPoint Templates because Our PowerPoint Templates and Slides are specially created by a professional team with vast experience. They diligently strive to come up with the right vehicle for your brilliant Ideas. Download and present our Business PowerPoint Templates because It will get your audience in sync. Use our Symbol PowerPoint Templates because You have gained great respect for your brilliant ideas. Use our PowerPoint Templates and Slides to strengthen and enhance your reputation. Use our Technology PowerPoint Templates because You aspire to touch the sky with glory. Let our PowerPoint Templates and Slides provide the fuel for your ascent. Present our Shapes PowerPoint Templates because our PowerPoint Templates and Slides are the string of your bow. Fire of your ideas and conquer the podium.Use these PowerPoint slides for presentations relating to 3d, Archive, Background, Binder, Bureaucracy, Business, Cartoon, Computer, Concept, Data, Document, File, Folder, Group, Heavy, Human, Icon, Idea, Illustration, Image, Information, Internet, Isolated, Manager, Men, Occupation, Office, Order, Organization, Paper, Paperwork, People, Person, Portfolio, Red, Render, Shape, Storage, Success, Support, Symbol, Technology, Three-Dimensional. The prominent colors used in the PowerPoint template are Red, Gray, White. We assure you our business organizational chart template 3d man and red folder PowerPoint templates will make you look like a winner. Use our Cartoon PowerPoint templates and PPT Slides will make the presenter successul in his career/life. We assure you our business organizational chart template 3d man and red folder PowerPoint templates are designed by a team of presentation professionals. Professionals tell us our Bureaucracy PowerPoint templates and PPT Slides are specially created by a professional team with vast experience. They diligently strive to come up with the right vehicle for your brilliant Ideas. The feedback we get is that our business organizational chart template 3d man and red folder PowerPoint templates will make you look like a winner. You can be sure our Bureaucracy PowerPoint templates and PPT Slides effectively help you save your valuable time. Our Business Organizational Chart Template 3d Man And Red Folder PowerPoint Templates are geared for excellence. They will have your thoughts accelerating away.
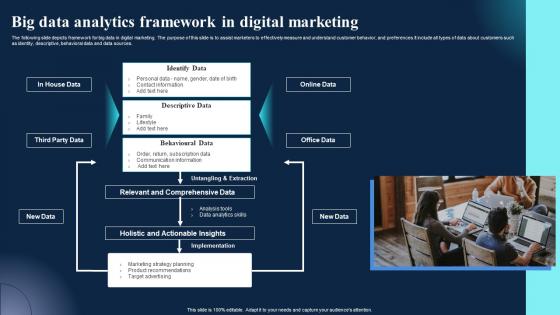
Big Data Analytics Framework In Digital Marketing Clipart Pdf
The following slide depicts framework for big data in digital marketing. The purpose of this slide is to assist marketers to effectively measure and understand customer behavior, and preferences.It include all types of data about customers such as identity, descriptive, behavioral data and data sources. Showcasing this set of slides titled Big Data Analytics Framework In Digital Marketing Clipart Pdf. The topics addressed in these templates are Online Data, Office Data, New Data. All the content presented in this PPT design is completely editable. Download it and make adjustments in color, background, font etc. as per your unique business setting. The following slide depicts framework for big data in digital marketing. The purpose of this slide is to assist marketers to effectively measure and understand customer behavior, and preferences.It include all types of data about customers such as identity, descriptive, behavioral data and data sources.
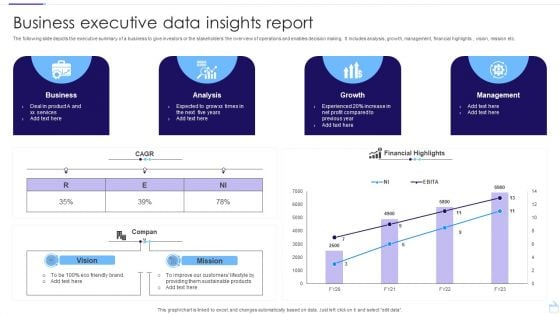
Business Executive Data Insights Report Pictures PDF
The following slide depicts the executive summary of a business to give investors or the stakeholders the overview of operations and enables decision making. It includes analysis, growth, management, financial highlights , vision, mission etc. Pitch your topic with ease and precision using this Business Executive Data Insights Report Pictures PDF. This layout presents information on Business, Analysis, Growth. It is also available for immediate download and adjustment. So, changes can be made in the color, design, graphics or any other component to create a unique layout.
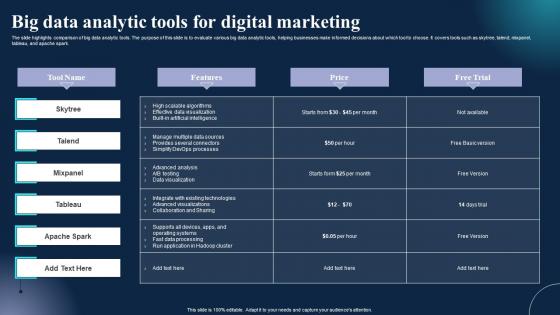
Big Data Analytic Tools For Digital Marketing Information Pdf
The slide highlights comparison of big data analytic tools. The purpose of this slide is to evaluate various big data analytic tools, helping businesses make informed decisions about which tool to choose. It covers tools such as skytree, talend, mixpanel, tableau, and apache spark. Pitch your topic with ease and precision using this Big Data Analytic Tools For Digital Marketing Information Pdf. This layout presents information on Tool Name, Features, Price. It is also available for immediate download and adjustment. So, changes can be made in the color, design, graphics or any other component to create a unique layout. The slide highlights comparison of big data analytic tools. The purpose of this slide is to evaluate various big data analytic tools, helping businesses make informed decisions about which tool to choose. It covers tools such as skytree, talend, mixpanel, tableau, and apache spark.
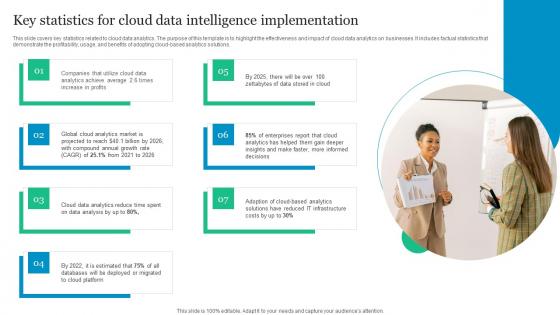
Key Statistics For Cloud Data Intelligence Implementation Download Pdf
This slide covers key statistics related to cloud data analytics. The purpose of this template is to highlight the effectiveness and impact of cloud data analytics on businesses. It includes factual statistics that demonstrate the profitability, usage, and benefits of adopting cloud based analytics solutions. Showcasing this set of slides titled Key Statistics For Cloud Data Intelligence Implementation Download Pdf. The topics addressed in these templates are Analytics Achieve Average, Growth Rate, Global Cloud Analytics. All the content presented in this PPT design is completely editable. Download it and make adjustments in color, background, font etc. as per your unique business setting. This slide covers key statistics related to cloud data analytics. The purpose of this template is to highlight the effectiveness and impact of cloud data analytics on businesses. It includes factual statistics that demonstrate the profitability, usage, and benefits of adopting cloud based analytics solutions.
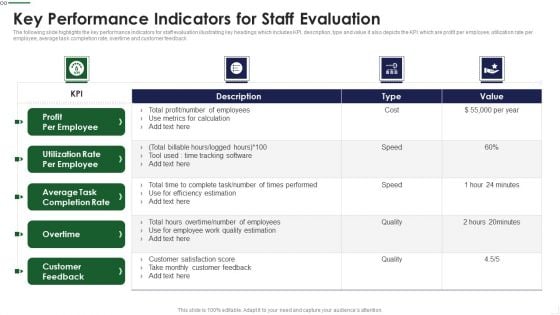
Key Performance Indicators For Staff Evaluation Infographics PDF
The following slide highlights the key performance Indicators for staff evaluation illustrating key headings which includes KPI, description, type and value it also depicts the KPI which are profit per employee, utilization rate per employee, average task completion rate, overtime and customer feedback Showcasing this set of slides titled Key Performance Indicators For Staff Evaluation Infographics PDF The topics addressed in these templates are Metrics Calculation, Times Performed, Customer Satisfaction All the content presented in this PPT design is completely editable. Download it and make adjustments in color, background, font etc. as per your unique business setting.
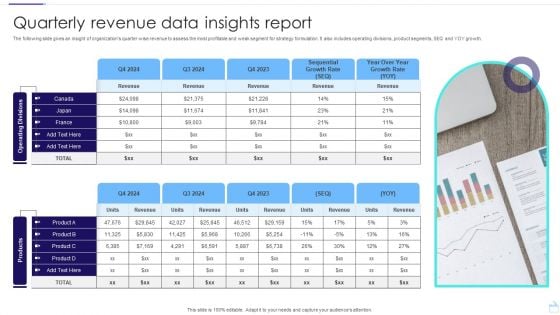
Quarterly Revenue Data Insights Report Template PDF
The following slide gives an insight of organizations quarter wise revenue to assess the most profitable and weak segment for strategy formulation. It also includes operating divisions, product segments, SEQ and YOY growth. Showcasing this set of slides titled Quarterly Revenue Data Insights Report Template PDF. The topics addressed in these templates are Operating, Divisions products, Insights Report. All the content presented in this PPT design is completely editable. Download it and make adjustments in color, background, font etc. as per your unique business setting.
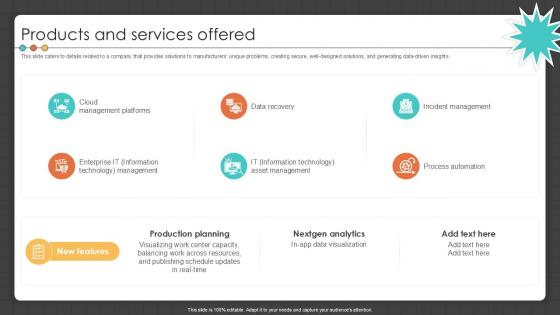
Products And Services Offered Manufacturing Control Software Company Investor PPT Template
This slide caters to details related to a company that provides solutions to manufacturers unique problems, creating secure, well-designed solutions, and generating data-driven insights. Coming up with a presentation necessitates that the majority of the effort goes into the content and the message you intend to convey. The visuals of a PowerPoint presentation can only be effective if it supplements and supports the story that is being told. Keeping this in mind our experts created Products And Services Offered Manufacturing Control Software Company Investor PPT Template to reduce the time that goes into designing the presentation. This way, you can concentrate on the message while our designers take care of providing you with the right template for the situation. This slide caters to details related to a company that provides solutions to manufacturers unique problems, creating secure, well-designed solutions, and generating data-driven insights.
Variance Analysis Techniques And Models Efficient Operations Cycle Icon Introduction PDF
Persuade your audience using this variance analysis techniques and models efficient operations cycle icon introduction pdf. This PPT design covers four stages, thus making it a great tool to use. It also caters to a variety of topics including variance analysis techniques and models efficient operations cycle icon. Download this PPT design now to present a convincing pitch that not only emphasizes the topic but also showcases your presentation skills.
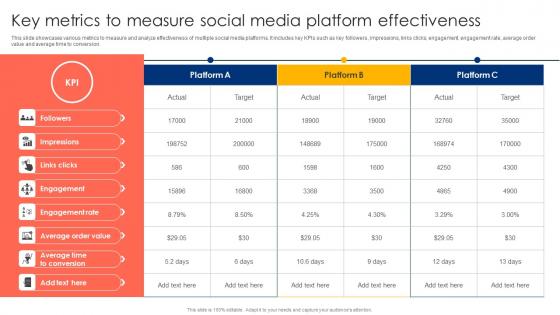
Key Metrics To Measure Social Media Platform Effectiveness Ppt Layouts Background Designs Pdf
This slide showcases various metrics to measure and analyze effectiveness of multiple social media platforms. It includes key KPIs such as key followers, impressions, links clicks, engagement, engagement rate, average order value and average time to conversion. Showcasing this set of slides titled Key Metrics To Measure Social Media Platform Effectiveness Ppt Layouts Background Designs Pdf. The topics addressed in these templates are Engagement, Engagement Rate, Average Order. All the content presented in this PPT design is completely editable. Download it and make adjustments in color, background, font etc. as per your unique business setting. This slide showcases various metrics to measure and analyze effectiveness of multiple social media platforms. It includes key KPIs such as key followers, impressions, links clicks, engagement, engagement rate, average order value and average time to conversion.
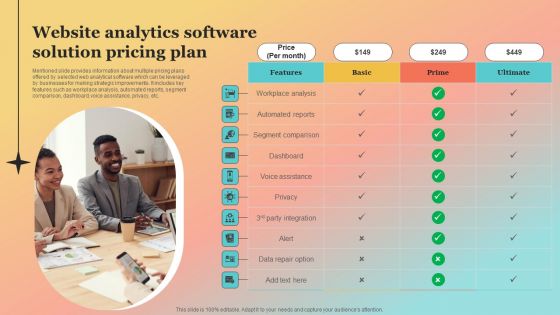
New Website Launch Strategy Website Analytics Software Solution Pricing Plan Microsoft PDF
Mentioned slide provides information about multiple pricing plans offered by selected web analytical software which can be leveraged by businesses for making strategic improvements. It includes key features such as workplace analysis, automated reports, segment comparison, dashboard, voice assistance, privacy, etc. The New Website Launch Strategy Website Analytics Software Solution Pricing Plan Microsoft PDF is a compilation of the most recent design trends as a series of slides. It is suitable for any subject or industry presentation, containing attractive visuals and photo spots for businesses to clearly express their messages. This template contains a variety of slides for the user to input data, such as structures to contrast two elements, bullet points, and slides for written information. Slidegeeks is prepared to create an impression.
Icon For Big Data Analytics In Marketing Ppt Slides Files PDF
Showcasing this set of slides titled Icon For Big Data Analytics In Marketing Ppt Slides Files PDF. The topics addressed in these templates are Icon, Big Data Analytics, Marketing. All the content presented in this PPT design is completely editable. Download it and make adjustments in color, background, font etc. as per your unique business setting. Our Icon For Big Data Analytics In Marketing Ppt Slides Files PDF are topically designed to provide an attractive backdrop to any subject. Use them to look like a presentation pro.
Business Analysis Data Monitoring Vector Icon Ppt Powerpoint Presentation Ideas Design Ideas
This is a business analysis data monitoring vector icon ppt powerpoint presentation ideas design ideas. This is a one stage process. The stages in this process are feedback loop icon, evaluation icon, assessment icon.
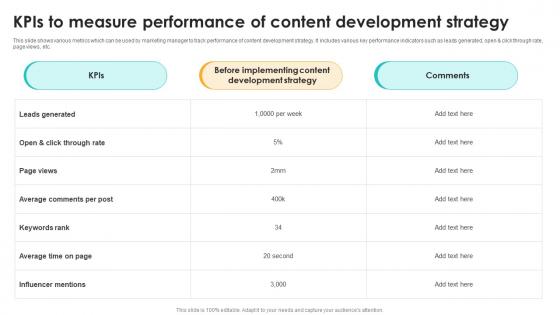
Kpis To Measure Performance Of Content Development Strategy Seo Content Plan To Drive Strategy SS V
This slide shows various metrics which can be used by marketing manager to track performance of content development strategy. It includes various key performance indicators such as leads generated, open and click through rate, page views, etc. Explore a selection of the finest Kpis To Measure Performance Of Content Development Strategy Seo Content Plan To Drive Strategy SS V here. With a plethora of professionally designed and pre-made slide templates, you can quickly and easily find the right one for your upcoming presentation. You can use our Kpis To Measure Performance Of Content Development Strategy Seo Content Plan To Drive Strategy SS V to effectively convey your message to a wider audience. Slidegeeks has done a lot of research before preparing these presentation templates. The content can be personalized and the slides are highly editable. Grab templates today from Slidegeeks. This slide shows various metrics which can be used by marketing manager to track performance of content development strategy. It includes various key performance indicators such as leads generated, open and click through rate, page views, etc.
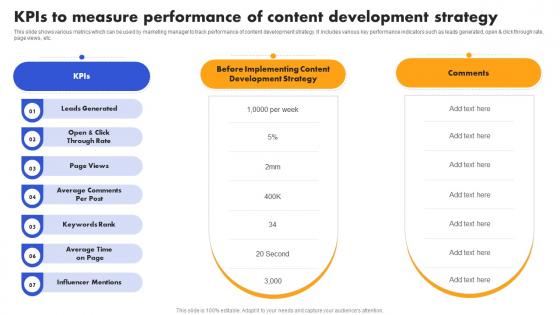
SEO Strategy To Improve ROI Kpis To Measure Performance Of Content Strategy SS V
This slide shows various metrics which can be used by marketing manager to track performance of content development strategy. It includes various key performance indicators such as leads generated, open and click through rate, page views, etc. Explore a selection of the finest SEO Strategy To Improve ROI Kpis To Measure Performance Of Content Strategy SS V here. With a plethora of professionally designed and pre-made slide templates, you can quickly and easily find the right one for your upcoming presentation. You can use our SEO Strategy To Improve ROI Kpis To Measure Performance Of Content Strategy SS V to effectively convey your message to a wider audience. Slidegeeks has done a lot of research before preparing these presentation templates. The content can be personalized and the slides are highly editable. Grab templates today from Slidegeeks. This slide shows various metrics which can be used by marketing manager to track performance of content development strategy. It includes various key performance indicators such as leads generated, open and click through rate, page views, etc.
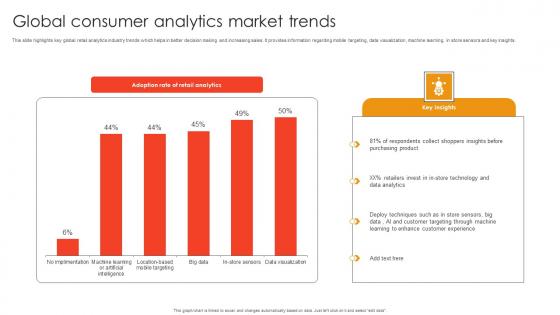
Global Consumer Analytics Market Trends Template Pdf
This slide highlights key global retail analytics industry trends which helps in better decision making and increasing sales. It provides information regarding mobile targeting, data visualization, machine learning, in store sensors and key insights. Pitch your topic with ease and precision using this Global Consumer Analytics Market Trends Template Pdf. This layout presents information on Respondents Collect Shoppers, Retailers Invest Store, Deploy Techniques Store Sensors. It is also available for immediate download and adjustment. So, changes can be made in the color, design, graphics or any other component to create a unique layout. This slide highlights key global retail analytics industry trends which helps in better decision making and increasing sales. It provides information regarding mobile targeting, data visualization, machine learning, in store sensors and key insights.
Marketing Survey Analysis For Understanding Target Market Inspiration PDF
Persuade your audience using this Marketing Survey Analysis For Understanding Target Market Inspiration PDF. This PPT design covers three stages, thus making it a great tool to use. It also caters to a variety of topics including Marketing Survey Analysis, Understanding Target Market. Download this PPT design now to present a convincing pitch that not only emphasizes the topic but also showcases your presentation skills.
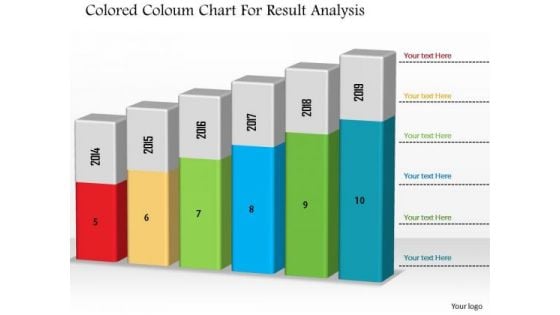
Business Diagram Colored Column Chart For Result Analysis PowerPoint Slide
This Power Point diagram has been designed with graphic of column chart. It contains diagram of bar char depicting annual business progress report. Use this diagram to build professional presentations for your viewers.
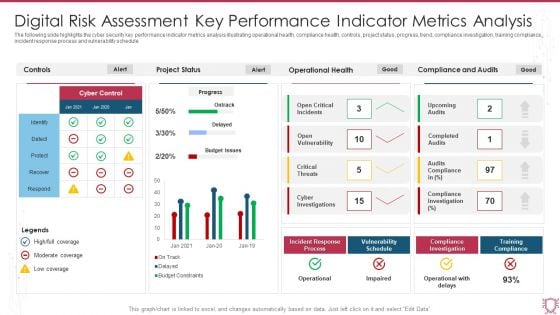
Digital Risk Assessment Key Performance Indicator Metrics Analysis Infographics PDF
The following slide highlights the cyber security key performance indicator metrics analysis illustrating operational health, compliance health, controls, project status, progress, trend, compliance investigation, training compliance, incident response process and vulnerability schedule. Showcasing this set of slides titled Digital Risk Assessment Key Performance Indicator Metrics Analysis Infographics PDF. The topics addressed in these templates are Project Status, Operational Health, Compliance And Audits. All the content presented in this PPT design is completely editable. Download it and make adjustments in color, background, font etc. as per your unique business setting.
Target Customer Research Analysis Vector Icon Ppt PowerPoint Presentation Model Example Topics PDF
Persuade your audience using this target customer research analysis vector icon ppt powerpoint presentation model example topics pdf. This PPT design covers four stages, thus making it a great tool to use. It also caters to a variety of topics including target customer research analysis vector icon. Download this PPT design now to present a convincing pitch that not only emphasizes the topic but also showcases your presentation skills.
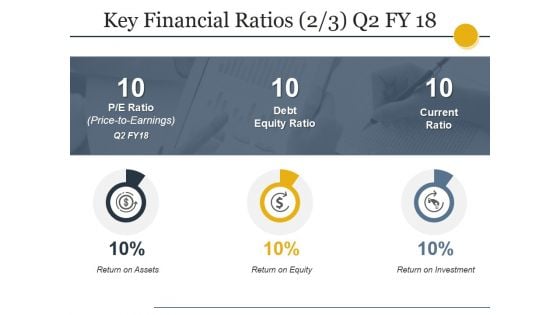
Key Financial Ratios Template Ppt PowerPoint Presentation Show Graphics Design
This is a key financial ratios template ppt powerpoint presentation show graphics design. This is a four stage process. The stages in this process are liquidity, profitability, activity, solvency.
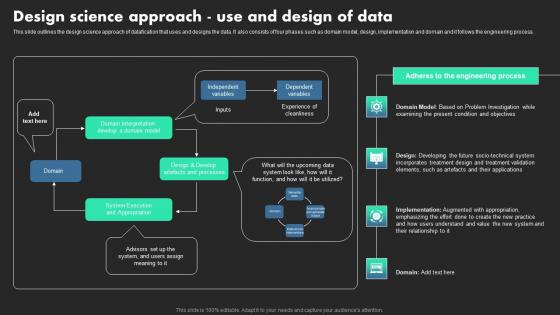
Design Science Approach Use And Design Of Data Ethical Dimensions Of Datafication Brochure Pdf
This slide outlines the design science approach of datafication that uses and designs the data. It also consists of four phases such as domain model, design, implementation and domain and it follows the engineering process. Coming up with a presentation necessitates that the majority of the effort goes into the content and the message you intend to convey. The visuals of a PowerPoint presentation can only be effective if it supplements and supports the story that is being told. Keeping this in mind our experts created Design Science Approach Use And Design Of Data Ethical Dimensions Of Datafication Brochure Pdf to reduce the time that goes into designing the presentation. This way, you can concentrate on the message while our designers take care of providing you with the right template for the situation. This slide outlines the design science approach of datafication that uses and designs the data. It also consists of four phases such as domain model, design, implementation and domain and it follows the engineering process.
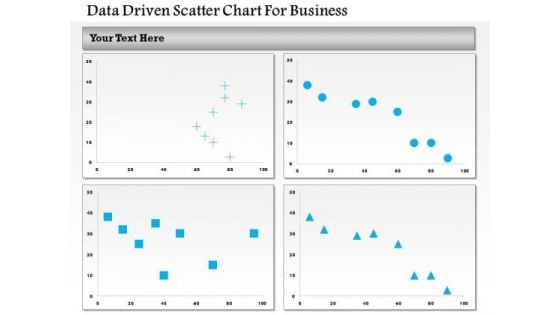
Business Diagram Data Driven Scatter Chart For Business PowerPoint Slide
This business diagram has been designed with four comparative charts. This slide suitable for data representation. You can also use this slide to present business analysis and reports. Use this diagram to present your views in a wonderful manner.


 Continue with Email

 Home
Home


