Presentation Agenda
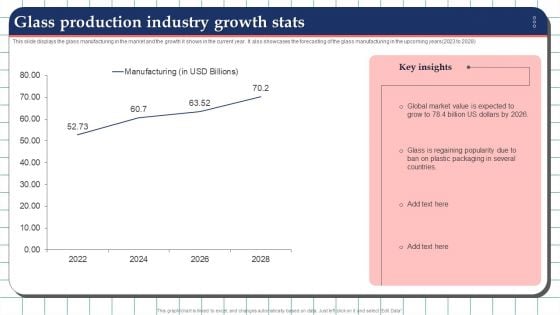
Glass Production Industry Growth Stats Graphics PDF
This slide displays the glass manufacturing in the market and the growth it shows in the current year. It also showcases the forecasting of the glass manufacturing in the upcoming years 2023 to 2028. Pitch your topic with ease and precision using this Glass Production Industry Growth Stats Graphics PDF. This layout presents information on Global Market Value, Glass Production Industry Growth. It is also available for immediate download and adjustment. So, changes can be made in the color, design, graphics or any other component to create a unique layout.
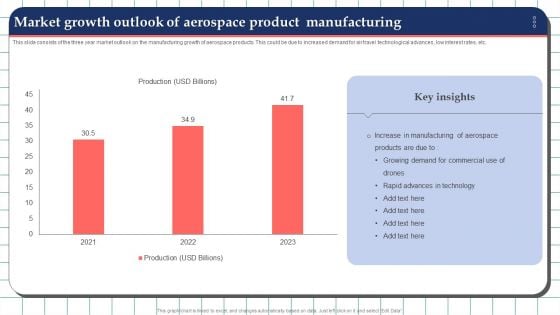
Market Growth Outlook Of Aerospace Product Manufacturing Sample PDF
This slide consists of the three year market outlook on the manufacturing growth of aerospace products. This could be due to increased demand for air travel technological advances, low interest rates, etc. Pitch your topic with ease and precision using this Market Growth Outlook Of Aerospace Product Manufacturing Sample PDF. This layout presents information on Manufacturing, Products, Demand, Commercial. It is also available for immediate download and adjustment. So, changes can be made in the color, design, graphics or any other component to create a unique layout.
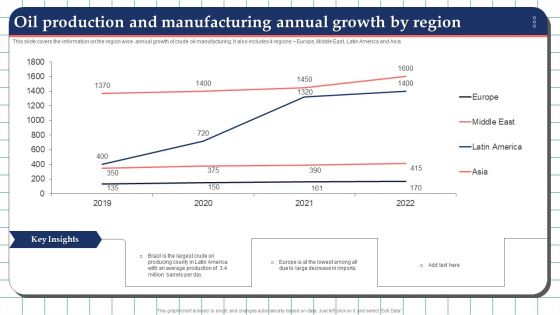
Oil Production And Manufacturing Annual Growth By Region Graphics PDF
This slide covers the information on the region wise. annual growth of crude oil manufacturing. It also includes 4 regions Europe, Middle East, Latin America and Asia. Pitch your topic with ease and precision using this Oil Production And Manufacturing Annual Growth By Region Graphics PDF. This layout presents information on Average Production, Manufacturing Annual Growth. It is also available for immediate download and adjustment. So, changes can be made in the color, design, graphics or any other component to create a unique layout.
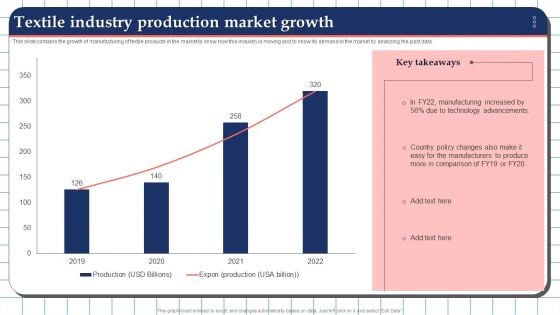
Textile Industry Production Market Growth Elements PDF
This slide contains the growth of manufacturing of textile products in the market to know how this industry is moving and to know its demand in the market by analyzing the past data. Showcasing this set of slides titled Textile Industry Production Market Growth Elements PDF. The topics addressed in these templates are Manufacturers, Technology Advancements, Production Market Growth. All the content presented in this PPT design is completely editable. Download it and make adjustments in color, background, font etc. as per your unique business setting.
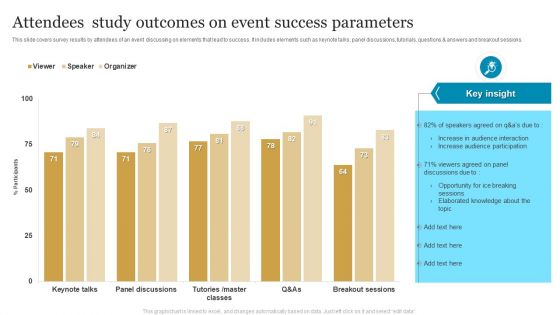
Attendees Study Outcomes On Event Success Parameters Ideas PDF
This slide covers survey results by attendees of an event discussing on elements that lead to success. It includes elements such as keynote talks, panel discussions, tutorials, questions And answers and breakout sessions. Showcasing this set of slides titled Attendees Study Outcomes On Event Success Parameters Ideas PDF. The topics addressed in these templates are Opportunity, Event Success Parameters, Attendees Study Outcomes. All the content presented in this PPT design is completely editable. Download it and make adjustments in color, background, font etc. as per your unique business setting.
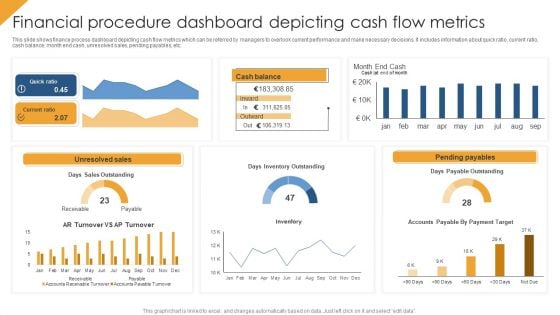
Financial Procedure Dashboard Depicting Cash Flow Metrics Structure PDF
This slide shows finance process dashboard depicting cash flow metrics which can be referred by managers to overlook current performance and make necessary decisions. It includes information about quick ratio, current ratio, cash balance, month end cash, unresolved sales, pending payables, etc. Pitch your topic with ease and precision using this Financial Procedure Dashboard Depicting Cash Flow Metrics Structure PDF. This layout presents information on Quick Ratio, Unresolved Sales, Pending Payables. It is also available for immediate download and adjustment. So, changes can be made in the color, design, graphics or any other component to create a unique layout.
Financial Procedure Dashboard Indicating Yearly Revenue Analysis Icons PDF
This slide illustrates finance process dashboard indicating yearly revenue analysis which contains gross profit margin, operating profit ratio, net profit, revenue and cost of goods sold cogs operating expenses, etc. It can be referred by company owners who can compare it with previous years performance and make related decisions for future. Showcasing this set of slides titled Financial Procedure Dashboard Indicating Yearly Revenue Analysis Icons PDF. The topics addressed in these templates are Operating Profit Percentage, Net Profit Percentage, Operating Profit Ratio. All the content presented in this PPT design is completely editable. Download it and make adjustments in color, background, font etc. as per your unique business setting.

Data Center Infrastructure Management KPI Dashboard Designs PDF
This slide covers data center infrastructure management KPI dashboard. It involves details such as cabinets with free data and power ports, data ports usage per user and items per connected power supplies. Showcasing this set of slides titled Data Center Infrastructure Management KPI Dashboard Designs PDF. The topics addressed in these templates are Data Center Infrastructure, Management KPI Dashboard. All the content presented in this PPT design is completely editable. Download it and make adjustments in color, background, font etc. as per your unique business setting.
Company Financials Performance Tracking Dashboard Brochure PDF
This slide illustrates KPI dashboard that can be used by organizations to track their financial performance on company basis. Kpis covered in the slide are contract status, revenue, cost of goods, overdue and task status. Showcasing this set of slides titled Company Financials Performance Tracking Dashboard Brochure PDF. The topics addressed in these templates are Report Shortcut, Revenue Cost, Overdue Task. All the content presented in this PPT design is completely editable. Download it and make adjustments in color, background, font etc. as per your unique business setting.
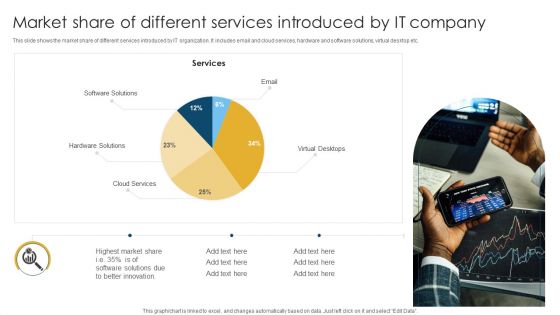
Market Share Of Different Services Introduced By IT Company Download PDF
This slide shows the market share of different services introduced by IT organization. It includes email and cloud services, hardware and software solutions, virtual desktop etc. Pitch your topic with ease and precision using this Market Share Of Different Services Introduced By IT Company Download PDF. This layout presents information on Software Solutions, Hardware Solutions, Highest Market. It is also available for immediate download and adjustment. So, changes can be made in the color, design, graphics or any other component to create a unique layout.
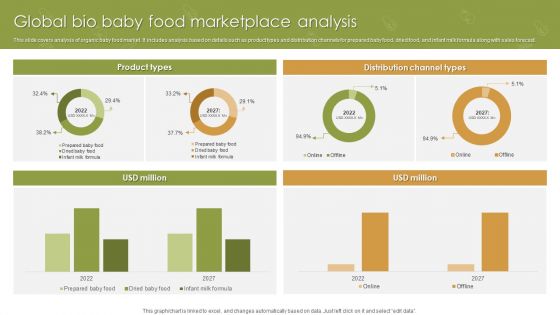
Global Bio Baby Food Marketplace Analysis Ppt Ideas Gallery PDF
This slide covers analysis of organic baby food market. It includes analysis based on details such as product types and distribution channels for prepared baby food, dried food, and infant milk formula along with sales forecast. Pitch your topic with ease and precision using this Global Bio Baby Food Marketplace Analysis Ppt Ideas Gallery PDF. This layout presents information on Product Types, Distribution Channel Types, USD Million. It is also available for immediate download and adjustment. So, changes can be made in the color, design, graphics or any other component to create a unique layout.
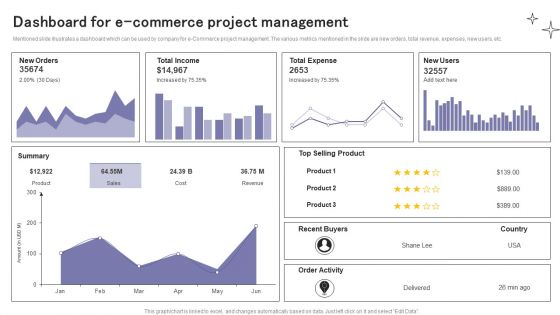
Dashboard For E Commerce Project Management Ppt Ideas Design Inspiration PDF
Mentioned slide illustrates a dashboard which can be used by company for e-Commerce project management. The various metrics mentioned in the slide are new orders, total revenue, expenses, new users, etc. Showcasing this set of slides titled Dashboard For E Commerce Project Management Ppt Ideas Design Inspiration PDF. The topics addressed in these templates are New Orders, Total Income, Total Expense. All the content presented in this PPT design is completely editable. Download it and make adjustments in color, background, font etc. as per your unique business setting.
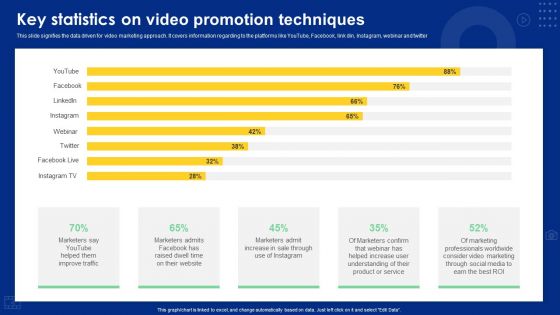
Key Statistics On Video Promotion Techniques Ppt Slides Example Introduction PDF
This slide signifies the data driven for video marketing approach. It covers information regarding to the platforms like YouTube, Facebook, link din, Instagram, webinar and twitter. Showcasing this set of slides titled Key Statistics On Video Promotion Techniques Ppt Slides Example Introduction PDF. The topics addressed in these templates are Marketers Say Youtube, Sale Through, Product Or Service. All the content presented in this PPT design is completely editable. Download it and make adjustments in color, background, font etc. as per your unique business setting.
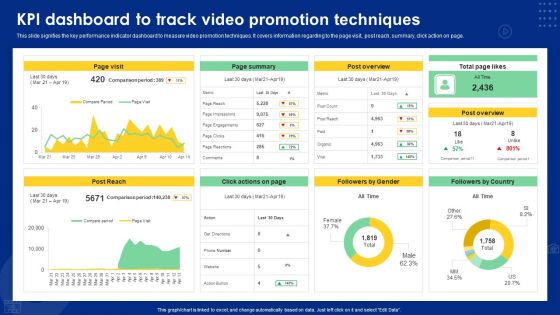
Kpi Dashboard To Track Video Promotion Techniques Ppt Summary Guide PDF
This slide signifies the key performance indicator dashboard to measure video promotion techniques. It covers information regarding to the page visit, post reach, summary, click action on page. Pitch your topic with ease and precision using this Kpi Dashboard To Track Video Promotion Techniques Ppt Summary Guide PDF. This layout presents information on Page Visit, Page Summary, Post Overview. It is also available for immediate download and adjustment. So, changes can be made in the color, design, graphics or any other component to create a unique layout.
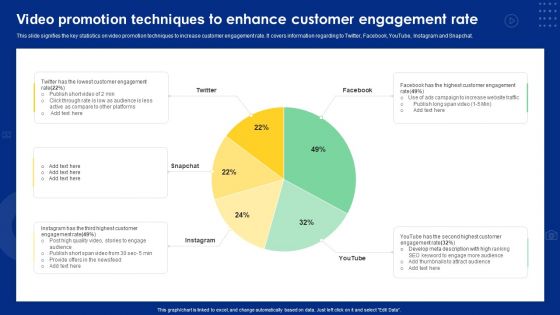
Video Promotion Techniques To Enhance Customer Engagement Rate Ppt Portfolio Images PDF
This slide signifies the key statistics on video promotion techniques to increase customer engagement rate. It covers information regarding to Twitter, Facebook, YouTube, Instagram and Snapchat. Pitch your topic with ease and precision using this Video Promotion Techniques To Enhance Customer Engagement Rate Ppt Portfolio Images PDF. This layout presents information on Facebook, Snapchat, Instagram, YouTube. It is also available for immediate download and adjustment. So, changes can be made in the color, design, graphics or any other component to create a unique layout.
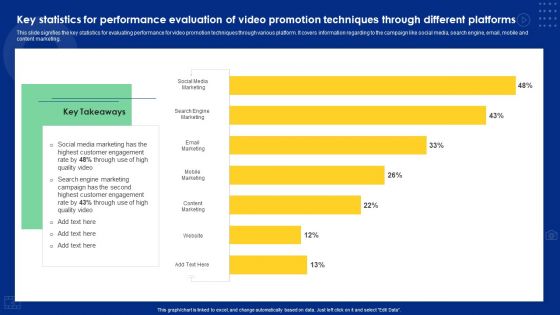
Key Statistics For Performance Evaluation Of Video Promotion Techniques Through Different Platforms Sample PDF
This slide signifies the key statistics for evaluating performance for video promotion techniques through various platform. It covers information regarding to the campaign like social media, search engine, email, mobile and content marketing. Showcasing this set of slides titled Key Statistics For Performance Evaluation Of Video Promotion Techniques Through Different Platforms Sample PDF. The topics addressed in these templates are Social Media Marketing, Search Engine Marketing, Email Marketing. All the content presented in this PPT design is completely editable. Download it and make adjustments in color, background, font etc. as per your unique business setting.
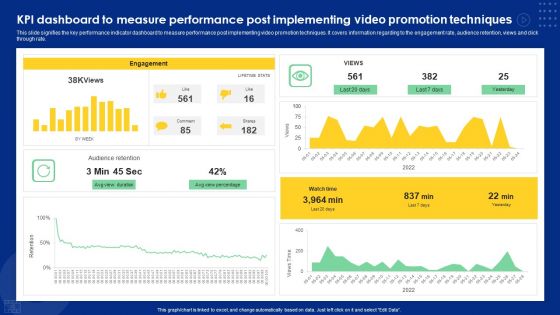
KPI Dashboard To Measure Performance Post Implementing Video Promotion Techniques Ideas PDF
This slide signifies the key performance indicator dashboard to measure performance post implementing video promotion techniques. It covers information regarding to the engagement rate, audience retention, views and click through rate. Pitch your topic with ease and precision using this KPI Dashboard To Measure Performance Post Implementing Video Promotion Techniques Ideas PDF. This layout presents information on Engagement, Audience Retention, Watch Time. It is also available for immediate download and adjustment. So, changes can be made in the color, design, graphics or any other component to create a unique layout.
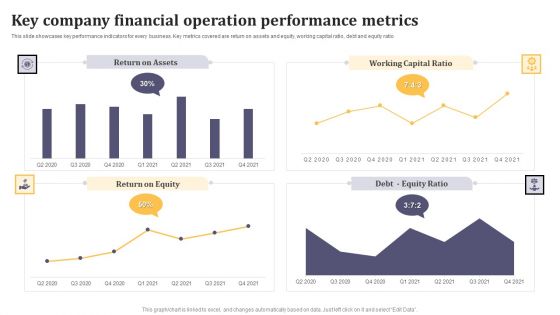
Key Company Financial Operation Performance Metrics Ppt Infographic Template Example Introduction PDF
This slide showcases key performance indicators for every business. Key metrics covered are return on assets and equity, working capital ratio, debt and equity ratio. Showcasing this set of slides titled Key Company Financial Operation Performance Metrics Ppt Infographic Template Example Introduction PDF. The topics addressed in these templates are Return on Assets, Working Capital Ratio, Return on Equity. All the content presented in this PPT design is completely editable. Download it and make adjustments in color, background, font etc. as per your unique business setting.

Product Procurement Management Dashboard With Defect Rate Supplier Availability And Lead Time Pictures PDF
This slide shows a dashboard of procurement to provide real time information about various components. It includes defect rate, on time supplies , supplier availability and lead time. Showcasing this set of slides titled Product Procurement Management Dashboard With Defect Rate Supplier Availability And Lead Time Pictures PDF. The topics addressed in these templates are Supplier Defect Rate, Supplier Availability, Lead Time. All the content presented in this PPT design is completely editable. Download it and make adjustments in color, background, font etc. as per your unique business setting.
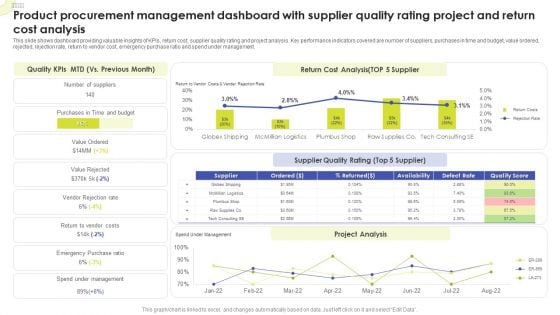
Product Procurement Management Dashboard With Supplier Quality Rating Project And Return Cost Analysis Sample PDF
This slide shows dashboard providing valuable insights of KPIs, return cost, supplier quality rating and project analysis. Key performance indicators covered are number of suppliers, purchases in time and budget, value ordered, rejected, rejection rate, return to vendor cost, emergency purchase ratio and spend under management. Pitch your topic with ease and precision using this Product Procurement Management Dashboard With Supplier Quality Rating Project And Return Cost Analysis Sample PDF. This layout presents information on Quality KPIs, Return Cost Analysis, Supplier Quality Rating. It is also available for immediate download and adjustment. So, changes can be made in the color, design, graphics or any other component to create a unique layout.
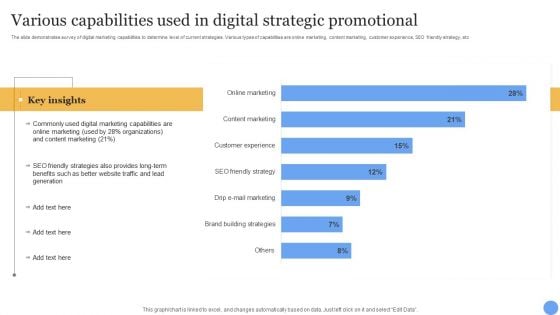
Various Capabilities Used In Digital Strategic Promotional Topics PDF
The slide demonstrates survey of digital marketing capabilities to determine level of current strategies. Various types of capabilities are online marketing, content marketing, customer experience, SEO friendly strategy, etc. Pitch your topic with ease and precision using this Various Capabilities Used In Digital Strategic Promotional Topics PDF. This layout presents information on Digital Marketing Capabilities, Content Marketing, Online Marketing. It is also available for immediate download and adjustment. So, changes can be made in the color, design, graphics or any other component to create a unique layout.
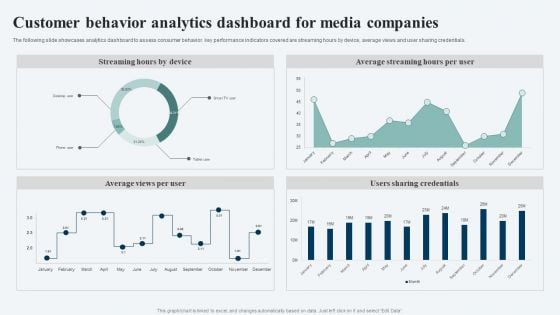
Customer Behavior Analytics Dashboard For Media Companies Ppt Ideas Visuals PDF
The following slide showcases analytics dashboard to assess consumer behavior. key performance indicators covered are streaming hours by device, average views and user sharing credentials. Showcasing this set of slides titled Customer Behavior Analytics Dashboard For Media Companies Ppt Ideas Visuals PDF. The topics addressed in these templates are Streaming Hours Device, Average Streaming Hours, Per User, Users Sharing Credentials. All the content presented in this PPT design is completely editable. Download it and make adjustments in color, background, font etc. as per your unique business setting.
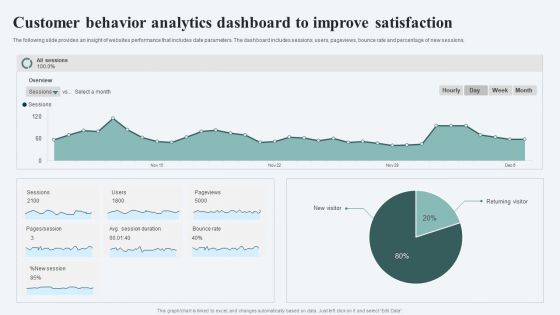
Customer Behavior Analytics Dashboard To Improve Satisfaction Ppt File Infographics PDF
The following slide provides an insight of websites performance that includes date parameters. The dashboard includes sessions, users, pageviews, bounce rate and percentage of new sessions. Pitch your topic with ease and precision using this Customer Behavior Analytics Dashboard To Improve Satisfaction Ppt File Infographics PDF. This layout presents information on Session, Avg Session Duration, Bounce Rate. It is also available for immediate download and adjustment. So, changes can be made in the color, design, graphics or any other component to create a unique layout.
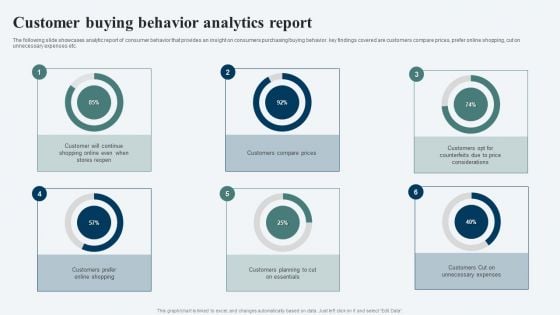
Customer Buying Behavior Analytics Report Ppt Inspiration Elements PDF
The following slide showcases analytic report of consumer behavior that provides an insight on consumers purchasing or buying behavior. key findings covered are customers compare prices, prefer online shopping, cut on unnecessary expenses etc. Pitch your topic with ease and precision using this Customer Buying Behavior Analytics Report Ppt Inspiration Elements PDF. This layout presents information on Customer Will, Continue Shopping, Stores Reopen, Customers Compare Prices. It is also available for immediate download and adjustment. So, changes can be made in the color, design, graphics or any other component to create a unique layout.
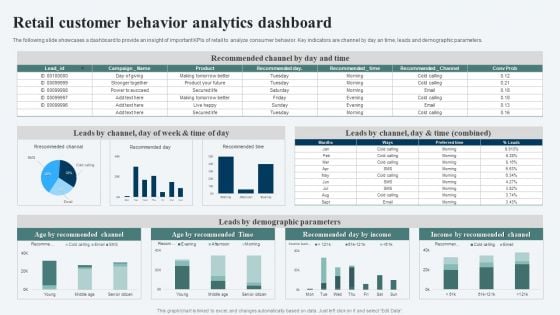
Retail Customer Behavior Analytics Dashboard Ppt Ideas Templates PDF
The following slide showcases a dashboard to provide an insight of important KPIs of retail to analyze consumer behavior. Key indicators are channel by day an time, leads and demographic parameters. Showcasing this set of slides titled Retail Customer Behavior Analytics Dashboard Ppt Ideas Templates PDF. The topics addressed in these templates are Recommended Channel, Leads Demographic Parameters, Income Recommended Channel. All the content presented in this PPT design is completely editable. Download it and make adjustments in color, background, font etc. as per your unique business setting.
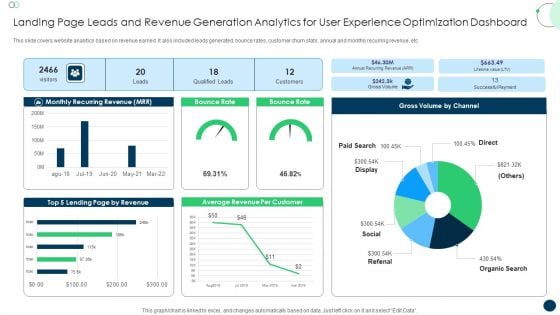
Landing Page Leads And Revenue Generation Analytics For User Experience Optimization Dashboard Formats PDF
This slide covers website analytics based on revenue earned. It also included leads generated, bounce rates, customer churn stats, annual and monthly recurring revenue, etc. Pitch your topic with ease and precision using this Landing Page Leads And Revenue Generation Analytics For User Experience Optimization Dashboard Formats PDF. This layout presents information on Monthly Recurring Revenue, Bounce Rate, Gross Volume. It is also available for immediate download and adjustment. So, changes can be made in the color, design, graphics or any other component to create a unique layout.
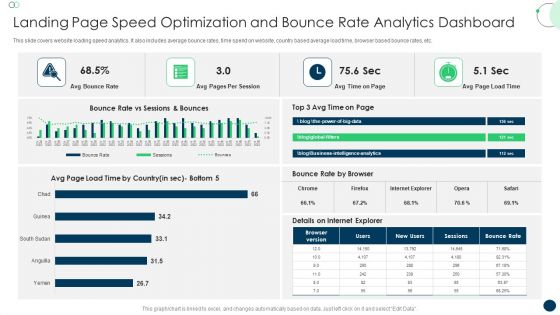
Landing Page Speed Optimization And Bounce Rate Analytics Dashboard Topics PDF
This slide covers website loading speed analytics. It also includes average bounce rates, time spend on website, country based average load time, browser based bounce rates, etc. Pitch your topic with ease and precision using this Landing Page Speed Optimization And Bounce Rate Analytics Dashboard Topics PDF. This layout presents information on Avg Bounce Rate, Avg Pages, Per Session. It is also available for immediate download and adjustment. So, changes can be made in the color, design, graphics or any other component to create a unique layout.
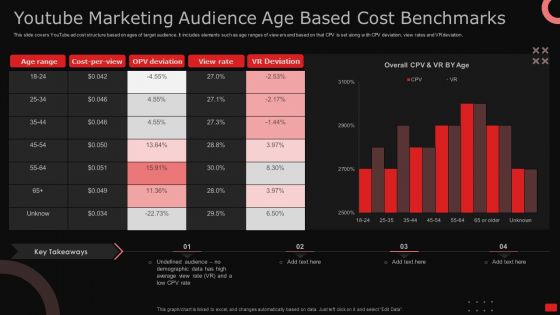
Youtube Marketing Audience Age Based Cost Benchmarks Ppt Model Show PDF
This slide covers YouTube ad cost structure based on ages of target audience. It includes elements such as age ranges of viewers and based on that CPV is set along with CPV deviation, view rates and VR deviation. Pitch your topic with ease and precision using this Youtube Marketing Audience Age Based Cost Benchmarks Ppt Model Show PDF. This layout presents information on Age Range, Cost Per View, OPV Deviation. It is also available for immediate download and adjustment. So, changes can be made in the color, design, graphics or any other component to create a unique layout.
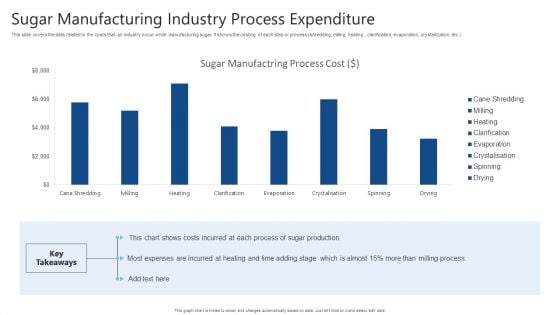
Sugar Manufacturing Industry Process Expenditure Ppt Infographic Template Information PDF
This slide covers the data related to the costs that an industry occur while manufacturing sugar. It shows the costing of each step or process shredding, milling, heating, clarification, evaporation, crystallization, etc. Pitch your topic with ease and precision using this Sugar Manufacturing Industry Process Expenditure Ppt Infographic Template Information PDF. This layout presents information on Sugar Manufactring Process, Cost, Sugar Production. It is also available for immediate download and adjustment. So, changes can be made in the color, design, graphics or any other component to create a unique layout.
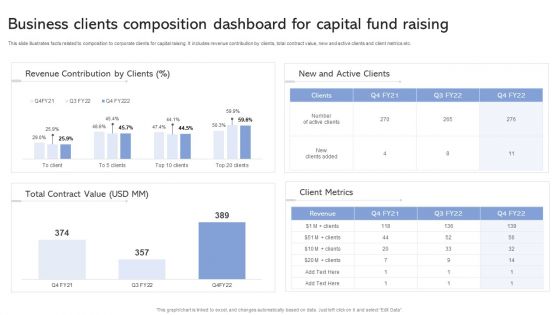
Business Clients Composition Dashboard For Capital Fund Raising Ppt Infographic Template Microsoft PDF
This slide illustrates facts related to composition to corporate clients for capital raising. It includes revenue contribution by clients, total contract value, new and active clients and client metrics etc. Showcasing this set of slides titled Business Clients Composition Dashboard For Capital Fund Raising Ppt Infographic Template Microsoft PDF. The topics addressed in these templates are Revenue Contribution Clients, Client Metrics, Total Contract Value. All the content presented in this PPT design is completely editable. Download it and make adjustments in color, background, font etc. as per your unique business setting.
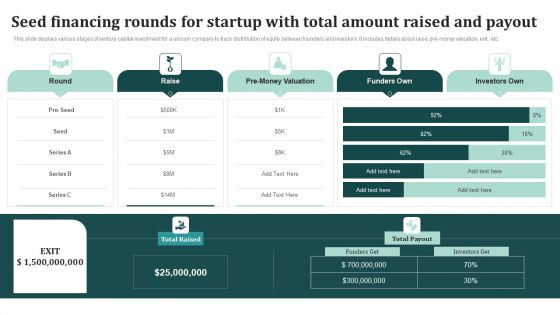
Seed Financing Rounds For Startup With Total Amount Raised And Payout Mockup PDF
This slide displays various stages of venture capital investment for a unicorn company to track distribution of equity between founders and investors. It includes details about raise, pre-money valuation, exit, etc. Showcasing this set of slides titled Seed Financing Rounds For Startup With Total Amount Raised And Payout Mockup PDF. The topics addressed in these templates are Funders Own, Investors Own, Total Raised. All the content presented in this PPT design is completely editable. Download it and make adjustments in color, background, font etc. as per your unique business setting.
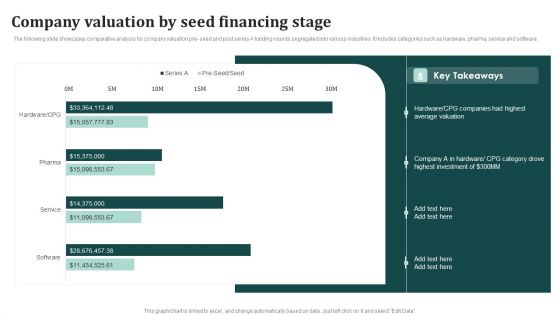
Company Valuation By Seed Financing Stage Ppt Infographic Template Graphics Tutorials PDF
The following slide showcases comparative analysis for company valuation pre- seed and post series A funding rounds segregated into various industries. It includes categories such as hardware, pharma, service and software. Showcasing this set of slides titled Company Valuation By Seed Financing Stage Ppt Infographic Template Graphics Tutorials PDF. The topics addressed in these templates are CPG Companies, Highest Average Valuation, Highest Investment. All the content presented in this PPT design is completely editable. Download it and make adjustments in color, background, font etc. as per your unique business setting.
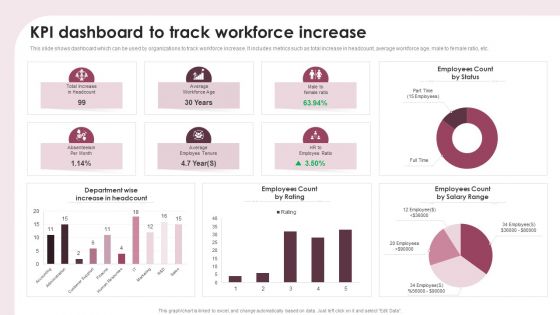
KPI Dashboard To Track Workforce Increase Ppt Show Portfolio PDF
This slide shows dashboard which can be used by organizations to track workforce increase. It includes metrics such as total increase in headcount, average workforce age, male to female ratio, etc. Pitch your topic with ease and precision using this KPI Dashboard To Track Workforce Increase Ppt Show Portfolio PDF. This layout presents information on Department Wise, Increase Headcount, Employees Count Rating. It is also available for immediate download and adjustment. So, changes can be made in the color, design, graphics or any other component to create a unique layout.
Altcoins Portfolio Tracking Metrics Dashboard Ppt Inspiration Background Images PDF
This slide covers dashboard for tracking different cryptocurrencies value and growth. It includes metrics such as incomes and expenses, market values, cryptocurrency transactions history, overall growth percentages, exchange rates, etc. Showcasing this set of slides titled Altcoins Portfolio Tracking Metrics Dashboard Ppt Inspiration Background Images PDF. The topics addressed in these templates are Balance, 3 Currencies, Transactions. All the content presented in this PPT design is completely editable. Download it and make adjustments in color, background, font etc. as per your unique business setting.
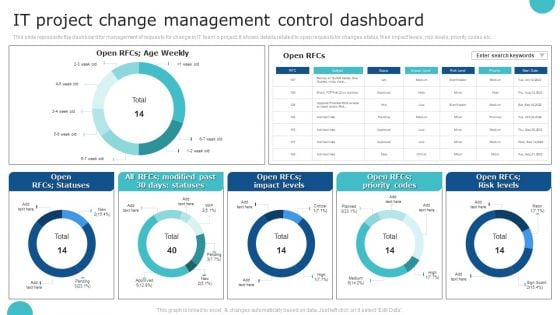
IT Project Change Management Control Dashboard Topics PDF
This slide represents the dashboard for management of requests for change in IT teams project. It shows details related to open requests for changes status, their impact levels, risk levels, priority codes etc. Showcasing this set of slides titled IT Project Change Management Control Dashboard Topics PDF. The topics addressed in these templates are IT Project Change Management, Control Dashboard. All the content presented in this PPT design is completely editable. Download it and make adjustments in color, background, font etc. as per your unique business setting.
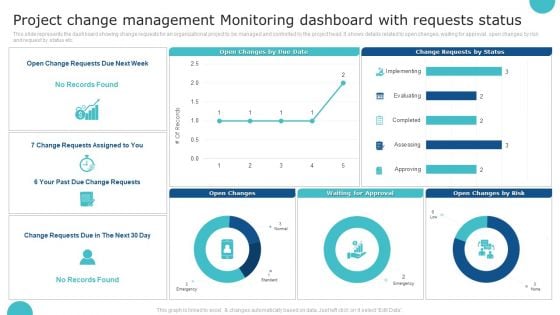
Project Change Management Monitoring Dashboard With Requests Status Structure PDF
This slide represents the dashboard showing change requests for an organizational project to be managed and controlled by the project head. It shows details related to open changes, waiting for approval, open changes by risk and request by status etc. Showcasing this set of slides titled Project Change Management Monitoring Dashboard With Requests Status Structure PDF. The topics addressed in these templates are Project Change Management, Monitoring Dashboard. All the content presented in this PPT design is completely editable. Download it and make adjustments in color, background, font etc. as per your unique business setting.
Risk Management Dashboard Of IT Department With Threat Frequency Icons PDF
This slide shows dashboard of risk management of IT department representing net critical risks, threat and vulnerability frequency in last 60 days, open audit findings, open and vendor risks etc. Showcasing this set of slides titled Risk Management Dashboard Of IT Department With Threat Frequency Icons PDF. The topics addressed in these templates are Net Critical Risk, Organization, Threat Frequency. All the content presented in this PPT design is completely editable. Download it and make adjustments in color, background, font etc. as per your unique business setting.
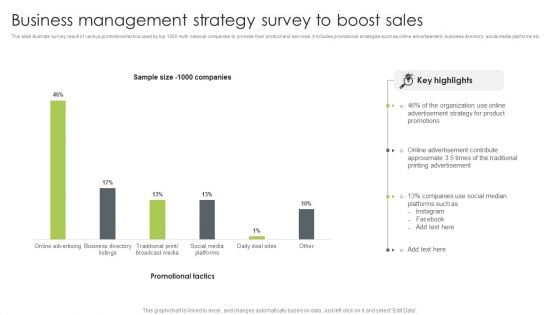
Business Management Strategy Survey To Boost Sales Summary PDF
This slide illustrate survey result of various promotional tactics used by top 1000 multi national companies to promote their product and services. it includes promotional strategies such as online advertisement, business directory, social media platforms etc. Pitch your topic with ease and precision using this Business Management Strategy Survey To Boost Sales Summary PDF. This layout presents information on Advertisement Strategy, Organization, Social Median. It is also available for immediate download and adjustment. So, changes can be made in the color, design, graphics or any other component to create a unique layout.
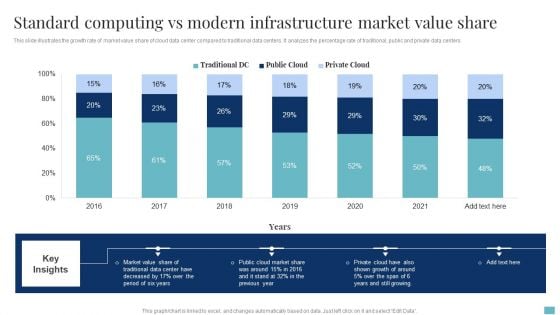
Standard Computing Vs Modern Infrastructure Market Value Share Brochure PDF
This slide illustrates the growth rate of market value share of cloud data center compared to traditional data centers. It analyzes the percentage rate of traditional, public and private data centers. Pitch your topic with ease and precision using this Standard Computing Vs Modern Infrastructure Market Value Share Brochure PDF. This layout presents information on Cloud Market Share, Market Value Share, Growth. It is also available for immediate download and adjustment. So, changes can be made in the color, design, graphics or any other component to create a unique layout.
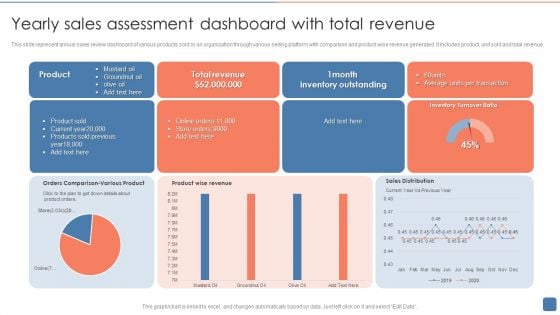
Yearly Sales Assessment Dashboard With Total Revenue Introduction PDF
This slide represent annual sales review dashboard of various products sold by an organization through various selling platform with comparison and product wise revenue generated .It includes product, unit sold and total revenue. Showcasing this set of slides titled Yearly Sales Assessment Dashboard With Total Revenue Introduction PDF. The topics addressed in these templates are Product Sold, Inventory Outstanding, Average. All the content presented in this PPT design is completely editable. Download it and make adjustments in color, background, font etc. as per your unique business setting.
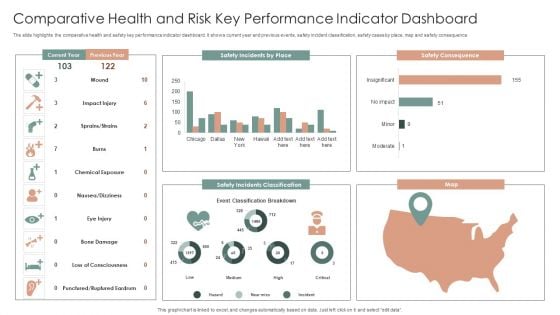
Comparative Health And Risk Key Performance Indicator Dashboard Ppt Portfolio Slide PDF
The slide highlights the comparative health and safety key performance indicator dashboard. It shows current year and previous events, safety incident classification, safety cases by place, map and safety consequence. Showcasing this set of slides titled Comparative Health And Risk Key Performance Indicator Dashboard Ppt Portfolio Slide PDF. The topics addressed in these templates are Safety Consequence, Safety Incidents Classification, Map. All the content presented in this PPT design is completely editable. Download it and make adjustments in color, background, font etc. as per your unique business setting.
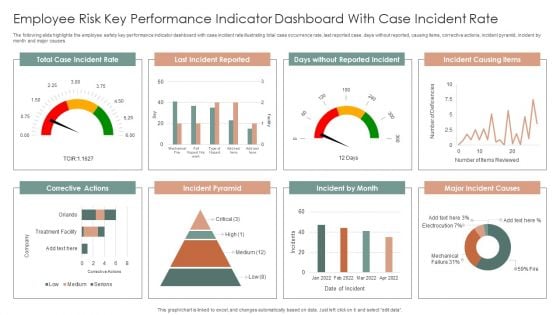
Employee Risk Key Performance Indicator Dashboard With Case Incident Rate Ppt Professional Information PDF
The following slide highlights the employee safety key performance indicator dashboard with case incident rate illustrating total case occurrence rate, last reported case, days without reported, causing items, corrective actions, incident pyramid, incident by month and major causes. Pitch your topic with ease and precision using this Employee Risk Key Performance Indicator Dashboard With Case Incident Rate Ppt Professional Information PDF. This layout presents information on Total Case, Incident Rate, Last Incident Reported, Incident Causing Items. It is also available for immediate download and adjustment. So, changes can be made in the color, design, graphics or any other component to create a unique layout.
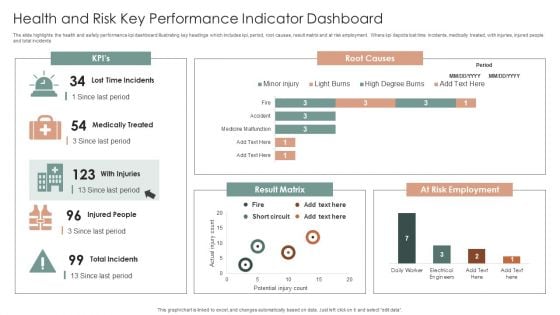
Health And Risk Key Performance Indicator Dashboard Ppt Layouts Graphics Design PDF
The slide highlights the health and safety performance kpi dashboard illustrating key headings which includes kpi, period, root causes, result matrix and at risk employment. Where kpi depicts lost time incidents, medically treated, with injuries, injured people and total incidents. Showcasing this set of slides titled Health And Risk Key Performance Indicator Dashboard Ppt Layouts Graphics Design PDF. The topics addressed in these templates are Root Causes, Result Matrix, At Risk Employment. All the content presented in this PPT design is completely editable. Download it and make adjustments in color, background, font etc. as per your unique business setting.

Health And Risk KPI Dashboard Ppt Pictures Designs Download PDF
The slide highlights the health and safety key performance indicator dashboard illustrating key headings which includes key objectives, inspections, total reports vs over due reports, injuries by body part and accident trends. Pitch your topic with ease and precision using this Health And Risk KPI Dashboard Ppt Pictures Designs Download PDF. This layout presents information on Key Objectives, Inspections, Accidents Trends. It is also available for immediate download and adjustment. So, changes can be made in the color, design, graphics or any other component to create a unique layout.
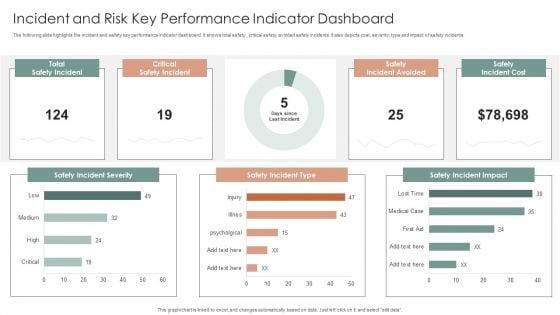
Incident And Risk Key Performance Indicator Dashboard Ppt Gallery Mockup PDF
The following slide highlights the incident and safety key performance indicator dashboard. It shows total safety, critical safety, avoided safety incidents. It also depicts cost, severity, type and impact of safety incidents. Showcasing this set of slides titled Incident And Risk Key Performance Indicator Dashboard Ppt Gallery Mockup PDF. The topics addressed in these templates are Safety Incident Severity, Safety Incident Type, Safety Incident Impact. All the content presented in this PPT design is completely editable. Download it and make adjustments in color, background, font etc. as per your unique business setting.

Patient Health And Risk Key Performance Indicator Dashboard Ppt Infographic Template Summary PDF
The following slide highlights the patient health and safety key performance indicator dashboard illustrating admission by department, admission by cost, patient satisfaction, total patients, operations cost, patient density, total staff, waiting time, treatment satisfaction and treatment confidence. Pitch your topic with ease and precision using this Patient Health And Risk Key Performance Indicator Dashboard Ppt Infographic Template Summary PDF. This layout presents information on Admission By Department, Admission Vs Cost, Patient Satisfaction. It is also available for immediate download and adjustment. So, changes can be made in the color, design, graphics or any other component to create a unique layout.
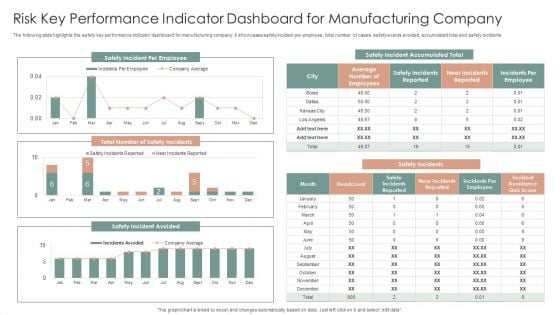
Risk Key Performance Indicator Dashboard For Manufacturing Company Ppt Gallery Graphics Design PDF
The following slide highlights the safety key performance indicator dashboard for manufacturing company. It showcases safety incident per employee, total number of cases, safety events avoided, accumulated total and safety incidents. Pitch your topic with ease and precision using this Risk Key Performance Indicator Dashboard For Manufacturing Company Ppt Gallery Graphics Design PDF. This layout presents information on Safety Incidents, Safety Incident Avoided, Safety Incident Accumulated. It is also available for immediate download and adjustment. So, changes can be made in the color, design, graphics or any other component to create a unique layout.
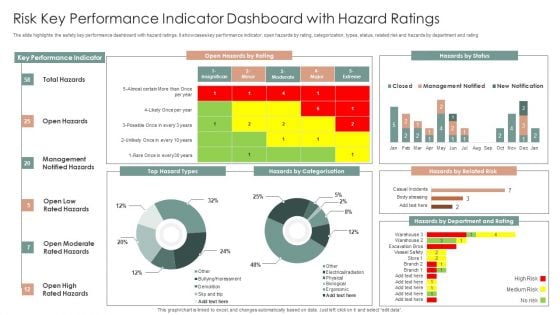
Risk Key Performance Indicator Dashboard With Hazard Ratings Ppt Layouts Slideshow PDF
The slide highlights the safety key performance dashboard with hazard ratings. It showcases key performance indicator, open hazards by rating, categorization, types, status, related risk and hazards by department and rating. Showcasing this set of slides titled Risk Key Performance Indicator Dashboard With Hazard Ratings Ppt Layouts Slideshow PDF. The topics addressed in these templates are Key Performance Indicator, Open Hazards, Hazards By Status. All the content presented in this PPT design is completely editable. Download it and make adjustments in color, background, font etc. as per your unique business setting.
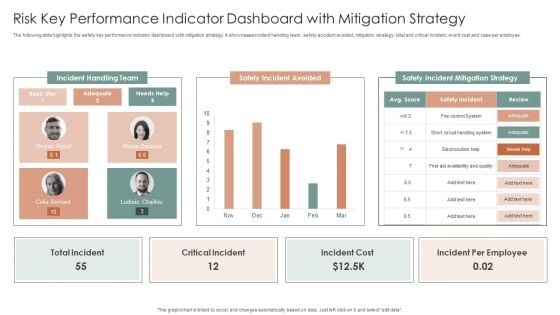
Risk Key Performance Indicator Dashboard With Mitigation Strategy Ppt Inspiration Design Templates PDF
The following slide highlights the safety key performance indicator dashboard with mitigation strategy. It showcases incident handling team, safety accident avoided, mitigation strategy, total and critical incident, event cost and case per employee. Showcasing this set of slides titled Risk Key Performance Indicator Dashboard With Mitigation Strategy Ppt Inspiration Design Templates PDF. The topics addressed in these templates are Incident Handling Team, Safety Incident Avoided, Safety Incident. All the content presented in this PPT design is completely editable. Download it and make adjustments in color, background, font etc. as per your unique business setting.
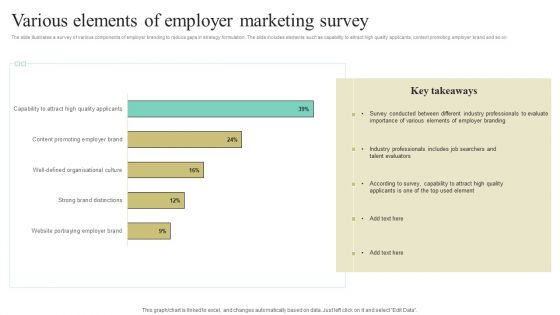
Various Elements Of Employer Marketing Survey Ppt Summary Example PDF
The slide illustrates a survey of various components of employer branding to reduce gaps in strategy formulation. The slide includes elements such as capability to attract high quality applicants, content promoting employer brand and so on. Showcasing this set of slides titled Various Elements Of Employer Marketing Survey Ppt Summary Example PDF. The topics addressed in these templates are Employer Branding, Talent Evaluators, According To Survey. All the content presented in this PPT design is completely editable. Download it and make adjustments in color, background, font etc. as per your unique business setting.
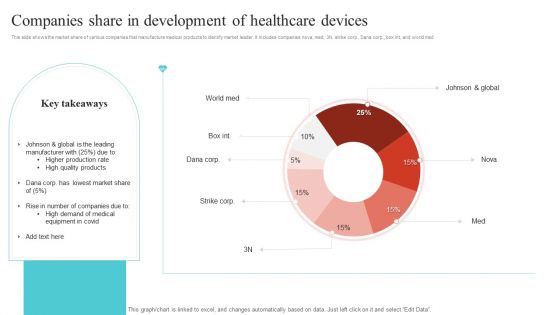
Companies Share In Development Of Healthcare Devices Ppt Summary Infographics PDF
This slide shows the market share of various companies that manufacture medical products to identify market leader. It includes companies nova, med, 3N, strike corp., Dana corp., box int, and world med. Showcasing this set of slides titled Companies Share In Development Of Healthcare Devices Ppt Summary Infographics PDF. The topics addressed in these templates are Johnson And Global, High Quality Products, Higher Production Rate. All the content presented in this PPT design is completely editable. Download it and make adjustments in color, background, font etc. as per your unique business setting.
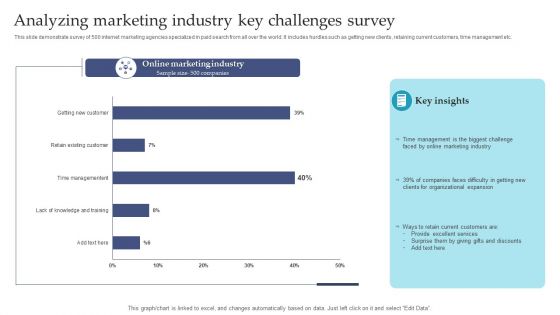
Analyzing Marketing Industry Key Challenges Survey Ppt Inspiration Skills PDF
This slide demonstrate survey of 500 internet marketing agencies specialized in paid search from all over the world. It includes hurdles such as getting new clients, retaining current customers, time management etc. Showcasing this set of slides titled Analyzing Marketing Industry Key Challenges Survey Ppt Inspiration Skills PDF. The topics addressed in these templates are Online Marketing Industry, Time Management, Online Marketing Industry. All the content presented in this PPT design is completely editable. Download it and make adjustments in color, background, font etc. as per your unique business setting.

Infrastructure Expansion KPI Dashboard For Investment Project Management Inspiration PDF
This slide covers management dashboard for analyzing the project performance and progress. It include KPIs such as total claims to date, total costs to date, project status, profits, number of days left, etc. Showcasing this set of slides titled Infrastructure Expansion KPI Dashboard For Investment Project Management Inspiration PDF. The topics addressed in these templates are Claims And Costs, Project Status, Profits. All the content presented in this PPT design is completely editable. Download it and make adjustments in color, background, font etc. as per your unique business setting.
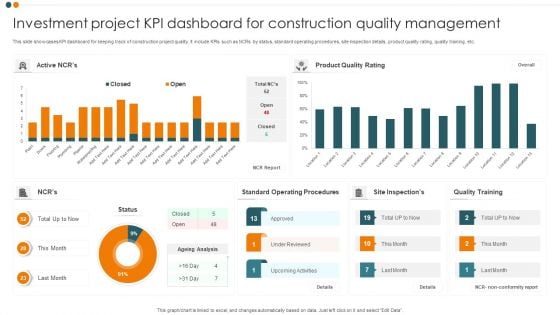
Investment Project KPI Dashboard For Construction Quality Management Pictures PDF
This slide showcases KPI dashboard for keeping track of construction project quality. It include KPIs such as NCRs by status, standard operating procedures, site inspection details, product quality rating, quality training, etc. Showcasing this set of slides titled Investment Project KPI Dashboard For Construction Quality Management Pictures PDF. The topics addressed in these templates are Product Quality Rating, Standard Operating Procedures, Quality Training. All the content presented in this PPT design is completely editable. Download it and make adjustments in color, background, font etc. as per your unique business setting.
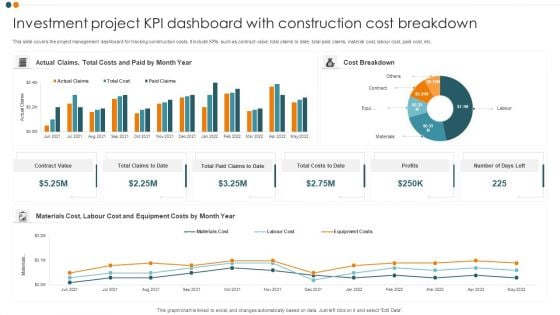
Investment Project KPI Dashboard With Construction Cost Breakdown Professional PDF
This slide covers the project management dashboard for tracking construction costs. It include KPIs such as contract value, total claims to date, total paid claims, material cost, labour cost, paid cost, etc. Showcasing this set of slides titled Investment Project KPI Dashboard With Construction Cost Breakdown Professional PDF. The topics addressed in these templates are Actual Claims, Cost Breakdown, Contract Value. All the content presented in this PPT design is completely editable. Download it and make adjustments in color, background, font etc. as per your unique business setting.
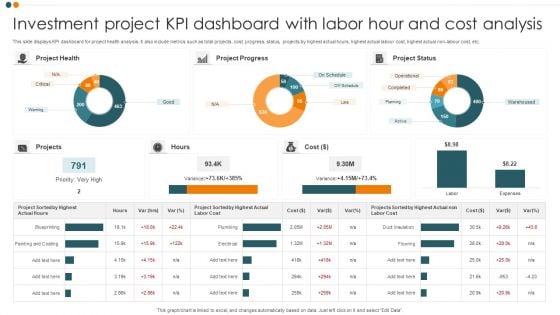
Investment Project KPI Dashboard With Labor Hour And Cost Analysis Portrait PDF
This slide displays KPI dashboard for project health analysis. It also include metrics such as total projects, cost, progress, status, projects by highest actual hours, highest actual labour cost, highest actual non-labour cost, etc. Pitch your topic with ease and precision using this Investment Project KPI Dashboard With Labor Hour And Cost Analysis Portrait PDF. This layout presents information on Project Health, Project Progress, Project Status. It is also available for immediate download and adjustment. So, changes can be made in the color, design, graphics or any other component to create a unique layout.
Investment Project Prioritization KPI Dashboard Icons PDF
This slide covers project management dashboard for ranking and filtering capital projects. It also include KPIs such as top projects by NPV, top projects by IRR, investor amount, return amount, etc. Showcasing this set of slides titled Investment Project Prioritization KPI Dashboard Icons PDF. The topics addressed in these templates are Project Performance, Top Project NPV, Top Project IRR. All the content presented in this PPT design is completely editable. Download it and make adjustments in color, background, font etc. as per your unique business setting.
Monthly Project Investment Expense Tracking KPI Dashboard Themes PDF
This slide showcases KPI dashboard for analysing the variance between billed and budgeted expenses. It also include metrics such as project budget, potential, billed, cost, margin billed vs. budget labour cost, hours details by resources, etc. Pitch your topic with ease and precision using this Monthly Project Investment Expense Tracking KPI Dashboard Themes PDF. This layout presents information on Project Summary, Sales Potential. It is also available for immediate download and adjustment. So, changes can be made in the color, design, graphics or any other component to create a unique layout.
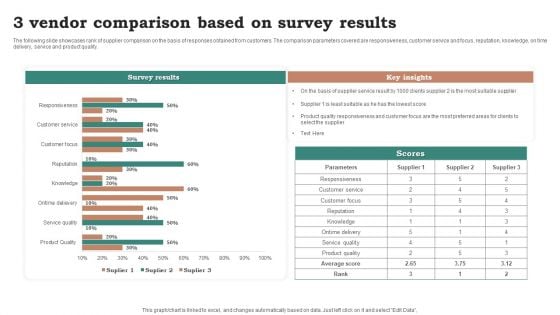
3 Vendor Comparison Based On Survey Results Ppt Ideas Graphic Tips PDF
The following slide showcases rank of supplier comparison on the basis of responses obtained from customers. The comparison parameters covered are responsiveness, customer service and focus, reputation, knowledge, on time delivery, service and product quality. Pitch your topic with ease and precision using this 3 Vendor Comparison Based On Survey Results Ppt Ideas Graphic Tips PDF. This layout presents information on Survey Results, Key Insights, Parameters. It is also available for immediate download and adjustment. So, changes can be made in the color, design, graphics or any other component to create a unique layout.
Building Quality Inspection Dashboard With Customer Satisfaction Ratio Icons PDF
The following slide showcases dashboard of construction company exhibiting quality KPIs regarding safety, workmanship and customer satisfaction. Key indicators covered are site inspection success level, CSR, defect count, net promoter score, promotors, passives, defectors, total rework cost, safety meetings and average time taken to fix defects. Showcasing this set of slides titled Building Quality Inspection Dashboard With Customer Satisfaction Ratio Icons PDF. The topics addressed in these templates are Construction Project, Customer Satisfaction Ratio, Promoters. All the content presented in this PPT design is completely editable. Download it and make adjustments in color, background, font etc. as per your unique business setting.


 Continue with Email

 Home
Home


