Presentation Agenda
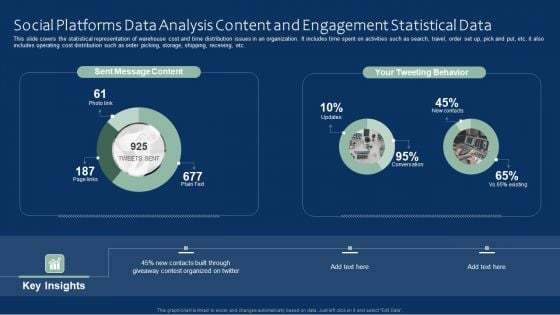
Social Platforms Data Analysis Content And Engagement Statistical Data Microsoft PDF
This slide covers the statistical representation of warehouse cost and time distribution issues in an organization. It includes time spent on activities such as search, travel, order set up, pick and put, etc. it also includes operating cost distribution such as order picking, storage, shipping, receiving, etc. Showcasing this set of slides titled Social Platforms Data Analysis Content And Engagement Statistical Data Microsoft PDF. The topics addressed in these templates are Social Platforms Data, Analysis Content, Engagement Statistical Data. All the content presented in this PPT design is completely editable. Download it and make adjustments in color, background, font etc. as per your unique business setting.
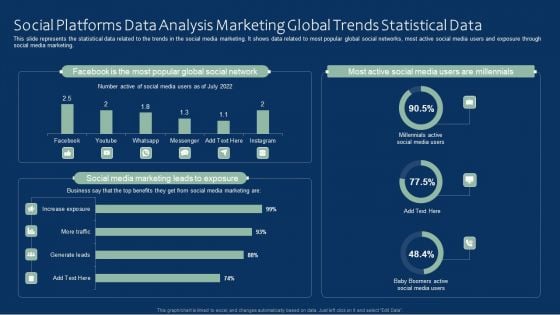
Social Platforms Data Analysis Marketing Global Trends Statistical Data Rules PDF
This slide represents the statistical data related to the trends in the social media marketing. It shows data related to most popular global social networks, most active social media users and exposure through social media marketing. Pitch your topic with ease and precision using this Social Platforms Data Analysis Marketing Global Trends Statistical Data Rules PDF. This layout presents information on Social Platforms Data Analysis, Marketing Global, Trends Statistical Data. It is also available for immediate download and adjustment. So, changes can be made in the color, design, graphics or any other component to create a unique layout.
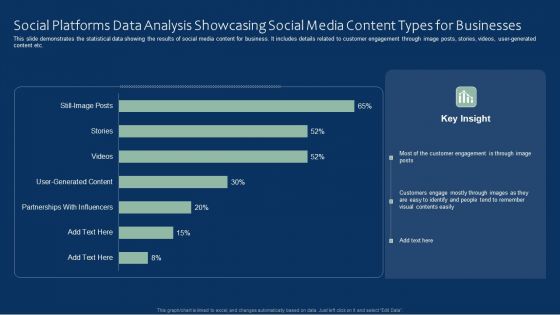
Social Platforms Data Analysis Showcasing Social Media Content Types For Businesses Inspiration PDF
This slide demonstrates the statistical data showing the results of social media content for business. It includes details related to customer engagement through image posts, stories, videos, user-generated content etc. Showcasing this set of slides titled Social Platforms Data Analysis Showcasing Social Media Content Types For Businesses Inspiration PDF. The topics addressed in these templates are Content Types For Businesses, Showcasing Social Media, Social Platforms Data Analysis. All the content presented in this PPT design is completely editable. Download it and make adjustments in color, background, font etc. as per your unique business setting.
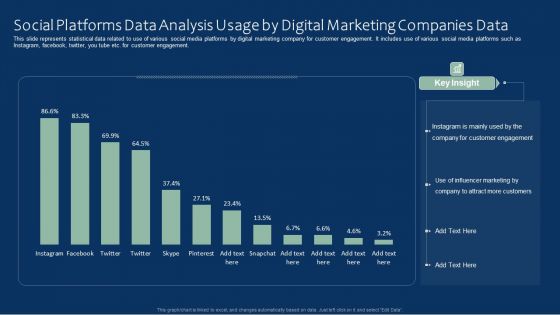
Social Platforms Data Analysis Usage By Digital Marketing Companies Data Clipart PDF
This slide represents statistical data related to use of various social media platforms by digital marketing company for customer engagement. It includes use of various social media platforms such as Instagram, facebook, twitter, you tube etc. for customer engagement. Pitch your topic with ease and precision using this Social Platforms Data Analysis Usage By Digital Marketing Companies Data Clipart PDF. This layout presents information on Social Platforms Data Analysis, Digital Marketing Companies Data. It is also available for immediate download and adjustment. So, changes can be made in the color, design, graphics or any other component to create a unique layout.
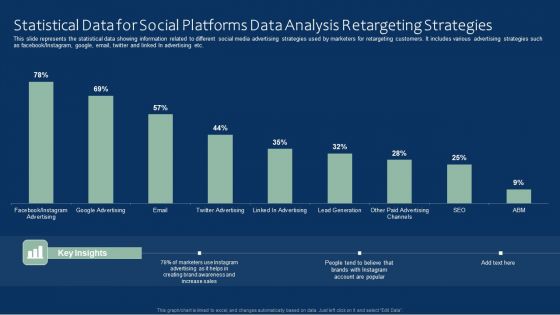
Statistical Data For Social Platforms Data Analysis Retargeting Strategies Inspiration PDF
This slide represents the statistical data showing information related to different social media advertising strategies used by marketers for retargeting customers. It includes various advertising strategies such as facebook or Instagram, google, email, twitter and linked In advertising etc. Showcasing this set of slides titled Statistical Data For Social Platforms Data Analysis Retargeting Strategies Inspiration PDF. The topics addressed in these templates are Social Platforms Data, Statistical Data, Analysis Retargeting Strategies. All the content presented in this PPT design is completely editable. Download it and make adjustments in color, background, font etc. as per your unique business setting.
Statistical Data On Social Platforms Data Analysis Services Offered By Marketing Agencies Icons PDF
This slide shows the statistics related to social media services provided by the marketing agencies to their clients. It includes various services such as content creation, social media monitoring, strategy building, campaign analysis etc. Pitch your topic with ease and precision using this Statistical Data On Social Platforms Data Analysis Services Offered By Marketing Agencies Icons PDF. This layout presents information on Statistical Data, Social Platforms Data, Analysis Services, Marketing Agencies. It is also available for immediate download and adjustment. So, changes can be made in the color, design, graphics or any other component to create a unique layout.
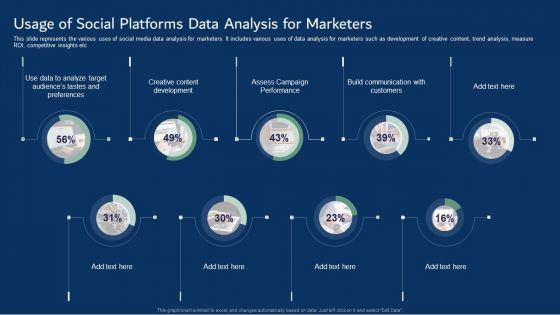
Usage Of Social Platforms Data Analysis For Marketers Information PDF
This slide represents the various uses of social media data analysis for marketers. It includes various uses of data analysis for marketers such as development of creative content, trend analysis, measure ROI, competitive insights etc. Showcasing this set of slides titled Usage Of Social Platforms Data Analysis For Marketers Information PDF. The topics addressed in these templates are Creative Content Development, Assess Campaign Performance, Build Communication. All the content presented in this PPT design is completely editable. Download it and make adjustments in color, background, font etc. as per your unique business setting.
Tracking Goals Achievement Status Dashboard Themes PDF
This slide showcases the objective status report, which helps track current the percentage of the targets achieved and left. It also includes the number of overdue targets and unachieved departmental goals. Pitch your topic with ease and precision using this Tracking Goals Achievement Status Dashboard Themes PDF. This layout presents information on Achieved Objectives, Unachieved Objectives, Overdue. It is also available for immediate download and adjustment. So, changes can be made in the color, design, graphics or any other component to create a unique layout.
Tracking Goals Alignment KPI Dashboard Guidelines PDF
This slide showcases a tracking dashboard for determining the alignment and progress percentage of the assigned objectives. It also includes the objective evaluation KPIs such as active objectives, overall progress, total employees, objective as per employees, aligned, organizational and departmental objectives. Pitch your topic with ease and precision using this Tracking Goals Alignment KPI Dashboard Guidelines PDF. This layout presents information on Employee, Organizational Objectives, Departmental Objectives. It is also available for immediate download and adjustment. So, changes can be made in the color, design, graphics or any other component to create a unique layout.
Tracking Goals Dashboard With Progress Report Rules PDF
This slide showcases the progress report which helps to determine gaps in the objective achievement process and take corrective actions. It also includes objective details such as contributor, due date, and progress percentage. Showcasing this set of slides titled Tracking Goals Dashboard With Progress Report Rules PDF. The topics addressed in these templates are Immediate Action Required, Progress Update Required, Concise Goal Outcome Required. All the content presented in this PPT design is completely editable. Download it and make adjustments in color, background, font etc. as per your unique business setting.
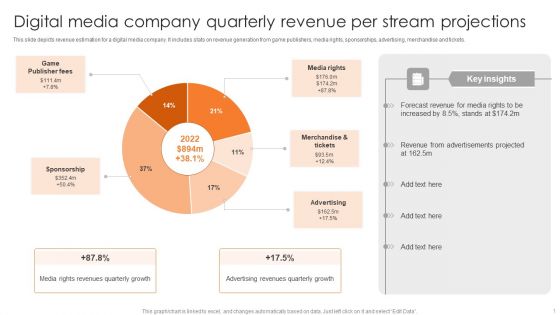
Digital Media Company Quarterly Revenue Per Stream Projections Elements PDF
This slide depicts revenue estimation for a digital media company. It includes stats on revenue generation from game publishers, media rights, sponsorships, advertising, merchandise and tickets. Pitch your topic with ease and precision using this Digital Media Company Quarterly Revenue Per Stream Projections Elements PDF. This layout presents information on Game Publisher Fees, Media Rights, Merchandise And Tickets. It is also available for immediate download and adjustment. So, changes can be made in the color, design, graphics or any other component to create a unique layout.
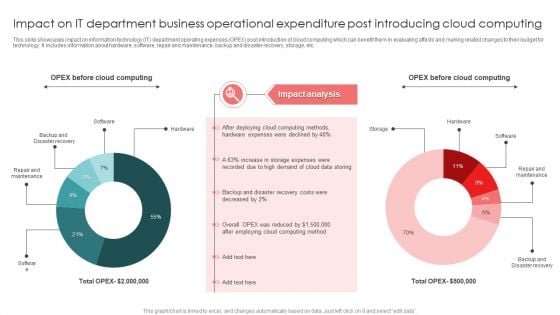
Impact On IT Department Business Operational Expenditure Post Introducing Cloud Computing Infographics PDF
This slide showcases impact on information technology IT department operating expenses OPEX post introduction of cloud computing which can benefit them in evaluating affects and making related changes to their budget for technology. It includes information about hardware, software, repair and maintenance, backup and disaster recovery, storage, etc. Showcasing this set of slides titled Impact On IT Department Business Operational Expenditure Post Introducing Cloud Computing Infographics PDF. The topics addressed in these templates are Software, Hardware, Storage. All the content presented in this PPT design is completely editable. Download it and make adjustments in color, background, font etc. as per your unique business setting.
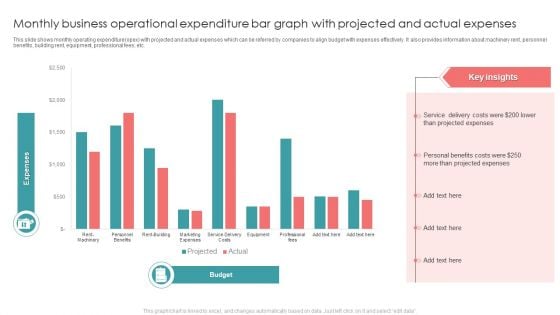
Monthly Business Operational Expenditure Bar Graph With Projected And Actual Expenses Introduction PDF
This slide shows monthly operating expenditure opex with projected and actual expenses which can be referred by companies to align budget with expenses effectively. It also provides information about machinery rent, personnel benefits, building rent, equipment, professional fees, etc. Pitch your topic with ease and precision using this Monthly Business Operational Expenditure Bar Graph With Projected And Actual Expenses Introduction PDF. This layout presents information on Projected Expenses, Costs, Service. It is also available for immediate download and adjustment. So, changes can be made in the color, design, graphics or any other component to create a unique layout.
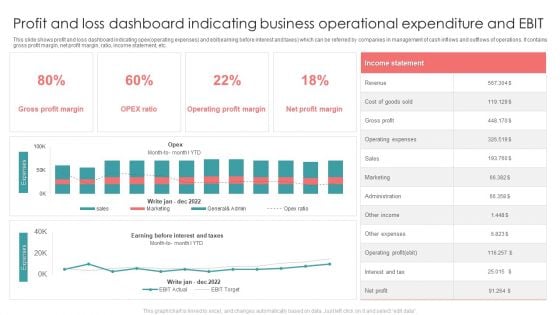
Profit And Loss Dashboard Indicating Business Operational Expenditure And EBIT Formats PDF
This slide shows profit and loss dashboard indicating opex operating expenses and ebit earning before interest and taxes which can be referred by companies in management of cash inflows and outflows of operations. It contains gross profit margin, net profit margin, ratio, income statement, etc. Showcasing this set of slides titled Profit And Loss Dashboard Indicating Business Operational Expenditure And EBIT Formats PDF. The topics addressed in these templates are Revenue, Gross Profit, Sales. All the content presented in this PPT design is completely editable. Download it and make adjustments in color, background, font etc. as per your unique business setting.
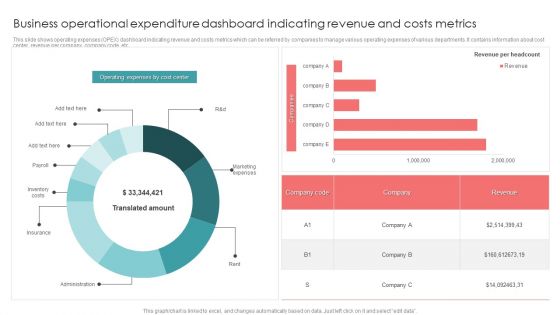
Business Operational Expenditure Dashboard Indicating Revenue And Costs Metrics Pictures PDF
This slide shows operating expenses OPEX dashboard indicating revenue and costs metrics which can be referred by companies to manage various operating expenses of various departments. It contains information about cost center, revenue per company, company code, etc. Pitch your topic with ease and precision using this Business Operational Expenditure Dashboard Indicating Revenue And Costs Metrics Pictures PDF. This layout presents information on Business Operational, Costs Metrics, Revenue. It is also available for immediate download and adjustment. So, changes can be made in the color, design, graphics or any other component to create a unique layout.

Business Revenue Bar Graph With Business Operational Expenditure Details Summary PDF
This slide represents business revenue bar graph with OPEX details which can be referred by companies to earn more revenue by controlling expenditures. It also provides information about marketing and sales, research and development, administration, total revenue, etc. Pitch your topic with ease and precision using this Business Revenue Bar Graph With Business Operational Expenditure Details Summary PDF. This layout presents information on Cost Of Marketing, Sales, Highest Amount. It is also available for immediate download and adjustment. So, changes can be made in the color, design, graphics or any other component to create a unique layout.
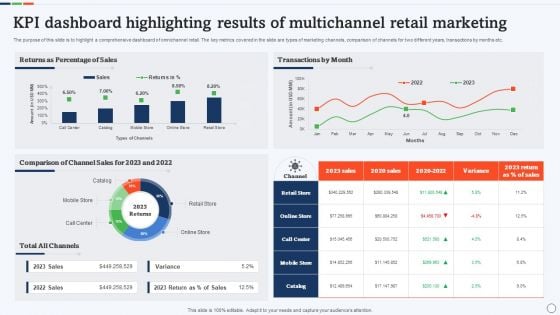
KPI Dashboard Highlighting Results Of Multichannel Retail Marketing Rules PDF
The purpose of this slide is to highlight a comprehensive dashboard of omnichannel retail. The key metrics covered in the slide are types of marketing channels, comparison of channels for two different years, transactions by months etc. Pitch your topic with ease and precision using this KPI Dashboard Highlighting Results Of Multichannel Retail Marketing Rules PDF. This layout presents information on Comparison Of Channel Sales, Percentage Of Sales, Transactions By Month. It is also available for immediate download and adjustment. So, changes can be made in the color, design, graphics or any other component to create a unique layout.
Contact Strategy Impact On Consumer Response Rate Ppt Icon Templates PDF
This slide covers positive customer insights on contact strategy. It enhances customer experience and increases the response and retention rates along with customer engagement. Pitch your topic with ease and precision using this Contact Strategy Impact On Consumer Response Rate Ppt Icon Templates PDF. This layout presents information on Customer Retention Rates, Quick Response Rate, Enhances Customer Experience. It is also available for immediate download and adjustment. So, changes can be made in the color, design, graphics or any other component to create a unique layout.
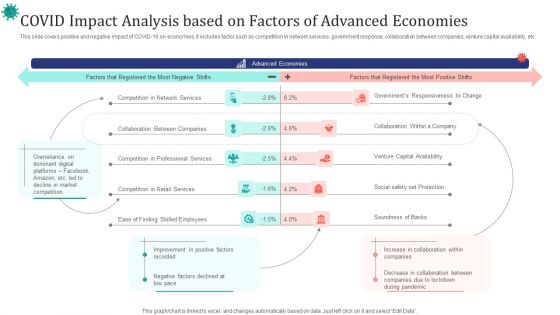
COVID Impact Analysis Based On Factors Of Advanced Economies Ppt Slides Example PDF
This slide covers positive and negative impact of COVID-19 on economies. It includes factor such as competition in network services, government response, collaboration between companies, venture capital availability, etc. Showcasing this set of slides titled COVID Impact Analysis Based On Factors Of Advanced Economies Ppt Slides Example PDF. The topics addressed in these templates are Advanced Economies, Network Services, Collaboration Between Companies. All the content presented in this PPT design is completely editable. Download it and make adjustments in color, background, font etc. as per your unique business setting.
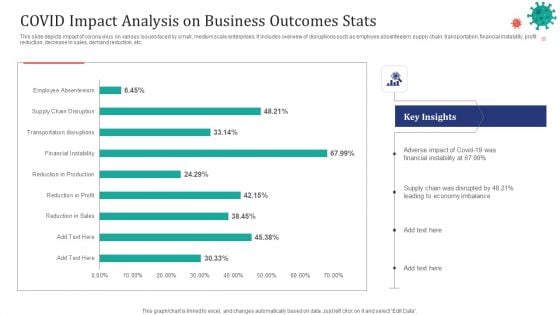
COVID Impact Analysis On Business Outcomes Stats Ppt Layouts Introduction PDF
This slide depicts impact of corona virus on various issues faced by small, medium scale enterprises. It includes overview of disruptions such as employee absenteeism, supply chain, transportation, financial instability, profit reduction, decrease in sales, demand reduction, etc. Showcasing this set of slides titled COVID Impact Analysis On Business Outcomes Stats Ppt Layouts Introduction PDF. The topics addressed in these templates are Reduction Sales, Reduction Profit, Reduction Production. All the content presented in this PPT design is completely editable. Download it and make adjustments in color, background, font etc. as per your unique business setting.
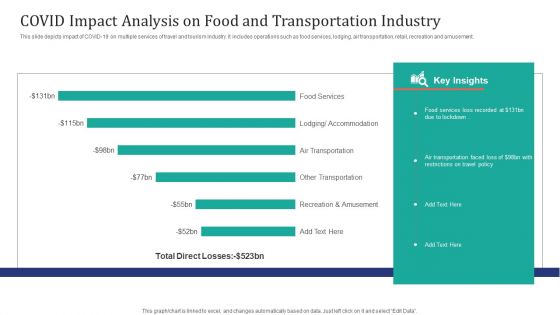
COVID Impact Analysis On Food And Transportation Industry Ppt Infographic Template Diagrams PDF
This slide depicts impact of COVID-19 on multiple services of travel and tourism industry. It includes operations such as food services, lodging, air transportation, retail, recreation and amusement. Showcasing this set of slides titled COVID Impact Analysis On Food And Transportation Industry Ppt Infographic Template Diagrams PDF. The topics addressed in these templates are Food Services, Air Transportation Faced, Restrictions Travel Policy. All the content presented in this PPT design is completely editable. Download it and make adjustments in color, background, font etc. as per your unique business setting.
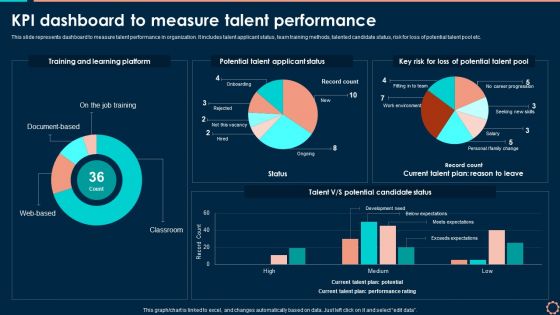
KPI Dashboard To Measure Talent Performance Slides PDF
This slide represents dashboard to measure talent performance in organization. It includes talent applicant status, team training methods, talented candidate status, risk for loss of potential talent pool etc. Get a simple yet stunning designed KPI Dashboard To Measure Talent Performance Slides PDF. It is the best one to establish the tone in your meetings. It is an excellent way to make your presentations highly effective. So, download this PPT today from Slidegeeks and see the positive impacts. Our easy to edit KPI Dashboard To Measure Talent Performance Slides PDF can be your go-to option for all upcoming conferences and meetings. So, what are you waiting for Grab this template today.
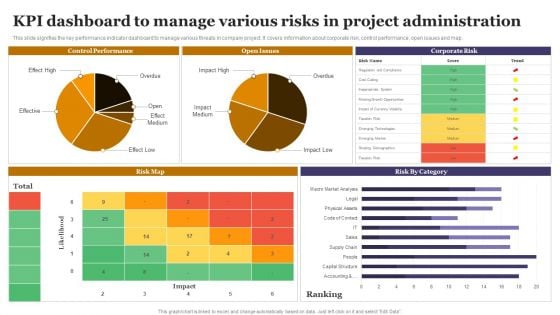
KPI Dashboard To Manage Various Risks In Project Administration Sample PDF
This slide signifies the key performance indicator dashboard to manage various threats in company project. It covers information about corporate risk, control performance, open issues and map. Showcasing this set of slides titled KPI Dashboard To Manage Various Risks In Project Administration Sample PDF. The topics addressed in these templates are Control Performance, Open Issues, Corporate Risk. All the content presented in this PPT design is completely editable. Download it and make adjustments in color, background, font etc. as per your unique business setting.
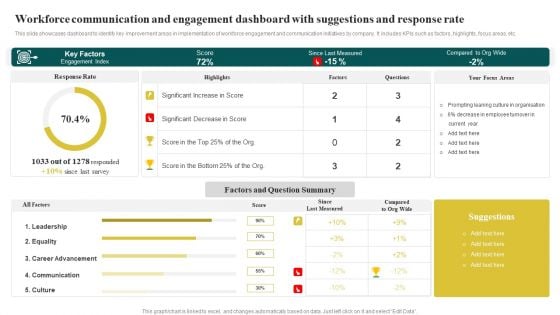
Workforce Communication And Engagement Dashboard With Suggestions And Response Rate Microsoft PDF
This slide showcases dashboard to identify key improvement areas in implementation of workforce engagement and communication initiatives by company. It includes KPIs such as factors, highlights, focus areas, etc. Pitch your topic with ease and precision using this Workforce Communication And Engagement Dashboard With Suggestions And Response Rate Microsoft PDF. This layout presents information on Key Factors, Since Last Measured, Factors And Que. It is also available for immediate download and adjustment. So, changes can be made in the color, design, graphics or any other component to create a unique layout.
Workforce Engagement And Communication Dashboard With Net Promoter Score Icons PDF
The following slide displays KPI dashboard to keep track of workforce engagement and communication at workplace to help company increase employee productivity. It includes elements such as monthly score, passive, promoters, detractors, etc. Showcasing this set of slides titled Workforce Engagement And Communication Dashboard With Net Promoter Score Icons PDF. The topics addressed in these templates are Participation Rate, Engagement Score, Overall Score. All the content presented in this PPT design is completely editable. Download it and make adjustments in color, background, font etc. as per your unique business setting.
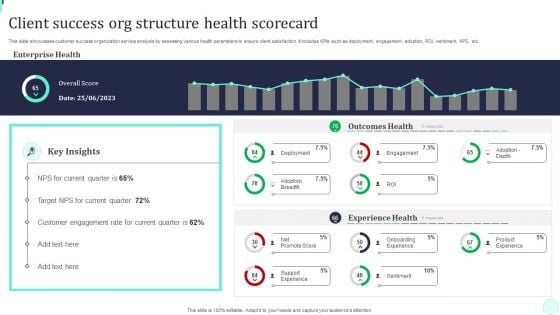
Client Success Org Structure Health Scorecard Background PDF
This slide showcases customer success organization service analysis by assessing various health parameters to ensure client satisfaction. It includes KPIs such as deployment, engagement, adoption, ROI, sentiment, NPS, etc. Showcasing this set of slides titled Client Success Org Structure Health Scorecard Background PDF. The topics addressed in these templates are Overall Score, Key Insights, Outcomes Health . All the content presented in this PPT design is completely editable. Download it and make adjustments in color, background, font etc. as per your unique business setting.
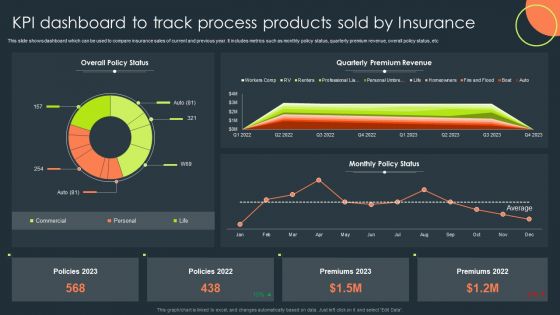
KPI Dashboard To Track Process Products Sold By Insurance Topics PDF
This slide shows dashboard which can be used to compare insurance sales of current and previous year. It includes metrics such as monthly policy status, quarterly premium revenue, overall policy status, etc. Pitch your topic with ease and precision using this KPI Dashboard To Track Process Products Sold By Insurance Topics PDF. This layout presents information on Overall Policy Status, Quarterly Premium Revenue, Monthly Policy Status. It is also available for immediate download and adjustment. So, changes can be made in the color, design, graphics or any other component to create a unique layout.
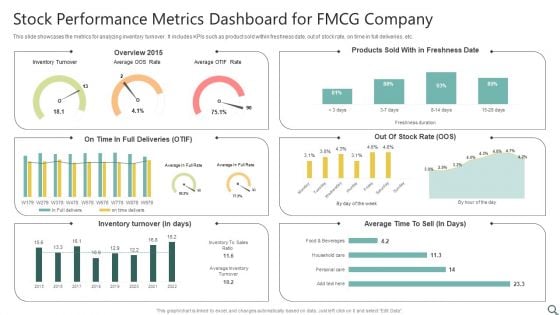
Stock Performance Metrics Dashboard For FMCG Company Ppt Ideas Design Inspiration PDF
This slide showcases the metrics for analyzing inventory turnover. It includes KPIs such as product sold within freshness date, out of stock rate, on time in full deliveries, etc. Showcasing this set of slides titled Stock Performance Metrics Dashboard For FMCG Company Ppt Ideas Design Inspiration PDF. The topics addressed in these templates are Inventory Turnover, Overview 2015, Inventory Turnover. All the content presented in this PPT design is completely editable. Download it and make adjustments in color, background, font etc. as per your unique business setting.
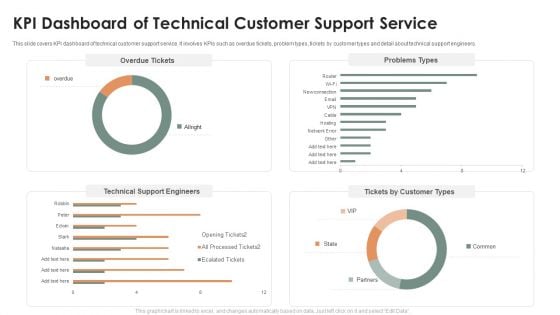
KPI Dashboard Of Technical Customer Support Service Ppt Layouts Professional PDF
This slide covers KPI dashboard of technical customer support service. It involves KPIs such as overdue tickets, problem types, tickets by customer types and detail about technical support engineers. Showcasing this set of slides titled KPI Dashboard Of Technical Customer Support Service Ppt Layouts Professional PDF. The topics addressed in these templates are Overdue Tickets, Problems Types, Technical Support Engineers. All the content presented in this PPT design is completely editable. Download it and make adjustments in color, background, font etc. as per your unique business setting.

KPI Dashboard Showing Results Of Sales And Marketing Project Campaign Formats PDF
Following slide showcases performance KPI dashboard used to evaluate marketing project campaign results. The dashboard provides overview of key metrics such as total revenue, marketing spend, profit and cost per acquisition, leads etc. Showcasing this set of slides titled KPI Dashboard Showing Results Of Sales And Marketing Project Campaign Formats PDF. The topics addressed in these templates are Marketing Spend, Revenue, Profit Per Acquisition. All the content presented in this PPT design is completely editable. Download it and make adjustments in color, background, font etc. as per your unique business setting.
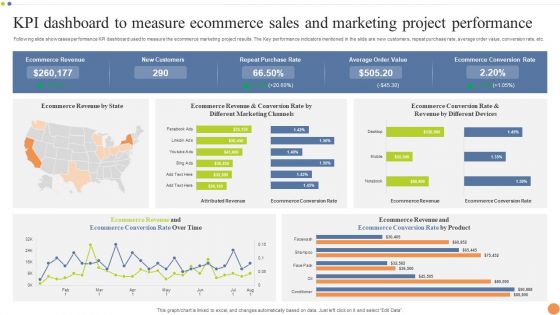
KPI Dashboard To Measure Ecommerce Sales And Marketing Project Performance Portrait PDF
Following slide showcases performance KPI dashboard used to measure the ecommerce marketing project results. The Key performance indicators mentioned in the slide are new customers, repeat purchase rate, average order value, conversion rate, etc. Pitch your topic with ease and precision using this KPI Dashboard To Measure Ecommerce Sales And Marketing Project Performance Portrait PDF. This layout presents information on Purchase Rate, Average Order Value, Ecommerce Conversion Rate. It is also available for immediate download and adjustment. So, changes can be made in the color, design, graphics or any other component to create a unique layout.
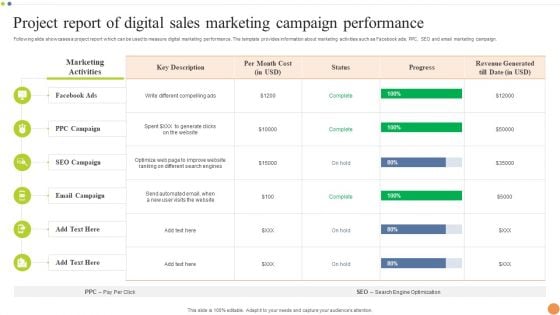
Project Report Of Digital Sales Marketing Campaign Performance Professional PDF
Following slide showcases a project report which can be used to measure digital marketing performance. The template provides information about marketing activities such as Facebook ads, PPC, SEO and email marketing campaign. Pitch your topic with ease and precision using this Project Report Of Digital Sales Marketing Campaign Performance Professional PDF. This layout presents information on Email Campaign, SEO Campaign, Marketing Activities. It is also available for immediate download and adjustment. So, changes can be made in the color, design, graphics or any other component to create a unique layout.
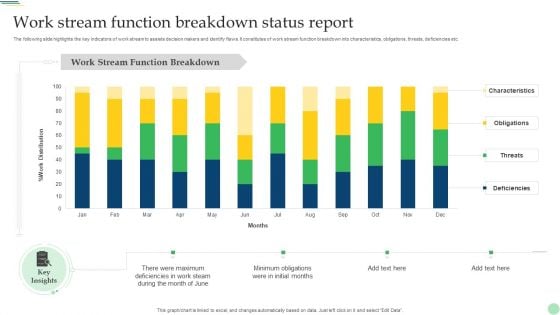
Work Stream Function Breakdown Status Report Demonstration PDF
The following slide highlights the key indicators of work stream to assists decision makers and identify flaws. It constitutes of work stream function breakdown into characteristics, obligations, threats, deficiencies etc. Pitch your topic with ease and precision using this Work Stream Function Breakdown Status Report Demonstration PDF. This layout presents information on Characteristics, Obligations, Threats, Deficiencies. It is also available for immediate download and adjustment. So, changes can be made in the color, design, graphics or any other component to create a unique layout.
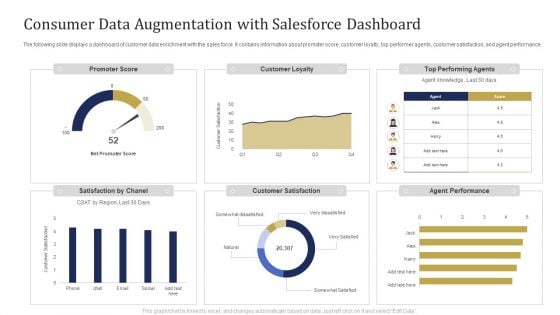
Consumer Data Augmentation With Salesforce Dashboard Ppt Pictures Portrait PDF
The following slide displays a dashboard of customer data enrichment with the sales force. It contains information about promoter score, customer loyalty, top performer agents, customer satisfaction, and agent performance. Showcasing this set of slides titled Consumer Data Augmentation With Salesforce Dashboard Ppt Pictures Portrait PDF. The topics addressed in these templates are Promoter Score, Customer Loyalty, Top Performing Agents. All the content presented in this PPT design is completely editable. Download it and make adjustments in color, background, font etc. as per your unique business setting.
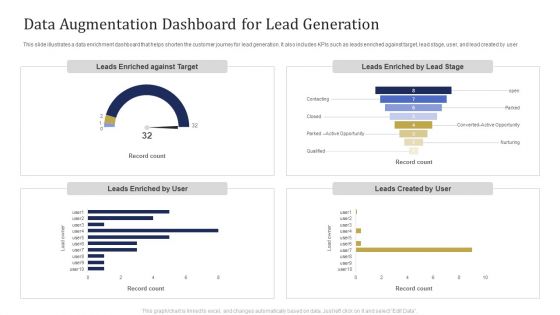
Data Augmentation Dashboard For Lead Generation Ppt Pictures Deck PDF
This slide illustrates a data enrichment dashboard that helps shorten the customer journey for lead generation. It also includes KPIs such as leads enriched against target, lead stage, user, and lead created by user. Showcasing this set of slides titled Data Augmentation Dashboard For Lead Generation Ppt Pictures Deck PDF. The topics addressed in these templates are Leads Enriched against, Target, Leads Enriched, Lead Stage, Leads Created User, Leads Enriched User. All the content presented in this PPT design is completely editable. Download it and make adjustments in color, background, font etc. as per your unique business setting.
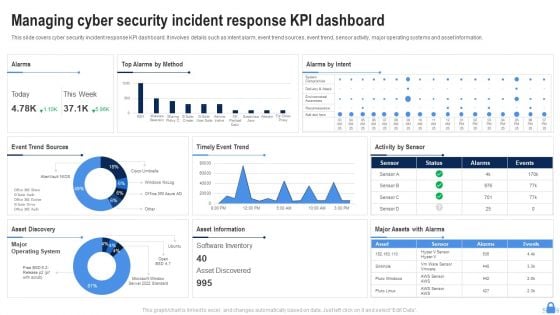
Managing Cyber Security Incident Response KPI Dashboard Ppt Layouts Shapes PDF
This slide covers cyber security incident response KPI dashboard. It involves details such as intent alarm, event trend sources, event trend, sensor activity, major operating systems and asset information. Pitch your topic with ease and precision using this Managing Cyber Security Incident Response KPI Dashboard Ppt Layouts Shapes PDF. This layout presents information on Top Alarms Method, Alarms Intent, Timely Event Trend. It is also available for immediate download and adjustment. So, changes can be made in the color, design, graphics or any other component to create a unique layout.
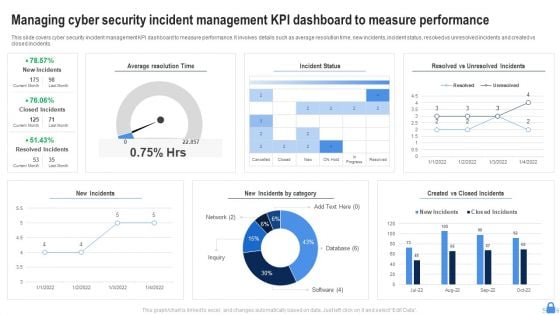
Managing Cyber Security Incident Management KPI Dashboard To Measure Performance Download PDF
This slide covers cyber security incident management KPI dashboard to measure performance. It involves details such as average resolution time, new incidents, incident status, resolved vs unresolved incidents and created vs closed incidents. Showcasing this set of slides titled Managing Cyber Security Incident Management KPI Dashboard To Measure Performance Download PDF. The topics addressed in these templates are Average Resolution Time, Incident Status, New Incidents. All the content presented in this PPT design is completely editable. Download it and make adjustments in color, background, font etc. as per your unique business setting.
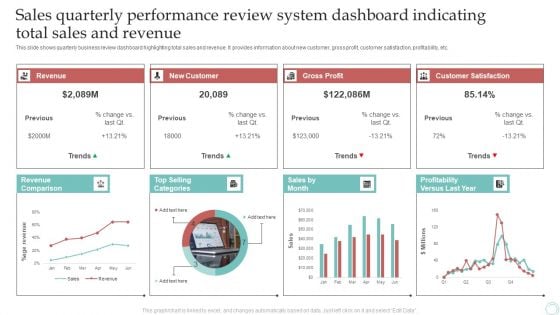
Sales Quarterly Performance Review System Dashboard Indicating Total Sales And Revenue Download PDF
This slide shows quarterly business review dashboard highlighting total sales and revenue. It provides information about new customer, gross profit, customer satisfaction, profitability, etc. Pitch your topic with ease and precision using this Sales Quarterly Performance Review System Dashboard Indicating Total Sales And Revenue Download PDF. This layout presents information on Revenue, New Customer, Gross Profit. It is also available for immediate download and adjustment. So, changes can be made in the color, design, graphics or any other component to create a unique layout.
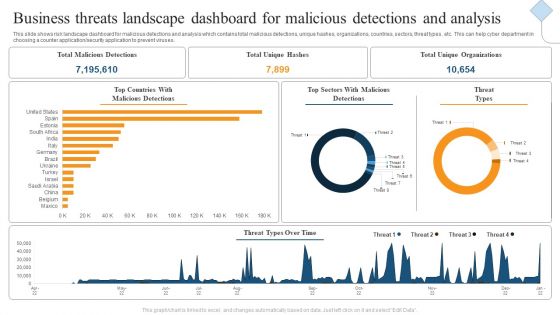
Business Threats Landscape Dashboard For Malicious Detections And Analysis Ppt Gallery Show PDF
This slide shows risk landscape dashboard for malicious detections and analysis which contains total malicious detections, unique hashes, organizations, countries, sectors, threat types, etc. This can help cyber department in choosing a counter application or security application to prevent viruses. Showcasing this set of slides titled Business Threats Landscape Dashboard For Malicious Detections And Analysis Ppt Gallery Show PDF. The topics addressed in these templates are Total Malicious Detections, Total Unique Hashes, Total Unique Organizations. All the content presented in this PPT design is completely editable. Download it and make adjustments in color, background, font etc. as per your unique business setting.
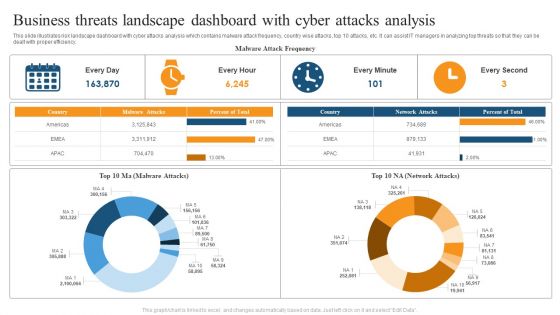
Business Threats Landscape Dashboard With Cyber Attacks Analysis Ppt Summary Brochure PDF
This slide illustrates risk landscape dashboard with cyber attacks analysis which contains malware attack frequency, country wise attacks, top 10 attacks, etc. It can assist IT managers in analyzing top threats so that they can be dealt with proper efficiency. Pitch your topic with ease and precision using this Business Threats Landscape Dashboard With Cyber Attacks Analysis Ppt Summary Brochure PDF. This layout presents information on Malware Attack Frequency, Every Minute, Every Second. It is also available for immediate download and adjustment. So, changes can be made in the color, design, graphics or any other component to create a unique layout.
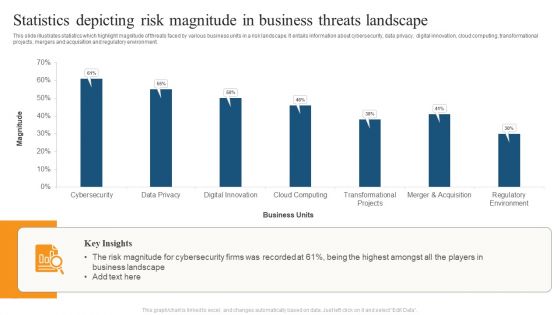
Statistics Depicting Risk Magnitude In Business Threats Landscape Ppt File Example Introduction PDF
This slide illustrates statistics which highlight magnitude of threats faced by various business units in a risk landscape. It entails information about cybersecurity, data privacy, digital innovation, cloud computing, transformational projects, mergers and acquisition and regulatory environment. Pitch your topic with ease and precision using this Statistics Depicting Risk Magnitude In Business Threats Landscape Ppt File Example Introduction PDF. This layout presents information on Business Units, Risk Magnitude, Business Landscape. It is also available for immediate download and adjustment. So, changes can be made in the color, design, graphics or any other component to create a unique layout.
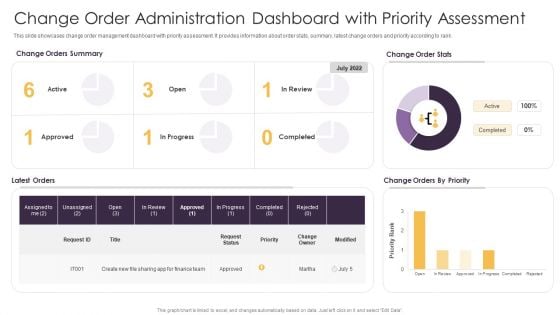
Change Order Administration Dashboard With Priority Assessment Ppt Portfolio Inspiration PDF
This slide showcases change order management dashboard with priority assessment. It provides information about order stats, summary, latest change orders and priority according to rank. Pitch your topic with ease and precision using this Change Order Administration Dashboard With Priority Assessment Ppt Portfolio Inspiration PDF. This layout presents information on Change Orders Priority, Change Order Stats, Change Orders Summary. It is also available for immediate download and adjustment. So, changes can be made in the color, design, graphics or any other component to create a unique layout.
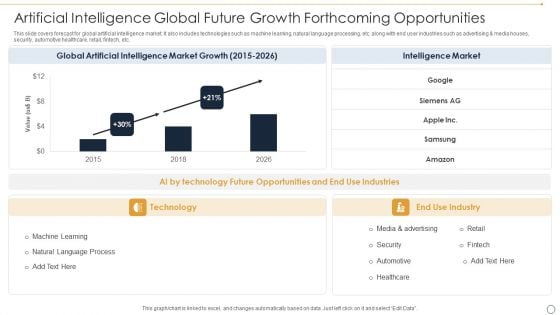
Artificial Intelligence Global Future Growth Forthcoming Opportunities Ppt Show Clipart PDF
This slide covers forecast for global artificial intelligence market. It also includes technologies such as machine learning, natural language processing, etc. along with end user industries such as advertising and media houses, security, automotive healthcare, retail, fintech, etc. Showcasing this set of slides titled Artificial Intelligence Global Future Growth Forthcoming Opportunities Ppt Show Clipart PDF. The topics addressed in these templates are Global Artificial, Intelligence Market, Growth. All the content presented in this PPT design is completely editable. Download it and make adjustments in color, background, font etc. as per your unique business setting.
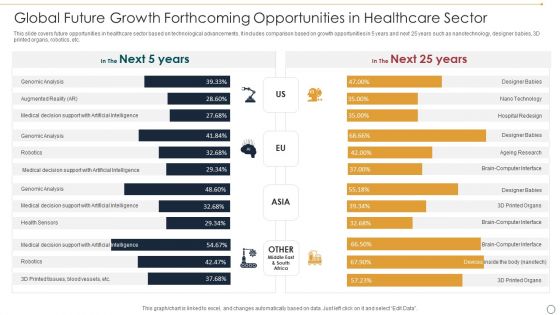
Global Future Growth Forthcoming Opportunities In Healthcare Sector Ppt Pictures Graphic Tips PDF
This slide covers future opportunities in healthcare sector based on technological advancements. It includes comparison based on growth opportunities in 5 years and next 25 years such as nanotechnology, designer babies, 3D printed organs, robotics, etc. Showcasing this set of slides titled Global Future Growth Forthcoming Opportunities In Healthcare Sector Ppt Pictures Graphic Tips PDF. The topics addressed in these templates are Genomic Analysis, Robotics, Health Sensors. All the content presented in this PPT design is completely editable. Download it and make adjustments in color, background, font etc. as per your unique business setting.
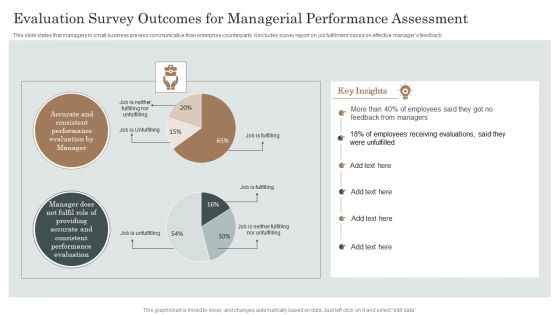
Evaluation Survey Outcomes For Managerial Performance Assessment Ppt Gallery Graphics PDF
This slide states that managers in small business are less communicative than enterprise counterparts. It includes survey report on job fulfilment based on effective managers feedback. Showcasing this set of slides titled Evaluation Survey Outcomes For Managerial Performance Assessment Ppt Gallery Graphics PDF. The topics addressed in these templates are Employees Receiving Evaluations, Feedback From Managers, Performance Evaluation. All the content presented in this PPT design is completely editable. Download it and make adjustments in color, background, font etc. as per your unique business setting.
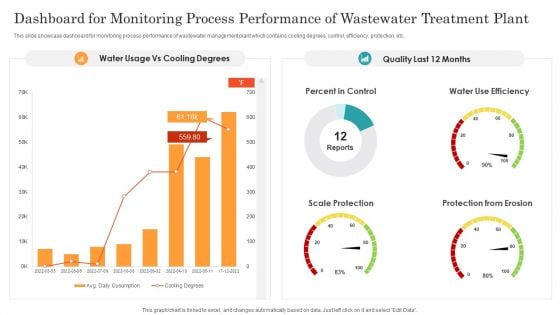
Dashboard For Monitoring Process Performance Of Wastewater Treatment Plant Ppt Infographic Template Demonstration PDF
This slide showcase dashboard for monitoring process performance of wastewater management plant which contains cooling degrees, control, efficiency, protection, etc. Showcasing this set of slides titled Dashboard For Monitoring Process Performance Of Wastewater Treatment Plant Ppt Infographic Template Demonstration PDF. The topics addressed in these templates are Percent Control, Water Use Efficiency, Scale Protection, Protection From Erosion. All the content presented in this PPT design is completely editable. Download it and make adjustments in color, background, font etc. as per your unique business setting.
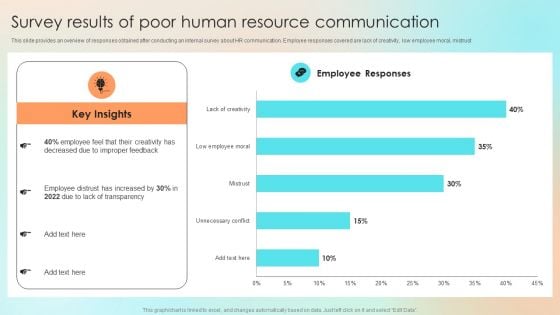
Survey Results Of Poor Human Resource Communication Diagrams PDF
This slide provides an overview of responses obtained after conducting an internal survey about HR communication. Employee responses covered are lack of creativity, low employee moral, mistrust. Get a simple yet stunning designed Survey Results Of Poor Human Resource Communication Diagrams PDF. It is the best one to establish the tone in your meetings. It is an excellent way to make your presentations highly effective. So, download this PPT today from Slidegeeks and see the positive impacts. Our easy to edit Survey Results Of Poor Human Resource Communication Diagrams PDF can be your go to option for all upcoming conferences and meetings. So, what are you waiting for Grab this template today.
Key Blocks For Project Management Dashboard Ppt Icon Tips PDF
This slide illustrates graphical representations of facts and figures related to project drivers. It includes stakeholders engagement, feedback and response rate, business units performance etc. Showcasing this set of slides titled Key Blocks For Project Management Dashboard Ppt Icon Tips PDF. The topics addressed in these templates are Stakeholders Engagement Score, Business Units Performance, Effective Communication Score. All the content presented in this PPT design is completely editable. Download it and make adjustments in color, background, font etc. as per your unique business setting.
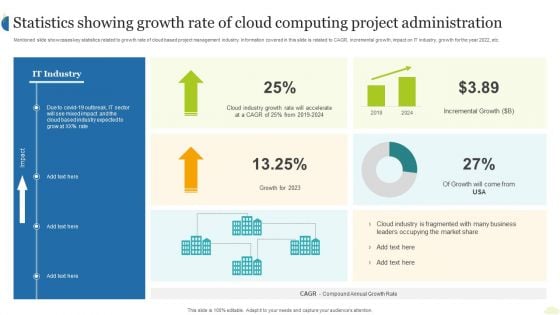
Statistics Showing Growth Rate Of Cloud Computing Project Administration Ppt Ideas Aids PDF
Mentioned slide showcases key statistics related to growth rate of cloud based project management industry. Information covered in this slide is related to CAGR, incremental growth, impact on IT industry, growth for the year 2022, etc. Showcasing this set of slides titled Statistics Showing Growth Rate Of Cloud Computing Project Administration Ppt Ideas Aids PDF. The topics addressed in these templates are IT Industry, Growth 2023, Incremental Growth. All the content presented in this PPT design is completely editable. Download it and make adjustments in color, background, font etc. as per your unique business setting.
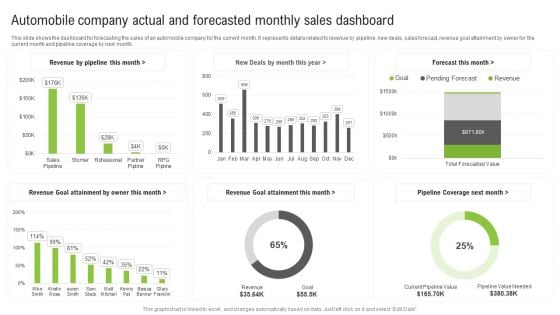
Automobile Company Actual And Forecasted Monthly Sales Dashboard Ppt Infographic Template Aids PDF
This slide shows the dashboard for forecasting the sales of an automobile company for the current month. It represents details related to revenue by pipeline, new deals, sales forecast, revenue goal attainment by owner for the current month and pipeline coverage by next month. Showcasing this set of slides titled Automobile Company Actual And Forecasted Monthly Sales Dashboard Ppt Infographic Template Aids PDF. The topics addressed in these templates are Forecast Month, Revenue Goal Attainment, Revenue Goal Attainment. All the content presented in this PPT design is completely editable. Download it and make adjustments in color, background, font etc. as per your unique business setting.
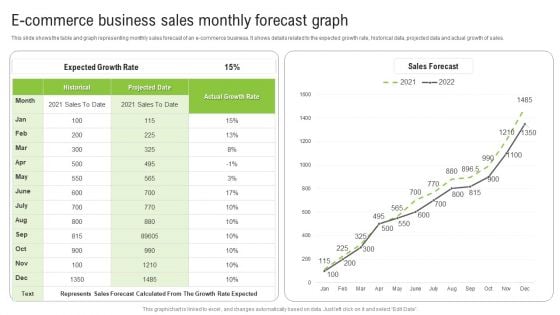
E Commerce Business Sales Monthly Forecast Graph Ppt Infographics Show PDF
This slide shows the table and graph representing monthly sales forecast of an e-commerce business. It shows details related to the expected growth rate, historical data, projected data and actual growth of sales. Pitch your topic with ease and precision using this E Commerce Business Sales Monthly Forecast Graph Ppt Infographics Show PDF. This layout presents information on Expected Growth Rate, Historical, Actual Growth Rate. It is also available for immediate download and adjustment. So, changes can be made in the color, design, graphics or any other component to create a unique layout.
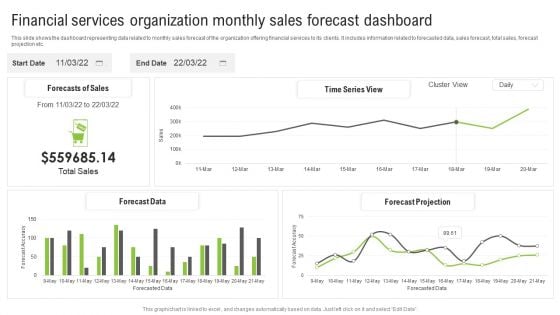
Financial Services Organization Monthly Sales Forecast Dashboard Ppt Summary Slideshow PDF
This slide shows the dashboard representing data related to monthly sales forecast of the organization offering financial services to its clients. It includes information related to forecasted data, sales forecast, total sales, forecast projection etc. Showcasing this set of slides titled Financial Services Organization Monthly Sales Forecast Dashboard Ppt Summary Slideshow PDF. The topics addressed in these templates are Forecasts Sales, Time Series View, Forecast Projection. All the content presented in this PPT design is completely editable. Download it and make adjustments in color, background, font etc. as per your unique business setting.
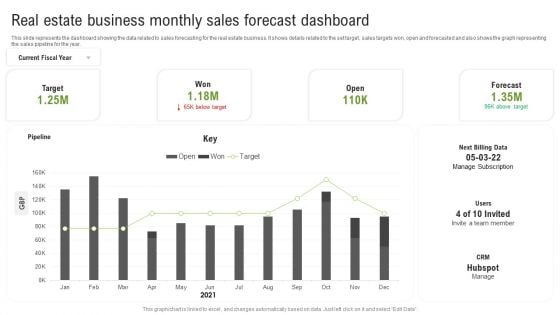
Real Estate Business Monthly Sales Forecast Dashboard Ppt Layouts Grid PDF
This slide represents the dashboard showing the data related to sales forecasting for the real estate business. It shows details related to the set target, sales targets won, open and forecasted and also shows the graph representing the sales pipeline for the year. Showcasing this set of slides titled Real Estate Business Monthly Sales Forecast Dashboard Ppt Layouts Grid PDF. The topics addressed in these templates are Next Billing Data, Pipeline, Current Fiscal Year. All the content presented in this PPT design is completely editable. Download it and make adjustments in color, background, font etc. as per your unique business setting.
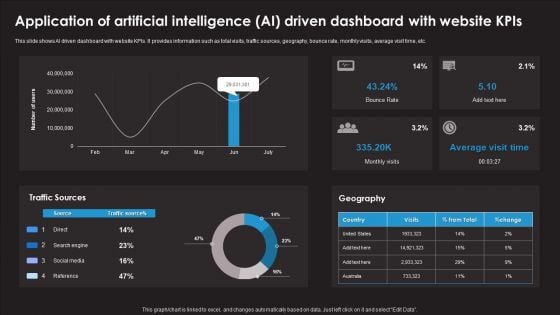
Application Of Artificial Intelligence AI Driven Dashboard With Website Kpis Formats PDF
This slide shows AI driven dashboard with website KPIs. It provides information such as total visits, traffic sources, geography, bounce rate, monthly visits, average visit time, etc. Showcasing this set of slides titled Application Of Artificial Intelligence AI Driven Dashboard With Website Kpis Formats PDF. The topics addressed in these templates are Bounce Rate, Monthly Visits, Traffic Sources. All the content presented in this PPT design is completely editable. Download it and make adjustments in color, background, font etc. as per your unique business setting.
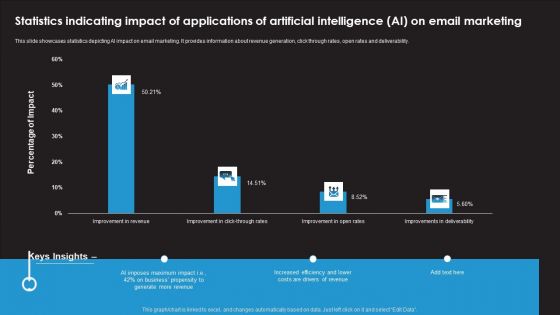
Statistics Indicating Impact Of Applications Of Artificial Intelligence AI On Email Marketing Inspiration PDF
This slide showcases statistics depicting AI impact on email marketing. It provides information about revenue generation, click through rates, open rates and deliverability. Showcasing this set of slides titled Statistics Indicating Impact Of Applications Of Artificial Intelligence AI On Email Marketing Inspiration PDF. The topics addressed in these templates are AI Imposes Maximum Impact, Business Propensity, Increased Efficiency. All the content presented in this PPT design is completely editable. Download it and make adjustments in color, background, font etc. as per your unique business setting.
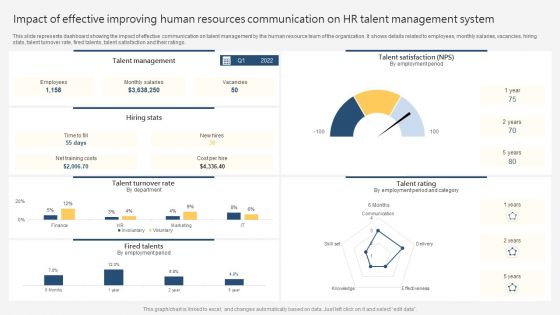
Impact Of Effective Improving Human Resources Communication On HR Talent Management System Designs PDF
This slide represents dashboard showing the impact of effective communication on talent management by the human resource team of the organization. It shows details related to employees, monthly salaries, vacancies, hiring stats, talent turnover rate, fired talents, talent satisfaction and their ratings. Showcasing this set of slides titled Impact Of Effective Improving Human Resources Communication On HR Talent Management System Designs PDF. The topics addressed in these templates are Talent Management, Talent Turnover Rate, Talent Rating. All the content presented in this PPT design is completely editable. Download it and make adjustments in color, background, font etc. as per your unique business setting.
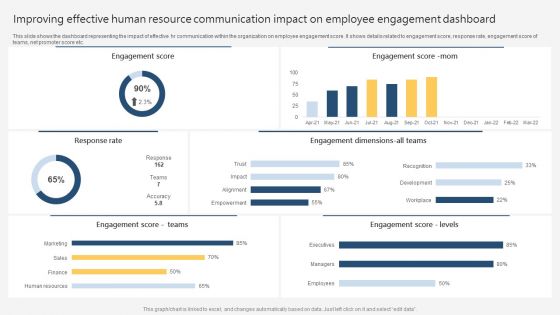
Improving Effective Human Resource Communication Impact On Employee Engagement Dashboard Slides PDF
This slide shows the dashboard representing the impact of effective hr communication within the organization on employee engagement score. It shows details related to engagement score, response rate, engagement score of teams, net promoter score etc. Pitch your topic with ease and precision using this Improving Effective Human Resource Communication Impact On Employee Engagement Dashboard Slides PDF. This layout presents information on Engagement Score, Response Rate, Engagement Score Levels. It is also available for immediate download and adjustment. So, changes can be made in the color, design, graphics or any other component to create a unique layout.

Media Of Mass Communication Marketing Campaign Assessment Dashboard Summary PDF
This slide covers mass media marketing campaign assessment KPI dashboard. It involves details such as total campaign cost, total impressions, click through rate, conversion rate and cost per click. Showcasing this set of slides titled Media Of Mass Communication Marketing Campaign Assessment Dashboard Summary PDF. The topics addressed in these templates are Total Impression, Click Through Rate, Ad Impressions, Conversions. All the content presented in this PPT design is completely editable. Download it and make adjustments in color, background, font etc. as per your unique business setting.
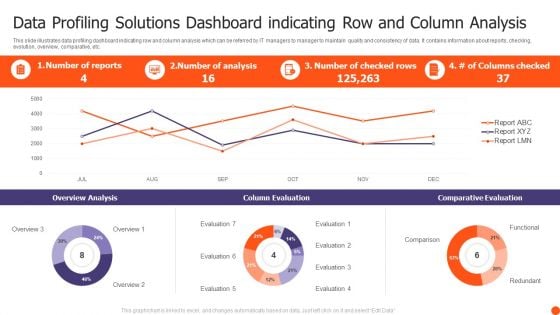
Data Profiling Solutions Dashboard Indicating Row And Column Analysis Summary PDF
This slide illustrates data profiling dashboard indicating row and column analysis which can be referred by IT managers to manager to maintain quality and consistency of data. It contains information about reports, checking, evolution, overview, comparative, etc. Showcasing this set of slides titled Data Profiling Solutions Dashboard Indicating Row And Column Analysis Summary PDF. The topics addressed in these templates are Overview Analysis, Column Evaluation, Comparative Evaluation. All the content presented in this PPT design is completely editable. Download it and make adjustments in color, background, font etc. as per your unique business setting.
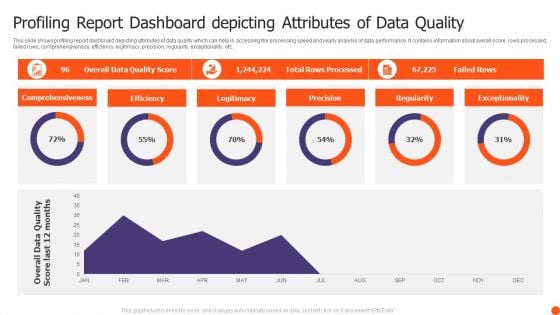
Profiling Report Dashboard Depicting Attributes Of Data Quality Themes PDF
This slide shows profiling report dashboard depicting attributes of data quality which can help in accessing the processing speed and yearly analysis of data performance. It contains information about overall score, rows processed, failed rows, comprehensiveness, efficiency, legitimacy, precision, regularity, exceptionality, etc. Pitch your topic with ease and precision using this Profiling Report Dashboard Depicting Attributes Of Data Quality Themes PDF. This layout presents information on Comprehensiveness, Efficiency, Legitimacy, Precision. It is also available for immediate download and adjustment. So, changes can be made in the color, design, graphics or any other component to create a unique layout.


 Continue with Email

 Home
Home


