Process Chart
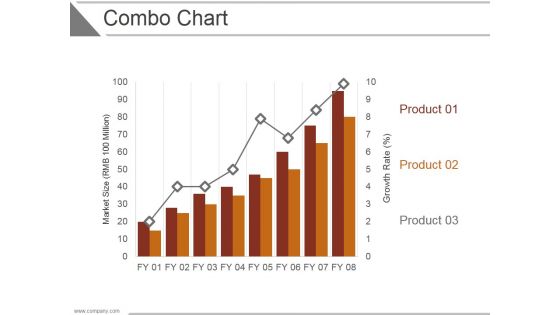
Combo Chart Ppt PowerPoint Presentation Examples
This is a combo chart ppt powerpoint presentation examples. This is a three stage process. The stages in this process are business, strategy, analysis, marketing, chart and graph, growth.
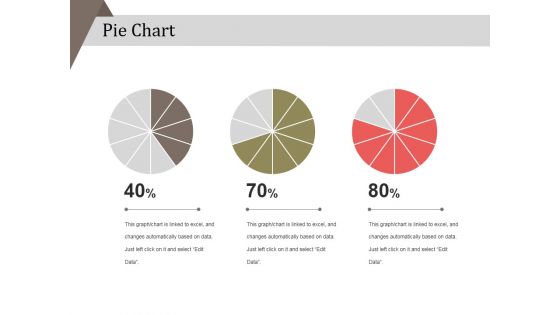
Pie Chart Ppt PowerPoint Presentation Layouts Example
This is a pie chart ppt powerpoint presentation layouts example. This is a three stage process. The stages in this process are business, strategy, analysis, pie chart, finance, marketing.
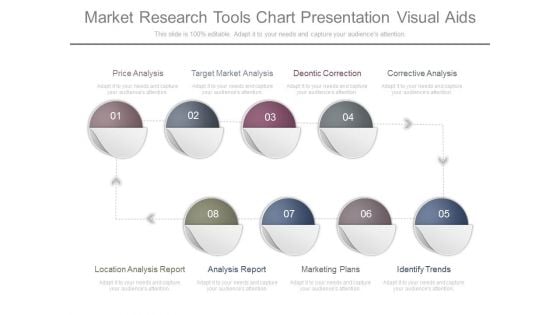
Market Research Tools Chart Presentation Visual Aids
This is a market research tools chart presentation visual aids. This is a eight stage process. The stages in this process are price analysis, target market analysis, deontic correction, corrective analysis, location analysis report, analysis report, marketing plans, identify trends.
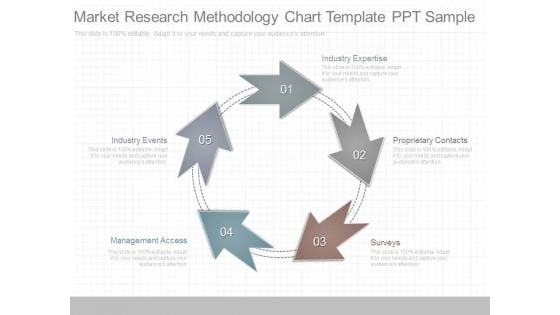
Market Research Methodology Chart Template Ppt Sample
This is a market research methodology chart template ppt sample. This is a five stage process. The stages in this process are industry expertise, proprietary contacts, surveys, industry events, management access.
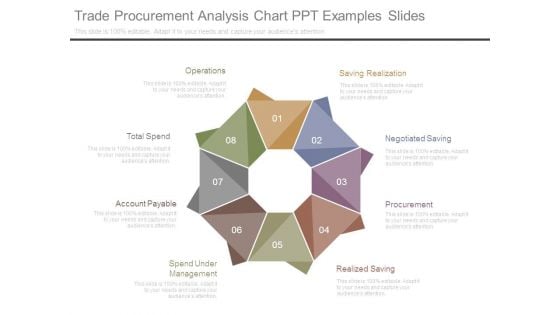
Trade Procurement Analysis Chart Ppt Examples Slides
This is a trade procurement analysis chart ppt examples slides. This is a eight stage process. The stages in this process are operations, total spend, account payable, spend under management, realized saving, procurement, negotiated saving, saving realization.
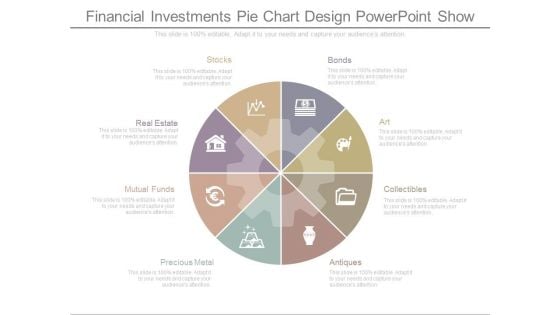
Financial Investments Pie Chart Design Powerpoint Show
This is a financial investments pie chart design powerpoint show. This is a eight stage process. The stages in this process are stocks, real estate, mutual funds, precious metal, bonds, art, collectibles, antiques.
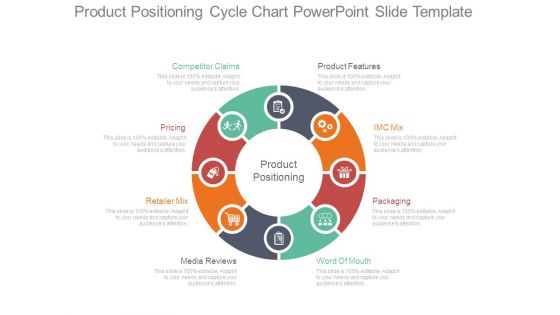
Product Positioning Cycle Chart Powerpoint Slide Template
This is a product positioning cycle chart powerpoint slide template. This is a eight stage process. The stages in this process are product features, imc mix, packaging, word of mouth, media reviews, retailer mix, pricing, competitor claims, product positioning.
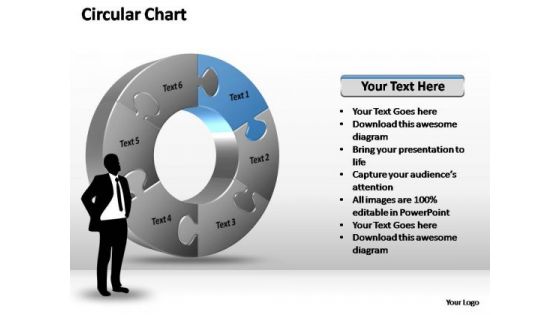
PowerPoint Themes Success Circular Chart Ppt Template
PowerPoint Themes Success Circular Chart PPT Template-Represent any circular process, business concept or idea easily with this 3D Business circular Chart.\n-PowerPoint Themes Success Circular Chart PPT Template Monitor plans with our PowerPoint Themes Success Circular Chart Ppt Template. Download without worries with our money back guaranteee.
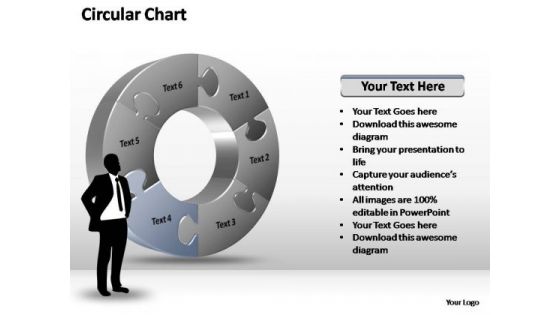
PowerPoint Templates Marketing Circular Chart Ppt Themes
PowerPoint Templates Marketing Circular Chart PPT Themes-Represent any circular process, business concept or idea easily with this 3D Business circular Chart.\n-PowerPoint Templates Marketing Circular Chart PPT Themes Make a commitment to benefit the audience. Employ our PowerPoint Templates Marketing Circular Chart Ppt Themes in empowering them.
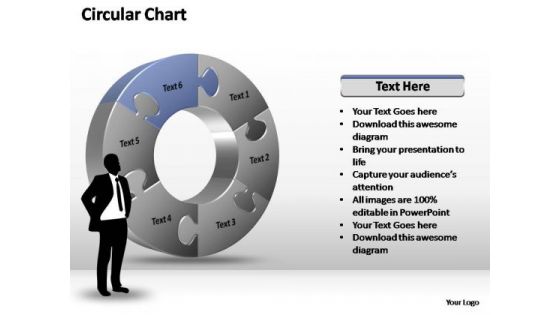
PowerPoint Templates Growth Circular Chart Ppt Themes
PowerPoint Templates Growth Circular Chart PPT Themes-Represent any circular process, business concept or idea easily with this 3D Business circular Chart.\n-PowerPoint Templates Growth Circular Chart PPT Themes Do not let fallacious arguments sway your team. Embed the facts in their minds with our PowerPoint Templates Growth Circular Chart Ppt Themes.
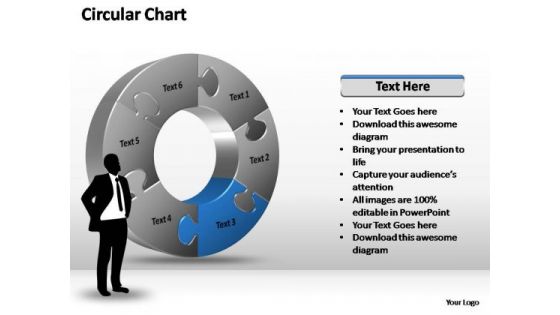
PowerPoint Templates Sale Circular Chart Ppt Themes
PowerPoint Templates Sale Circular Chart PPT Themes-Represent any circular process, business concept or idea easily with this 3D Business circular Chart.\n-PowerPoint Templates Sale Circular Chart PPT Themes Continue growing with our PowerPoint Templates Sale Circular Chart Ppt Themes. Download without worries with our money back guaranteee.
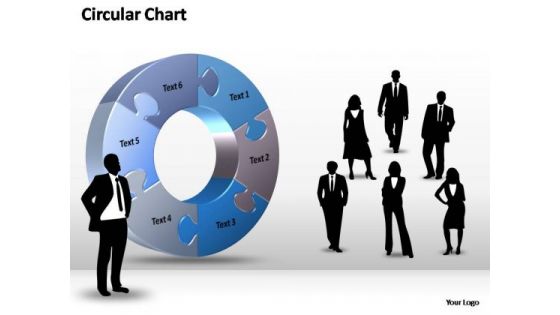
PowerPoint Templates Strategy Circular Chart Ppt Themes
PowerPoint Templates Strategy Circular Chart PPT Themes-Represent any circular process, business concept or idea easily with this 3D Business circular Chart.\n-PowerPoint Templates Strategy Circular Chart PPT Themes Get your fill of applause with our PowerPoint Templates Strategy Circular Chart Ppt Themes. The claps will just continue to come.
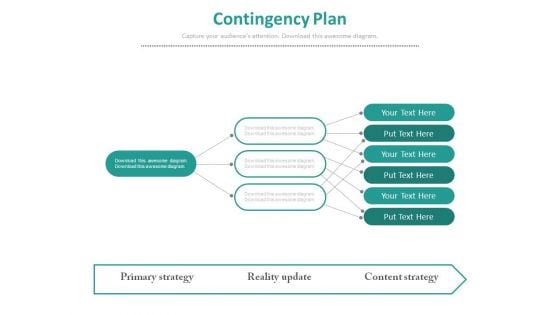
Contingency Plan Flow Chart Ppt Slides
This is a contingency plan flow chart ppt slides. This is a one stage process. The stages in this process are business, marketing.
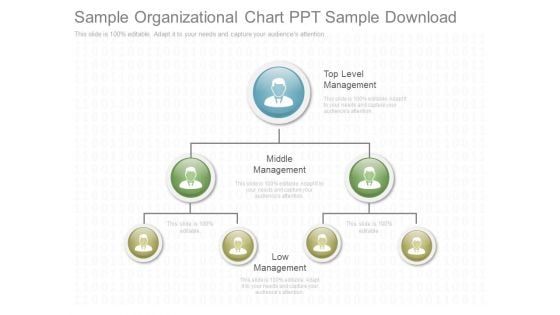
Sample Organizational Chart Ppt Sample Download
This is a sample organizational chart ppt sample download. This is a one stage process. The stages in this process are top level management, middle management, low management.
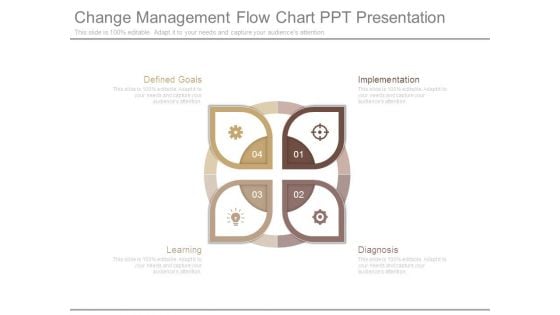
Change Management Flow Chart Ppt Presentation
This is a change management flow chart ppt presentation. This is a four stage process. The stages in this process are defined goals, implementation, diagnosis, learning.
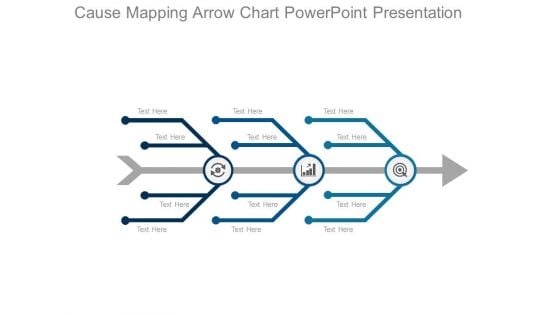
Cause Mapping Arrow Chart Powerpoint Presentation
This is a cause mapping arrow chart powerpoint presentation. This is a three stage process. The stages in this process are arrows, icons, business, marketing, management.
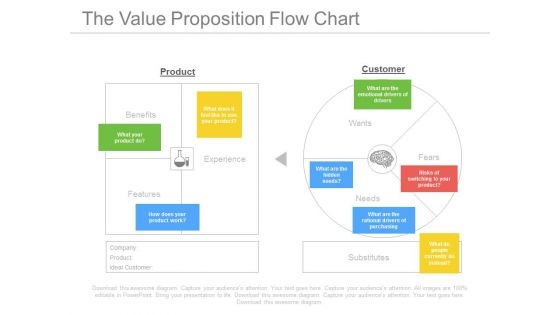
The Value Proposition Flow Chart Ppt Slides
This is a the value proposition flow chart ppt slides. This is a two stage process. The stages in this process are business, success.
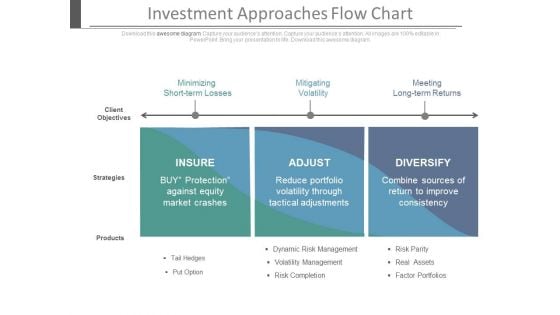
Investment Approaches Flow Chart Ppt Slides
This is an investment approached flow chart ppt slides. This is a three stage process. The stages in this process are marketing, business, success.
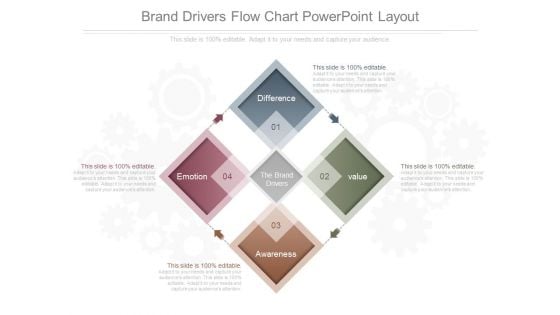
Brand Drivers Flow Chart Powerpoint Layout
This is a brand drivers flow chart powerpoint layout. This is a four stage process. The stages in this process are difference, value, awareness, emotion, the brand drivers.

Value Production Flow Chart Presentation Powerpoint
This is a value production flow chart presentation powerpoint. This is a three stage process. The stages in this process are value production, cost, revenue, profit.
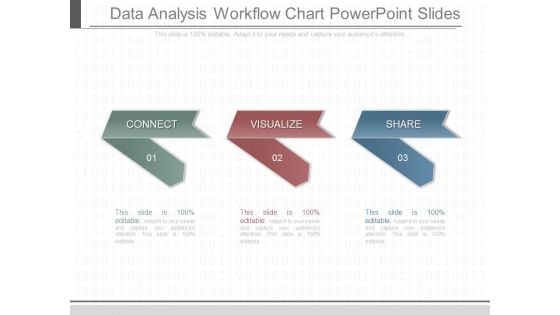
Data Analysis Workflow Chart Powerpoint Slides
This is a data analysis workflow chart powerpoint slides. This is a three stage process. The stages in this process are connect, visualize, share.
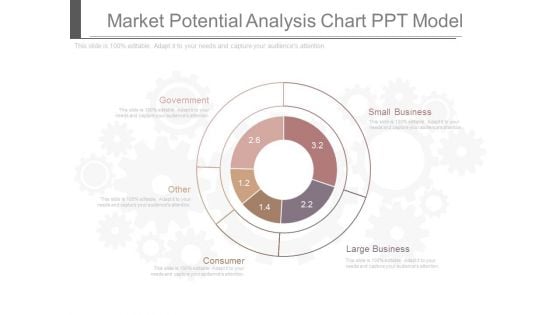
Market Potential Analysis Chart Ppt Model
This is a market potential analysis chart ppt model. This is a five stage process. The stages in this process are small business, large business, consumer, other, government.
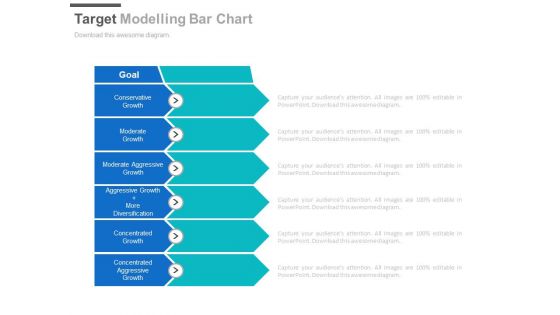
Target Modelling Bar Chart Ppt Slides
This is a target modelling bar chart ppt slides. This is a six stage process. The stages in this process are arrows, business, success.
What If Modelling Table Chart Ppt Slides
This is a what if modelling table chart ppt slides. This is a one stage process. The stages in this process are business, success, marketing.

Product Pricing List Chart Ppt Slides
This is a product pricing list chart ppt slides. This is a four stage process. The stages in this process are arrows, business, marketing.
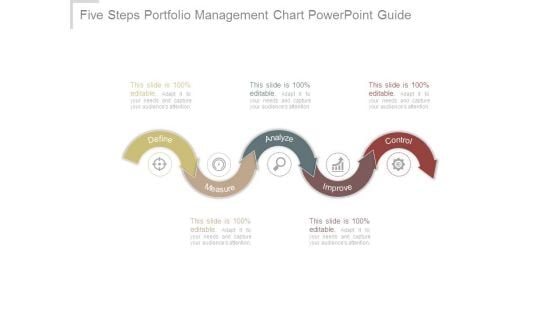
Five Steps Portfolio Management Chart Powerpoint Guide
This is a five steps portfolio management chart powerpoint guide. This is a five stage process. The stages in this process are define, measure, analyze, improve, control.
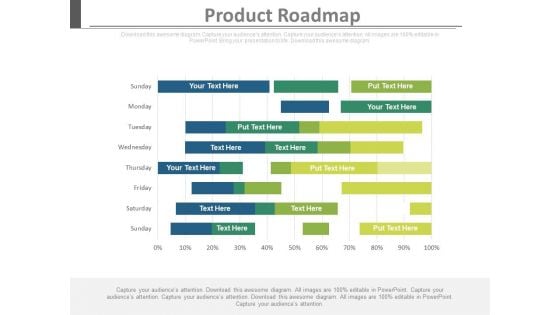
Product Roadmap Analysis Chart Ppt Slides
This is a product roadmap analysis chart ppt slides. This is a one stage process. The stages in this process are success, business, marketing.

Talent Management Consulting Arrow Chart Presentation Outline
This is a talent management consulting arrow chart presentation outline. This is a three stage process. The stages in this process are development planning, future talent, capacity enhancement.\n\n\n\n\n\n\n\n\n\n\n\n\n\n\n\n
Project Management Resource Allocation Chart Ppt Icon
This is a project management resource allocation chart ppt icon. This is a five stage process. The stages in this process are team, table, business, management, format, diagram.
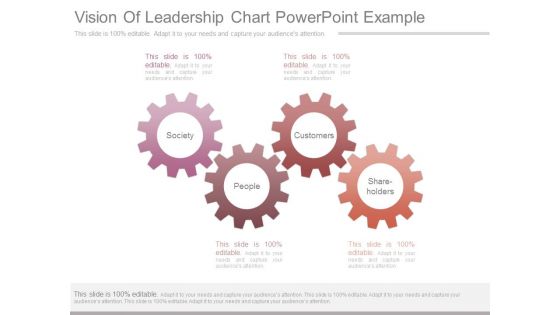
Vision Of Leadership Chart Powerpoint Example
This is a vision of leadership chart powerpoint example. This is a four stage process. The stages in this process are society, customers, people, shareholders.
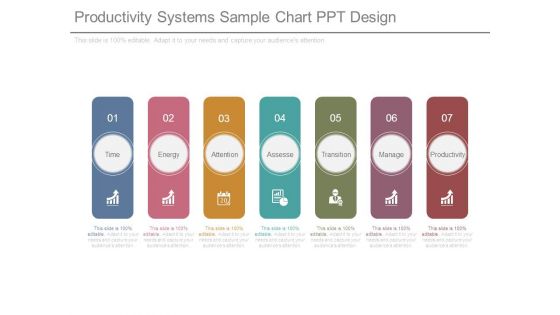
Productivity Systems Sample Chart Ppt Design
This is a productivity systems sample chart ppt design. This is a seven stage process. The stages in this process are time, energy, attention, assesse, transition, manage, productivity.
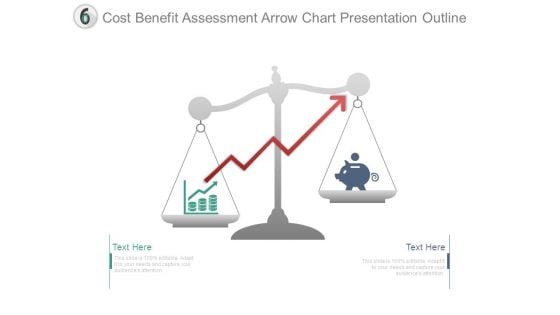
Cost Benefit Assessment Arrow Chart Presentation Outline
This is a cost benefit assessment arrow chart presentation outline. This is a two stage process. The stages in this process are compare, arrows, finance, money, strategy.
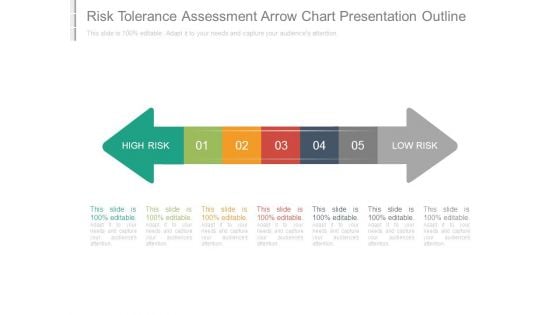
Risk Tolerance Assessment Arrow Chart Presentation Outline
This is a risk tolerance assessment arrow chart presentation outline. This is a five stage process. The stages in this process are high risk, low risk.
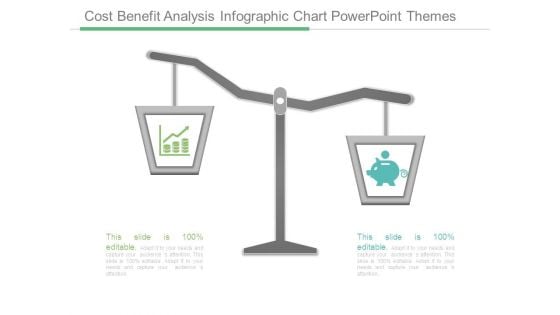
Cost Benefit Analysis Infographic Chart Powerpoint Themes
This is a cost benefit analysis infographic chart powerpoint themes. This is a two stage process. The stages in this process are balance, icons, finance, strategy, business.
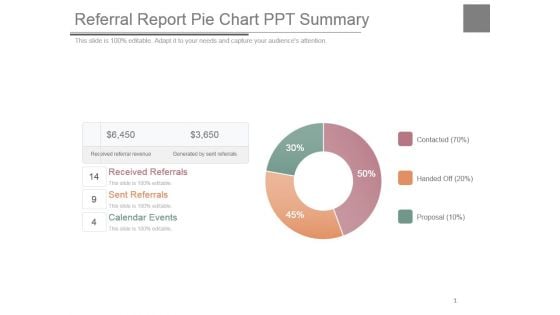
Referral Report Pie Chart Ppt Summary
This is a referral report pie chart ppt summary. This is a three stage process. The stages in this process are received referrals, sent referrals, calendar events.
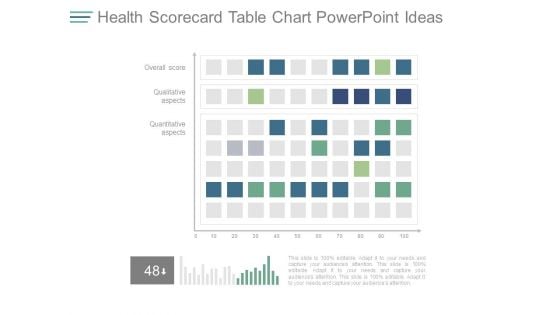
Health Scorecard Table Chart Powerpoint Ideas
This is a health scorecard table chart powerpoint ideas. This is a two stage process. The stages in this process are overall score, qualitative aspects, quantitative aspects.

Financial Analyst Growth Chart Presentation Diagrams
This is a financial analyst growth chart presentation diagrams. This is a three stage process. The stages in this process are reporting, growth, analysis.
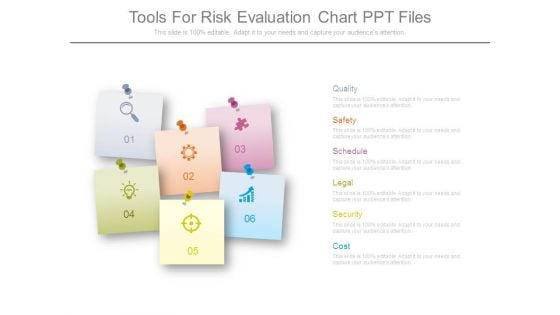
Tools For Risk Evaluation Chart Ppt Files
This is a tools for risk evaluation chart ppt files. This is a six stage process. The stages in this process are quality, safety, schedule, legal, security, cost.
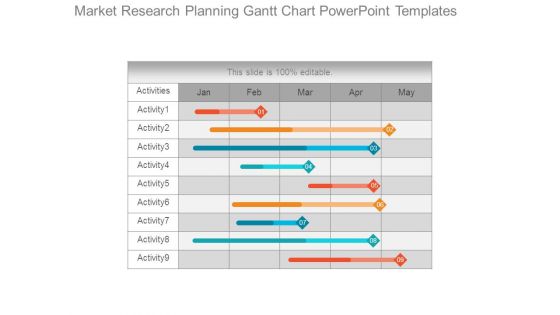
Market Research Planning Gantt Chart Powerpoint Templates
This is a market research planning gantt chart powerpoint templates. This is a five stage process. The stages in this process are jan, feb, mar, apr, may.
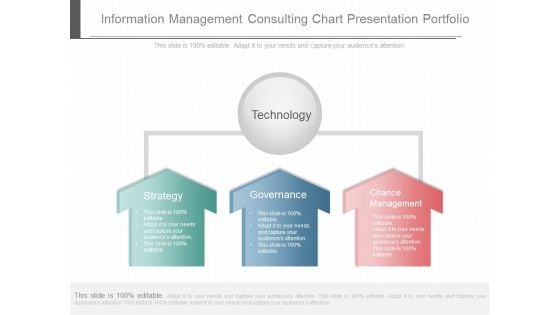
Information Management Consulting Chart Presentation Portfolio
This is a information management consulting chart presentation portfolio. This is a three stage process. The stages in this process are technology, strategy, governance, chance management.
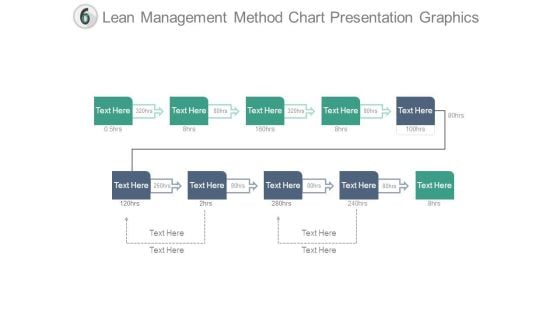
Lean Management Method Chart Presentation Graphics
This is a lean management method chart presentation graphics. This is a ten stage process. The stages in this process are management, presentation, analysis, strategy, business.
Operating Expenses Analysis Pie Chart Ppt Icon
This is a operating expenses analysis pie chart ppt icon. This is a seven stage process. The stages in this process are finance, success, business, marketing, percentage.
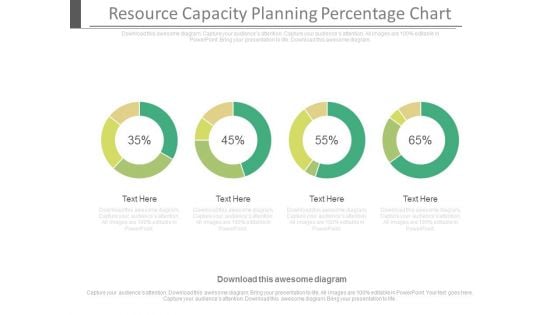
Resource Capacity Planning Percentage Chart Ppt Slides
This is a resource capacity planning percentage chart ppt slides. This is a four stage process. The stages in this process are business, finance, marketing.
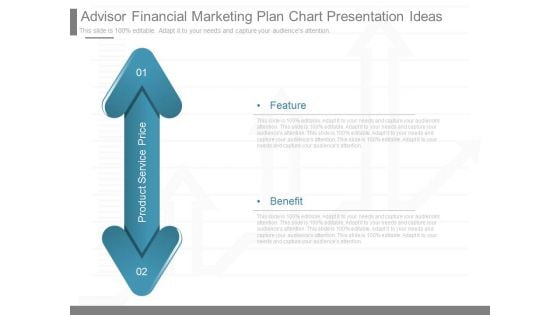
Advisor Financial Marketing Plan Chart Presentation Ideas
This is a advisor financial marketing plan chart presentation ideas. This is a two stage process. The stages in this process are product service price, feature, benefit.
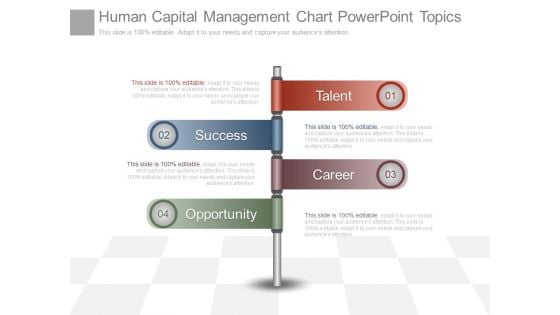
Human Capital Management Chart Powerpoint Topics
This is a human capital management chart powerpoint topics. This is a four stage process. The stages in this process are talent, success, career, opportunity.
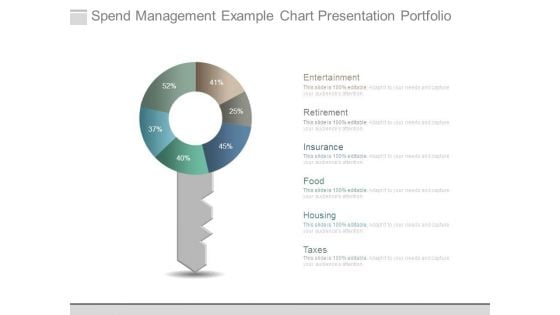
Spend Management Example Chart Presentation Portfolio
This is a spend management example chart presentation portfolio. This is a six stage process. The stages in this process are entertainment, retirement, insurance, food, housing, taxes.
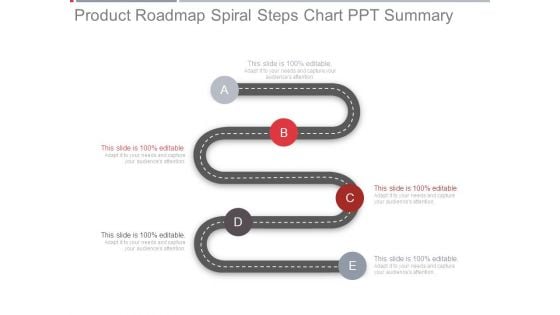
Product Roadmap Spiral Steps Chart Ppt Summary
This is a product roadmap spiral steps chart ppt summary. This is a five stage process. The stages in this process are roadmap, time planning, business, strategy, management.
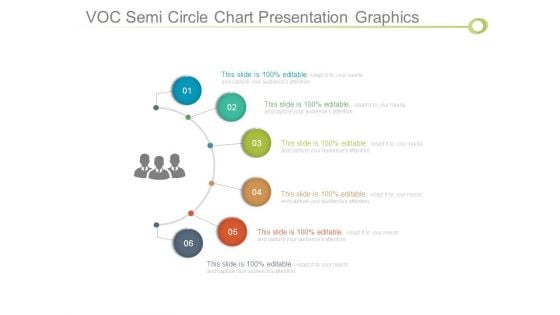
Voc Semi Circle Chart Presentation Graphics
This is a voc semi circle chart presentation graphics. This is a six stage process. The stages in this process are business, marketing, management, success, diagram.
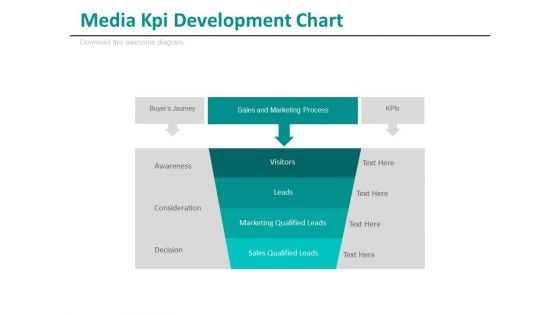
Media Kpi Development Chart Ppt Slides
This is a media KPI development chart ppt slides. This is a one stage process. The stages in this process are business, media, success.
Project Description Infographic Chart Powerpoint Templates
This is a project description infographic chart powerpoint templates. This is a three stage process. The stages in this process are icons, strategy, business, marketing, triangle.
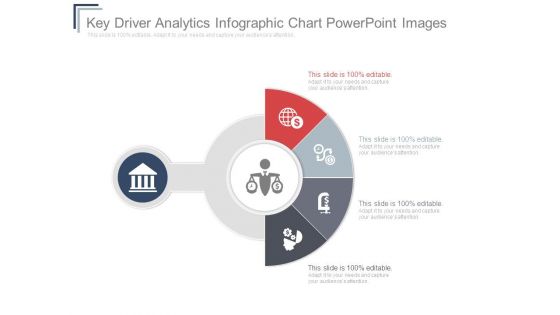
Key Driver Analytics Infographic Chart Powerpoint Images
This is a key driver analytics infographic chart powerpoint images. This is a five stage process. The stages in this process are business, marketing, semicircle, icons, strategy.
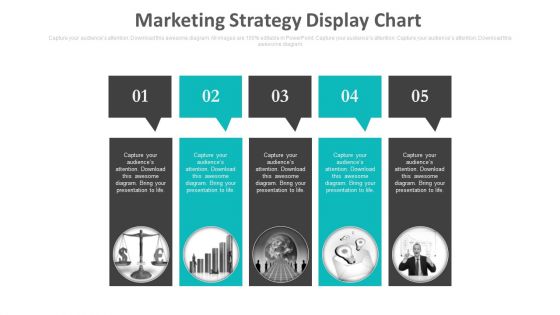
Marketing Strategy Display Chart Ppt Slides
This is a marketing strategy display chart ppt slides. This is a five stage process. The stages in this process are business, marketing, success.
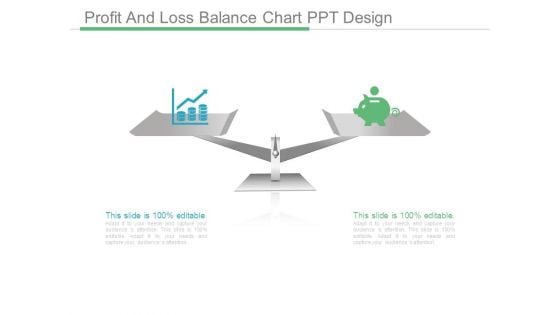
Profit And Loss Balance Chart Ppt Design
This is a profit and loss balance chart ppt design. This is a two stage process. The stages in this process are business, management, success, presentation, marketing.
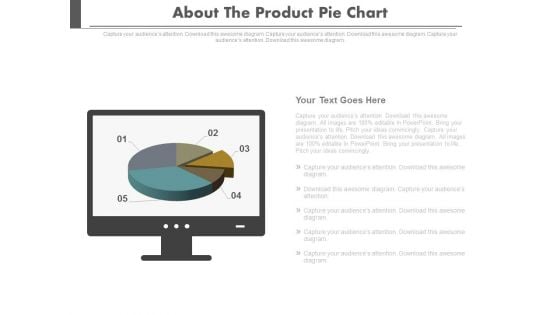
About The Product Pie Chart Ppt Slides
This is a about the product pie chart ppt slides. This is a five stage process. The stages in this process are business, success, marketing.

Geographical Segmentation Gender Ratio Chart Ppt Slides
This is a geographical segmentation gender ratio chart ppt slides. This is a one stage process. The stages in this process are global, geographical, business, success.
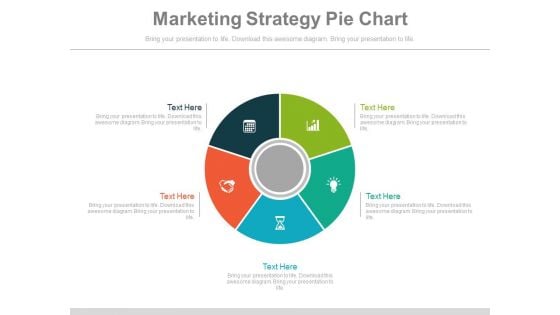
Marketing Strategy Pie Chart Ppt Slides
This is a marketing strategy pie chart ppt slides. This is a five stage process. The stages in this process are business, marketing, success.
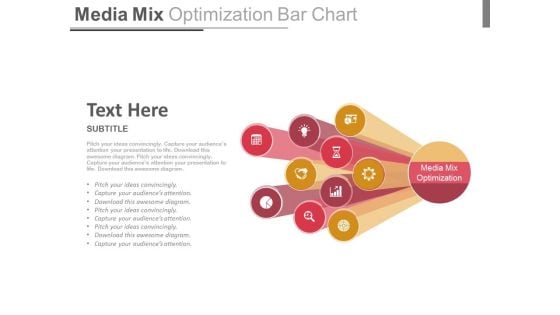
Media Mix Optimization Bar Chart Ppt Slides
This is a media mix optimization bar chart ppt slides. This is a one stage process. The stages in this process are business, media, success.

Pricing Package Tags Chart Ppt Slides
This is a pricing package tags chart ppt slides. This is a four stage process. The stages in this process are business, symbol, marketing, finance, success.
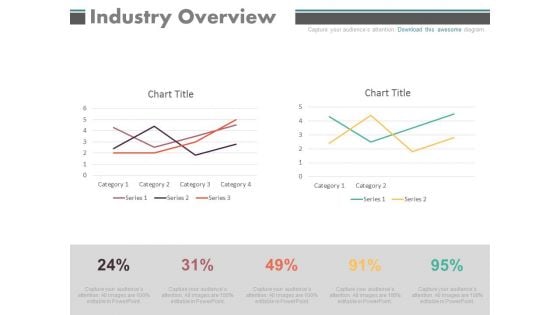
Industry Overview Percentage Chart Ppt Slides
This is a industry overview percentage chart ppt slides. This is a two stage process. The stages in this process are business, marketing.
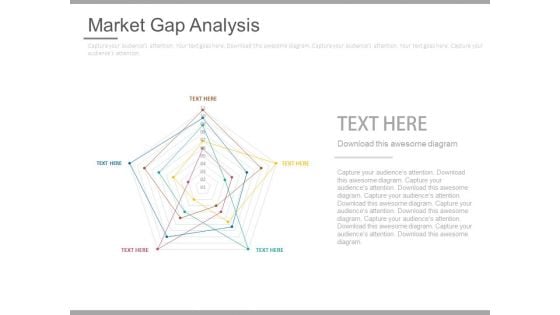
Market Gap Analysis Chart Ppt Slides
This is a market gap analysis chart ppt slides. This is a one stage process. The stages in this process are business, marketing.


 Continue with Email

 Home
Home


