Process Chart
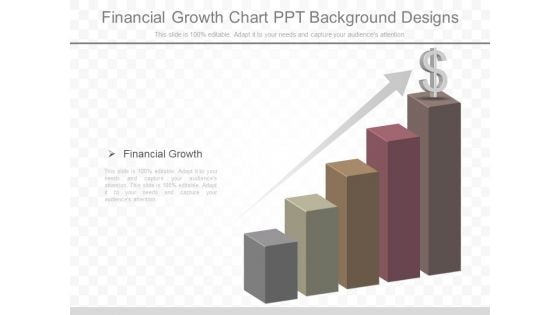
Financial Growth Chart Ppt Background Designs
This is a financial growth chart ppt background designs. This is a five stage process. The stages in this process are financial growth.\n\n\n\n\n\n\n\n\n\n\n\n\n\n\n\n\n\n
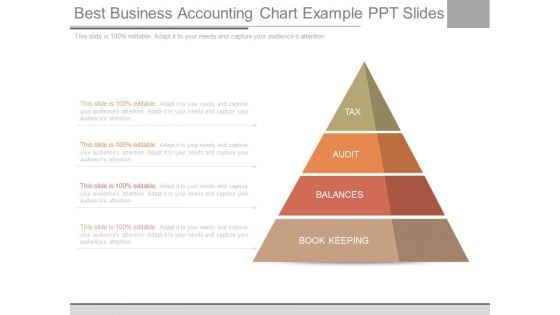
Best Business Accounting Chart Example Ppt Slides
This is a best business accounting chart example ppt slides. This is a four stage process. The stages in this process are tax, audit, balances, book keeping.
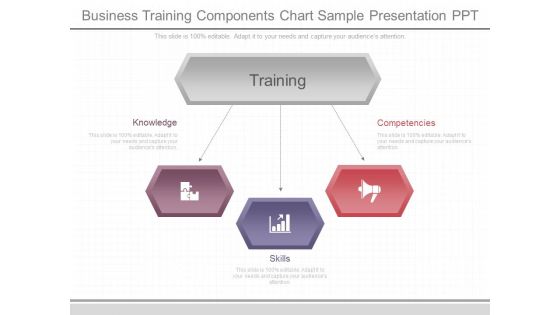
Business Training Components Chart Sample Presentation Ppt
This is a business training components chart sample presentation ppt. This is a three stage process. The stages in this process are training, knowledge, skills, competencies.
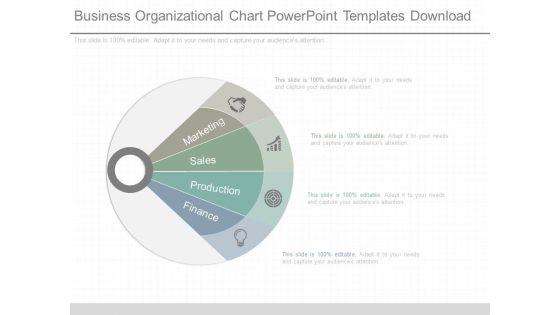
Business Organizational Chart Powerpoint Templates Download
This is a business organizational chart powerpoint templates download. This is a four stage process. The stages in this process are marketing, sales, production, finance.
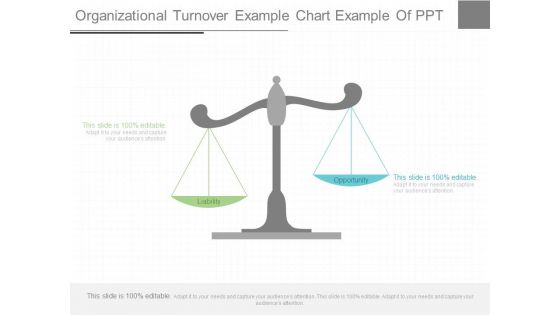
Organizational Turnover Example Chart Example Of Ppt
This is a organizational turnover example chart example of ppt. This is a two stage process. The stages in this process are liability, opportunity.
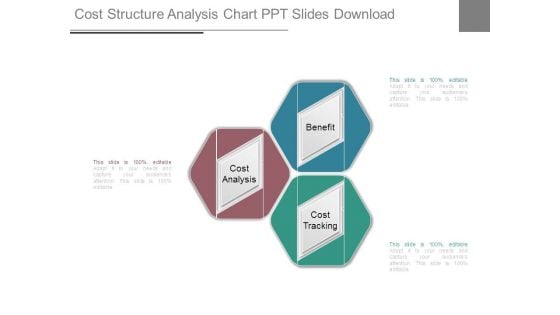
Cost Structure Analysis Chart Ppt Slides Download
This is a cost structure analysis chart ppt slides download. This is a three stage process. The stages in this process are cost analysis, benefit, cost tracking.
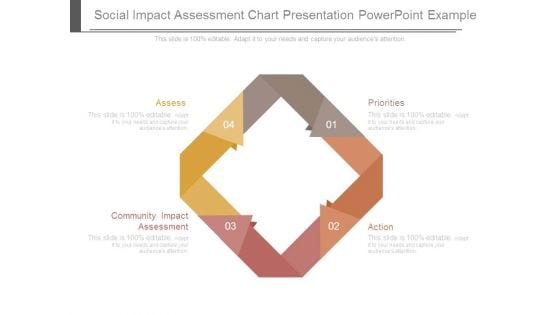
Social Impact Assessment Chart Presentation Powerpoint Example
This is a social impact assessment chart presentation powerpoint example. This is a four stage process. The stages in this process are assess, community impact assessment, priorities, action.
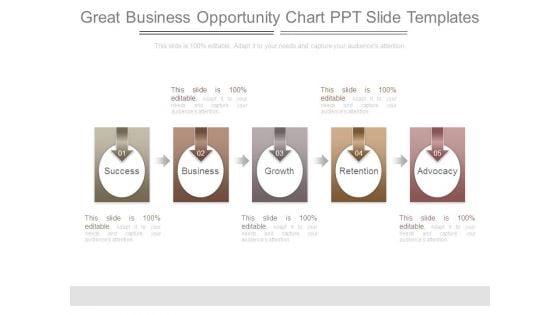
Great Business Opportunity Chart Ppt Slide Templates
This is a great business opportunity chart ppt slide templates. This is a five stage process. The stages in this process are success, business, growth, retention, advocacy.
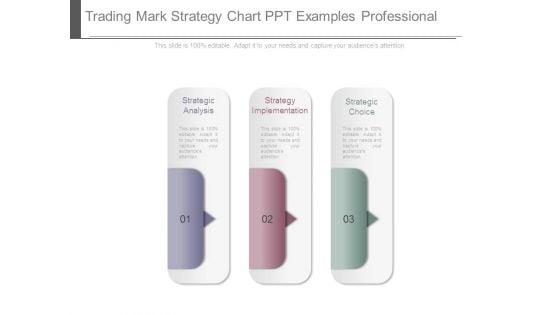
Trading Mark Strategy Chart Ppt Examples Professional
This is a trading mark strategy chart ppt examples professional. This is a three stage process. The stages in this process are strategic analysis, strategy implementation, strategic choice.
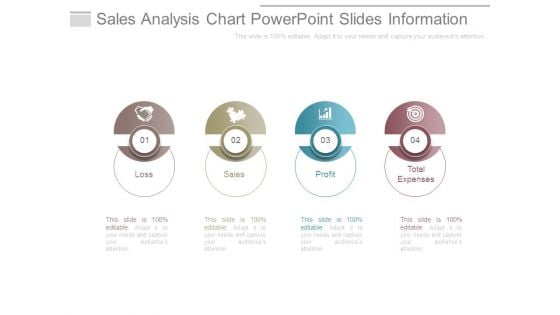
Sales Analysis Chart Powerpoint Slides Information
This is a sales analysis chart powerpoint slides information. This is a four stage process. The stages in this process are loss, sales, profit, total expenses.
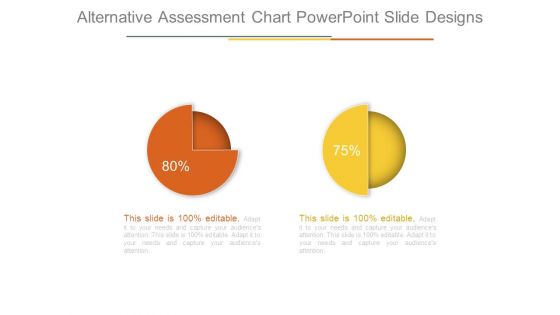
Alternative Assessment Chart Powerpoint Slide Designs
This is a alternative assessment chart powerpoint slide designs. This is a two stage process. The stages in this process are business, marketing, percentage, finance, success.
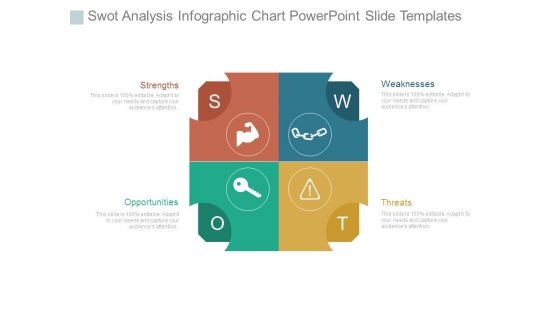
Swot Analysis Infographic Chart Powerpoint Slide Templates
This is a swot analysis infographic chart powerpoint slide templates. This is a four stage process. The stages in this process are strengths, opportunities, threats, weaknesses.
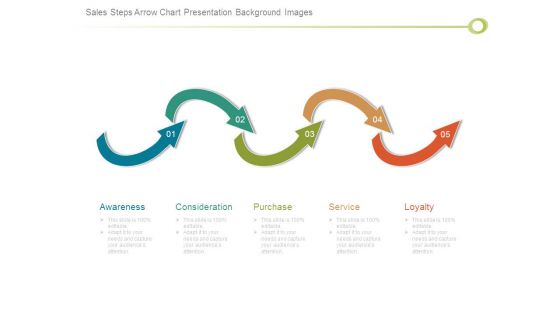
Sales Steps Arrow Chart Presentation Background Images
This is a sales steps arrow chart presentation background images. This is a five stage process. The stages in this process are awareness, consideration, purchase, service, loyalty.

Possible Solutions Puzzle Chart Good Ppt Example
This is a possible solutions puzzle chart good ppt example. This is a nine stage process. The stages in this process are solution, puzzle, key, strategy, game, marketing.
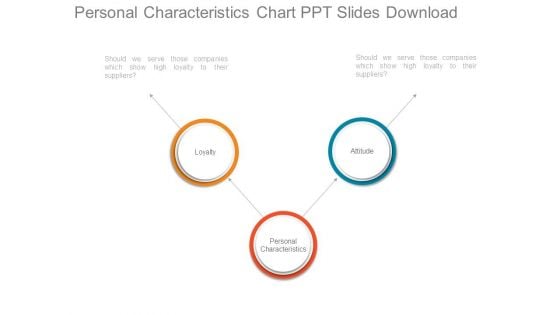
Personal Characteristics Chart Ppt Slides Download
This is a personal characteristics chart ppt slides download. This is a two stage process. The stages in this process are loyalty, attitude, personal characteristics.
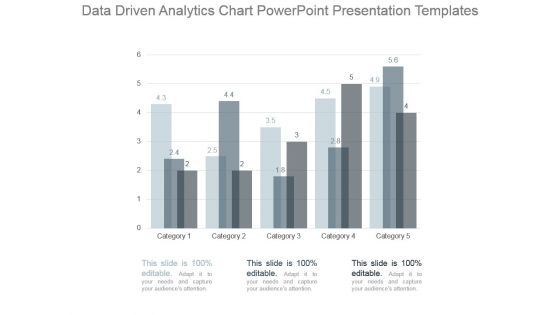
Data Driven Analytics Chart Powerpoint Presentation Templates
This is a data driven analytics chart powerpoint presentation templates. This is a five stage process. The stages in this process are category.
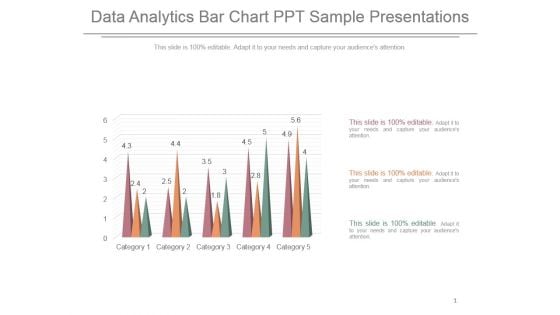
Data Analytics Bar Chart Ppt Sample Presentations
This is a data analytics bar chart ppt sample presentations. This is a five stage process. The stages in this process are category.
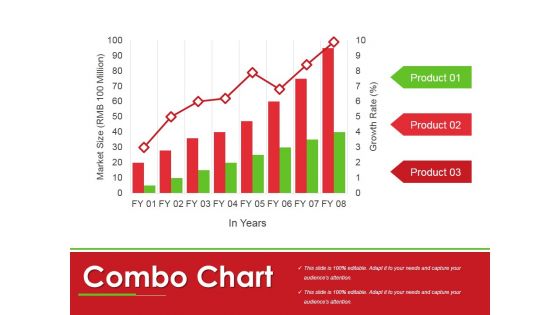
Combo Chart Ppt PowerPoint Presentation Portfolio Themes
This is a combo chart ppt powerpoint presentation portfolio themes. This is a three stage process. The stages in this process are market size, product, management, finance, chart, marketing.
Bubble Chart Ppt PowerPoint Presentation Icon Slides
This is a bubble chart ppt powerpoint presentation icon slides. This is a three stage process. The stages in this process are product, finance, business, marketing, bubble chart .
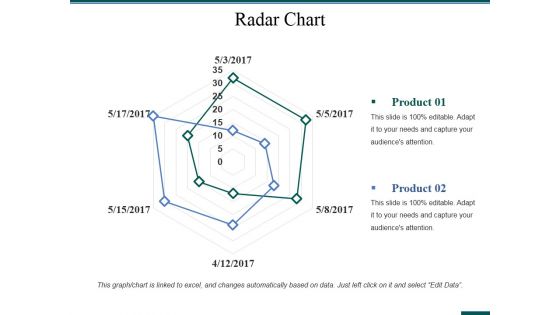
Radar Chart Ppt PowerPoint Presentation Layouts Gallery
This is a radar chart ppt powerpoint presentation layouts gallery. This is a two stage process. The stages in this process are business, analysis, strategy, marketing, radar chart, finance.
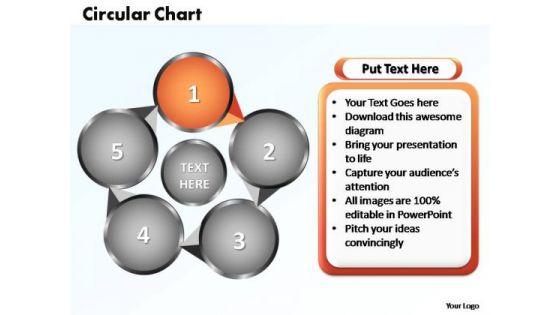
PowerPoint Templates Circular Flow Chart Ppt Theme
Flowchart is a simple mapping tool that shows the sequence of actions within a process. Flowchart is widely used in business, education and economic presentations to help the audience visualize the content better, or to find flaws in a process. Institute efficiency with our PowerPoint Templates Circular Flow Chart Ppt Theme. Download without worries with our money back guaranteee.
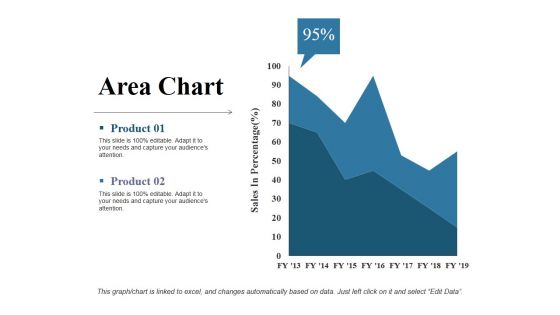
Area Chart Ppt PowerPoint Presentation Slides Example
This is a area chart ppt powerpoint presentation slides example. This is a two stage process. The stages in this process are sales in percentage, product, area chart, business, finance.
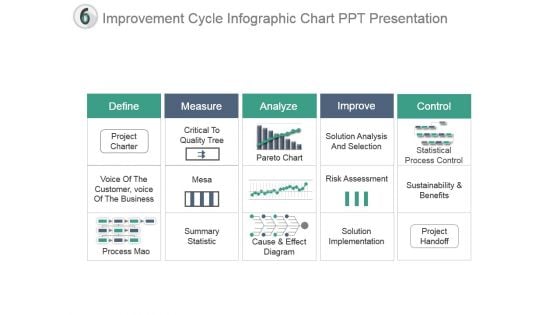
Improvement Cycle Infographic Chart Ppt Presentation
This is a improvement cycle infographic chart ppt presentation. This is a five stage process. The stages in this process are define, measure, analyze, improve, control, project charter, critical to quality tree, process mao, summary statistic, mesa, pareto chart, cause and effect diagram, solution analysis and selection, risk assessment, solution implementation, sustainability and benefits, project handoff, statistical process control, voice of the customer, voice of the business.
Bar Chart Ppt PowerPoint Presentation Icon Layout
This is a bar chart ppt powerpoint presentation icon layout. This is a one stage process. The stages in this process are sales in percentage, financial years, bar chart, finance, marketing.
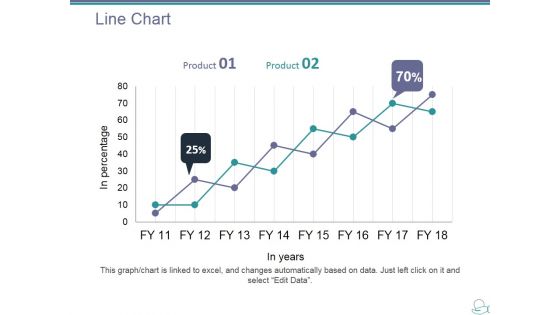
Line Chart Ppt PowerPoint Presentation Layouts Show
This is a line chart ppt powerpoint presentation layouts show. This is a two stage process. The stages in this process are product, in years, in percentage, line chart, growth.
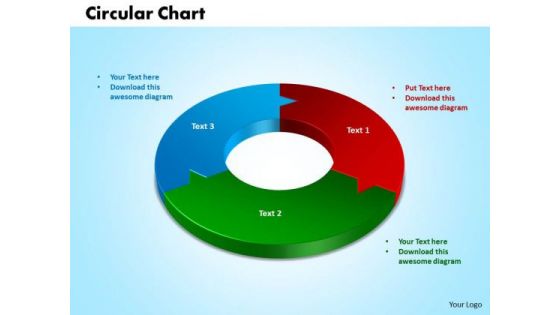
PowerPoint Layout Circular Chart Company Ppt Theme
PowerPoint Layout circular chart Company PPT Theme-This PowerPoint Layout Circular chart can be customized and can strengthen your company's corporate design.-Access, arrow, background, banner, bright, business, chart, circle, colorful, conceptual, connection, corporate, creative, cycle, design, different, element, form, frame, graphic, idea, illustration, match, order, part, piece, process, shapes, solution, strategy, symbol, template, website-PowerPoint Layout circular chart Company PPT Theme Our PowerPoint Layout Circular Chart Company Ppt Theme will ensure you get your point across. You will be glad you tried us out.
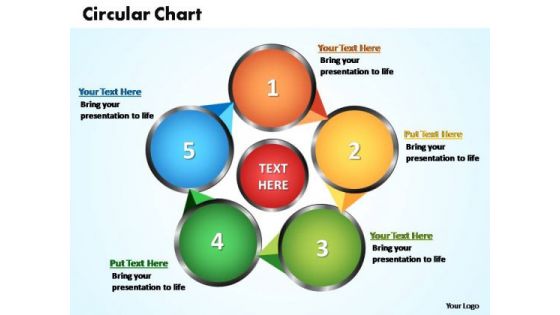
PowerPoint Templates Circular Flow Chart Ppt Themes
Flowchart is a simple mapping tool that shows the sequence of actions within a process. Flowchart is widely used in business, education and economic presentations to help the audience visualize the content better, or to find flaws in a process. Create the appetite with our PowerPoint Templates Circular Flow Chart Ppt Themes. Entice them with your thoughts.
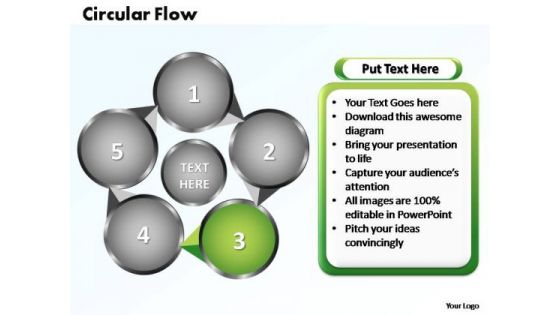
PowerPoint Templates Circular Flow Chart Ppt Design
Flowchart is a simple mapping tool that shows the sequence of actions within a process. Flowchart is widely used in business, education and economic presentations to help the audience visualize the content better, or to find flaws in a process. Explore all avenues with our PowerPoint Templates Circular Flow Chart Ppt Design. They really do cover the compass.
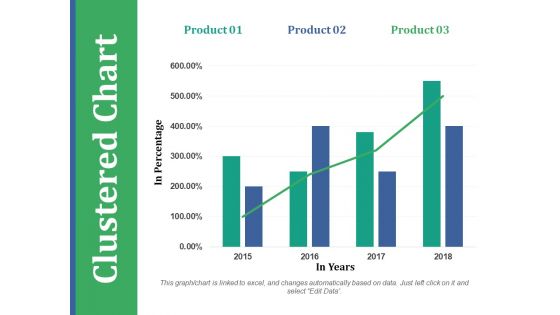
Clustered Chart Ppt PowerPoint Presentation Outline Templates
This is a clustered chart ppt powerpoint presentation outline templates. This is a three stage process. The stages in this process are product, in percentage, in years, clustered chart.
Area Chart Ppt PowerPoint Presentation Icon Show
This is a area chart ppt powerpoint presentation icon show. This is a two stage process. The stages in this process are product, financial year, in percentage, area chart.
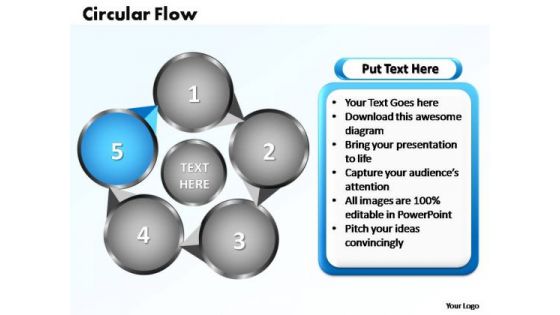
PowerPoint Templates Circular Flow Chart Ppt Slide
Flowchart is a simple mapping tool that shows the sequence of actions within a process. Flowchart is widely used in business, education and economic presentations to help the audience visualize the content better, or to find flaws in a process. Honest effort always shows through. Our PowerPoint Templates Circular Flow Chart Ppt Slide are a good example.
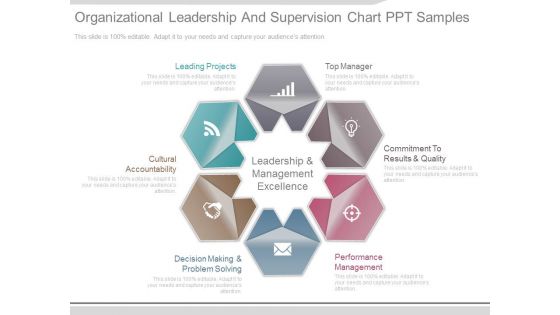
Organizational Leadership And Supervision Chart Ppt Samples
This is a organizational leadership and supervision chart ppt samples. This is a six stage process. The stages in this process are leading projects, top manager, commitment to results and quality, performance management, decision making and problem solving, cultural accountability, leadership and management excellence.
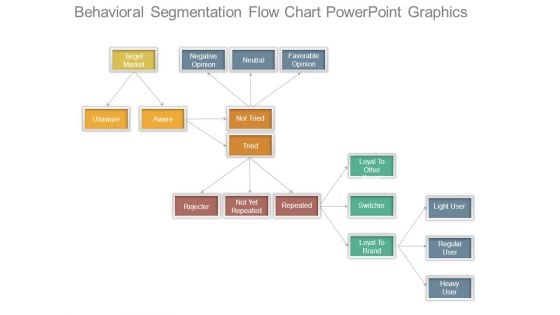
Behavioral Segmentation Flow Chart Powerpoint Graphics
This is a behavioral segmentation flow chart powerpoint graphics. This is a six stage process. The stages in this process are target market, negative opinion, neutral, favorable opinion, unaware, aware, not tried, rejecter, not yet repeated, loyal to other brand, switcher, light user, regular user.
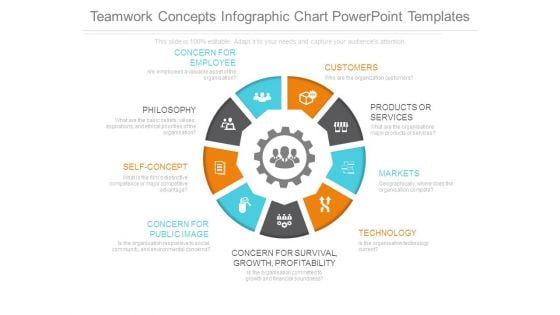
Teamwork Concepts Infographic Chart Powerpoint Templates
This is a teamwork concepts infographic chart powerpoint templates. This is a nine stage process. The stages in this process are concern for survival growth profitability, concern for employee, customers, products or services, markets, technology, concern for public image, self concept, philosophy.
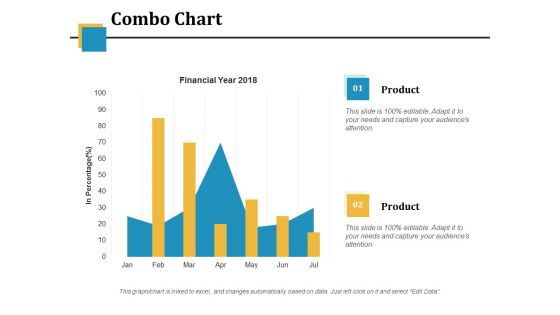
Combo Chart Ppt PowerPoint Presentation Model Vector
This is a combo chart ppt powerpoint presentation model vector. This is a two stage process. The stages in this process are financial year, in percentage, business, marketing, combo chart.
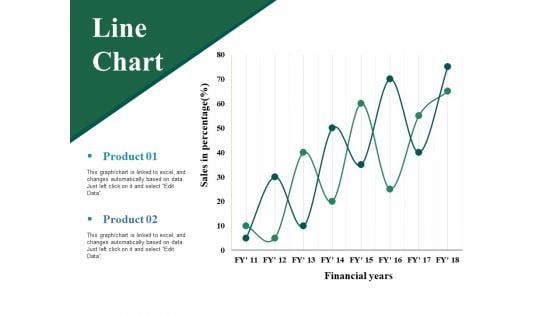
Line Chart Ppt PowerPoint Presentation Professional Grid
This is a line chart ppt powerpoint presentation professional grid. This is a two stage process. The stages in this process are sales in percentage, financial years, product, line chart.
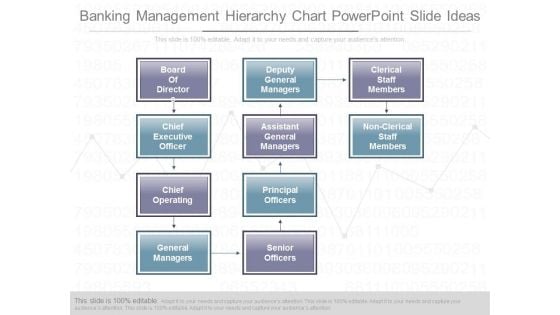
Banking Management Hierarchy Chart Powerpoint Slide Ideas
This is a banking management hierarchy chart powerpoint slide ideas. This is a three stage process. The stages in this process are board of directors, chief executive officer, chief operating, general managers, deputy general managers, assistant general managers, principal officers, senior officers, clerical staff members, non clerical staff members.
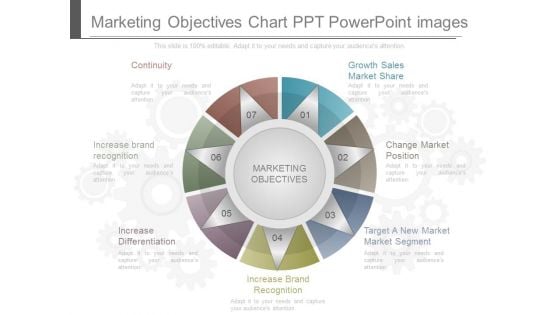
Marketing Objectives Chart Ppt Powerpoint Images
This is a marketing objectives chart ppt powerpoint images. This is a seven stage process. The stages in this process are continuity, growth sales market share, change market position, target a new market market segment, increase brand recognition, increase differentiation, increase brand recognition, marketing objectives.
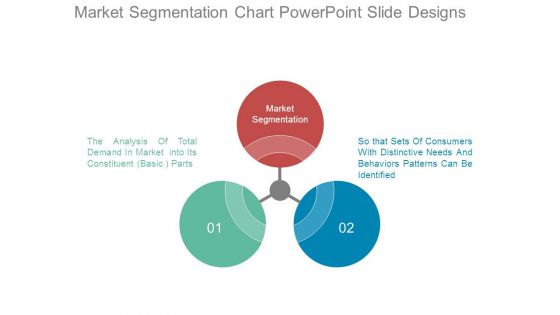
Market Segmentation Chart Powerpoint Slide Designs
This is a market segmentation chart powerpoint slide designs. This is a three stage process. The stages in this process are market segmentation, so that sets of consumers with distinctive needs and behaviors patterns can be identified, the analysis of total demand in market into its constituent basic parts.
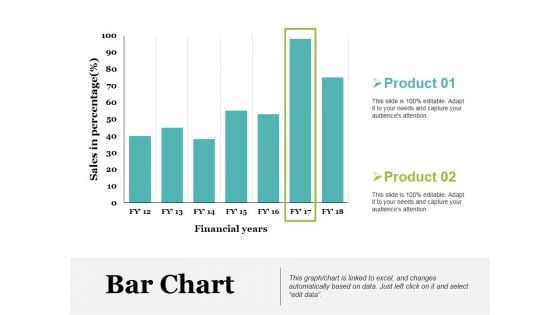
Bar Chart Ppt PowerPoint Presentation Model Picture
This is a bar chart ppt powerpoint presentation model picture. This is a two stage process. The stages in this process are product, sales in percentage, financial years, bar chart.
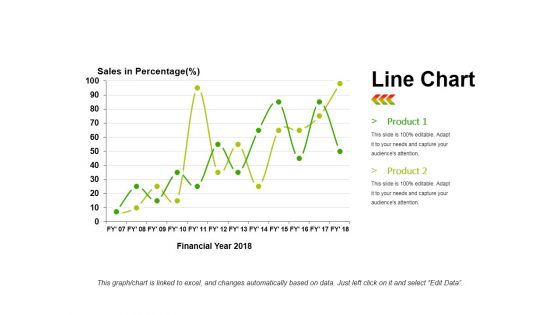
Line Chart Ppt PowerPoint Presentation Infographics Infographics
This is a line chart ppt powerpoint presentation infographics infographics. This is a two stage process. The stages in this process are product, sales in percentage, financial year, line chart, finance.
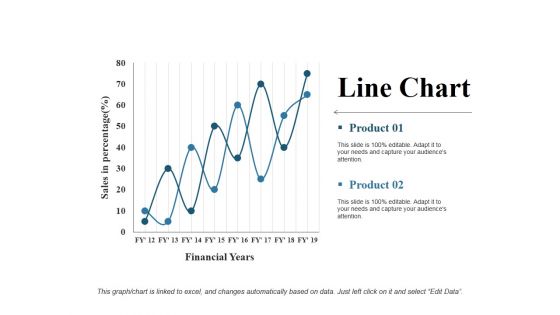
Line Chart Ppt PowerPoint Presentation Gallery Rules
This is a line chart ppt powerpoint presentation gallery rules. This is a two stage process. The stages in this process are financial years, product, sales in percentage, line chart, growth.
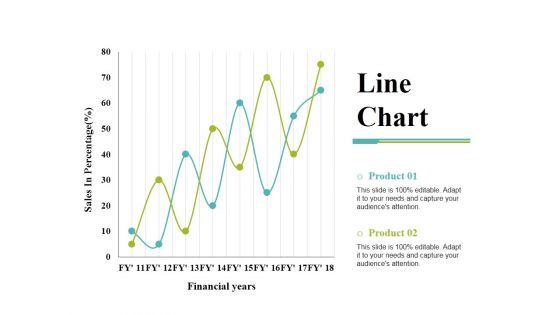
Line Chart Ppt PowerPoint Presentation Gallery Templates
This is a line chart ppt powerpoint presentation gallery templates. This is a two stage process. The stages in this process are product, financial years, sales in percentage, line chart.
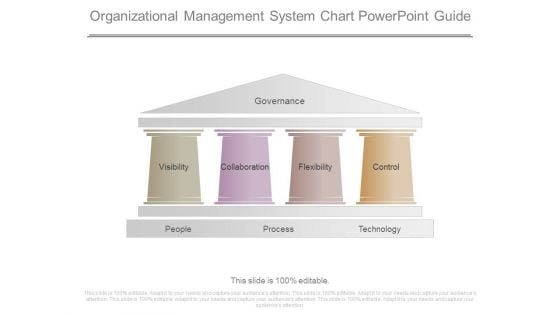
Organizational Management System Chart Powerpoint Guide
This is a organizational management system chart powerpoint guide. This is a four stage process. The stages in this process are governance, visibility, collaboration, flexibility, control, people, process, technology.
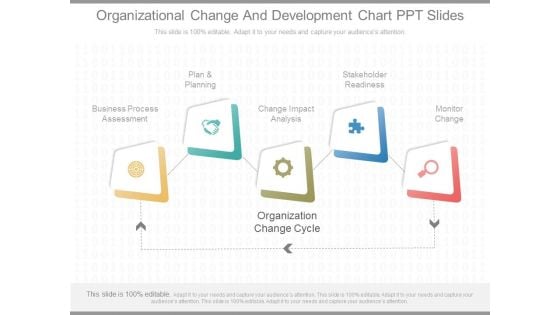
Organizational Change And Development Chart Ppt Slides
This is a organizational change and development chart ppt slides. This is a five stage process. The stages in this process are business process assessment, plan and planning, change impact analysis, stakeholder readiness, monitor change, organization change cycle.
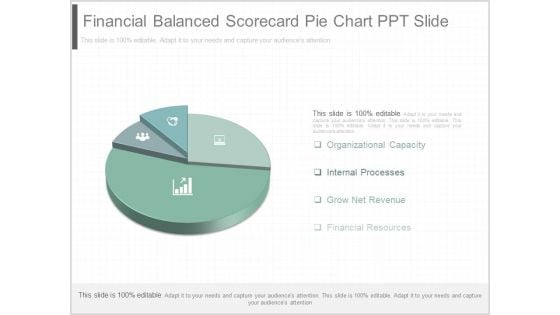
Financial Balanced Scorecard Pie Chart Ppt Slide
This is a financial balanced scorecard pie chart ppt slide. This is a four stage process. The stages in this process are organizational capacity, internal processes, grow net revenue, financial resources.
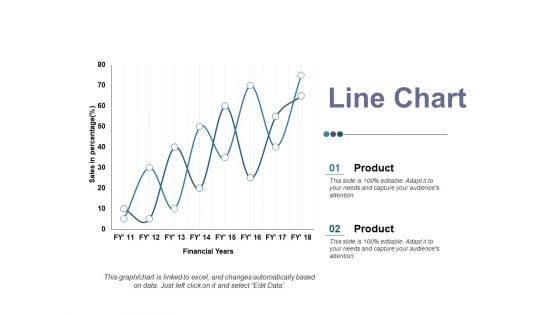
Line Chart Ppt PowerPoint Presentation Ideas Elements
This is a line chart ppt powerpoint presentation ideas elements. This is a two stage process. The stages in this process are product, sales in percentage, financial year, business, line chart.
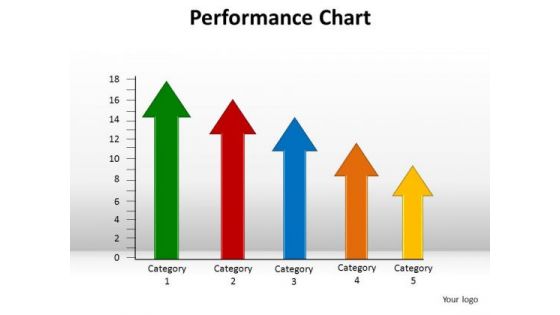
PowerPoint Layouts Graphic Performance Chart Ppt Design
PowerPoint Layouts Graphic Performance Chart PPT Design-Explore the various directions and layers existing in your in your plans and processes. Unravel the desired and essential elements of your overall strategy. Explain the relevance of the different layers and stages and directions in getting down to your core competence, ability and desired result. Step on it with our PowerPoint Layouts Graphic Performance Chart Ppt Design. Escalate the process with our PowerPoint Layouts Graphic Performance Chart Ppt Design.
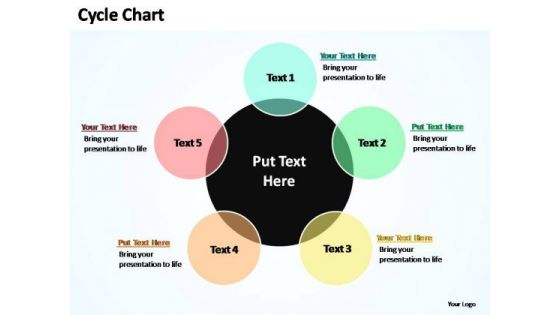
PowerPoint Themes Success Cycle Chart Ppt Presentation
PowerPoint Themes Success Cycle Chart PPT Presentation-Circle chart will vary depending on the specific subject matter, the majority of Circle charts diagram a process from start to finish. Your effort has brought you along. Go further with our PowerPoint Themes Success Cycle Chart Ppt Presentation.
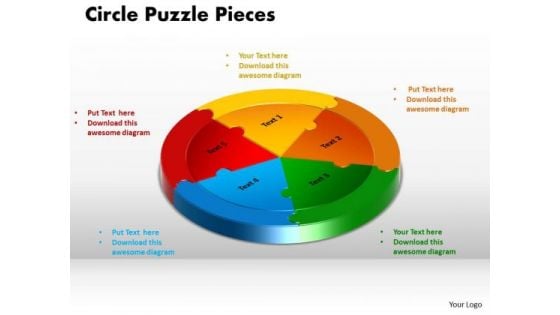
PowerPoint Layout Circle Puzzle Chart Ppt Backgrounds
PowerPoint Layout Circle Puzzle Chart PPT Backgrounds-Each Circle chart will vary depending on the specific subject matter, the majority of Circle charts diagram a process from start to finish. Encourage teams with our PowerPoint Layout Circle Puzzle Chart Ppt Backgrounds. Download without worries with our money back guaranteee.

Sample Production Flow Chart Diagram Ppt Model
This is a sample production flow chart diagram ppt model. This is a nine stage process. The stages in this process are raw material, incoming quality control, material mixing, pugging, inspection, moulding, control, post processing, packaging.
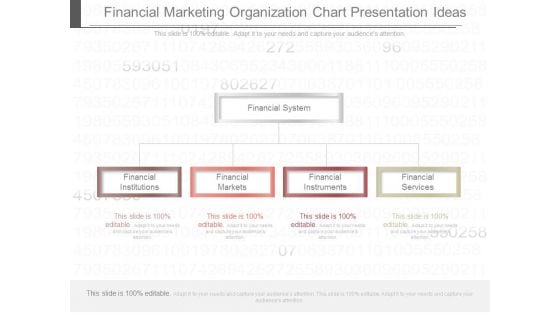
Financial Marketing Organization Chart Presentation Ideas
This is a financial marketing organization chart presentation ideas. This is a five stage process. The stages in this process are financial system, financial institutions, financial markets, financial instruments, financial services.\n\n
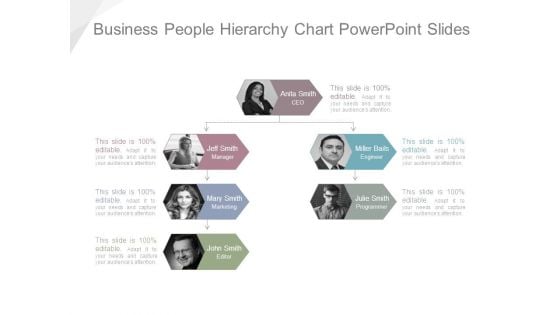
Business People Hierarchy Chart Powerpoint Slides
This is a business people hierarchy chart powerpoint slides. This is a four stage process. The stages in this process are anita smith ceo, jeff smith manager, miller bails engineer, mary smith marketing, julie smith programmer, john smith editor.
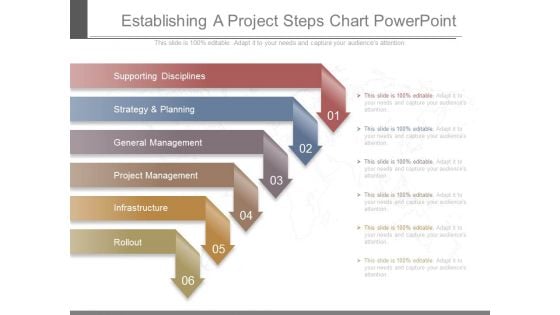
Establishing A Project Steps Chart Powerpoint
This is a establishing a project steps chart powerpoint. This is a six stage process. The stages in this process are supporting disciplines, strategy and planning, general management, project management, infrastructure, rollout.

Market Research Data Collection Chart Presentation
This is a market research data collection chart presentation. This is a five stage process. The stages in this process are concept testing, customer satisfaction, pricing research, market segmentation, awareness usage.
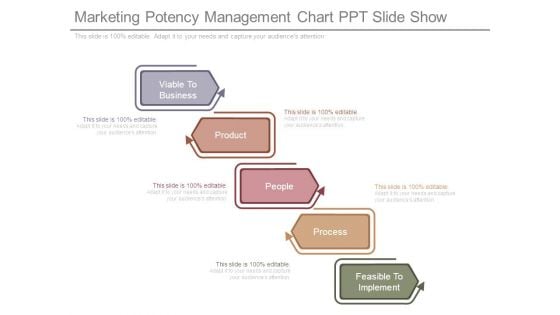
Marketing Potency Management Chart Ppt Slide Show
This is a marketing potency management chart ppt slide show. This is a five stage process. The stages in this process are viable to business, product, people, process, feasible to implement.
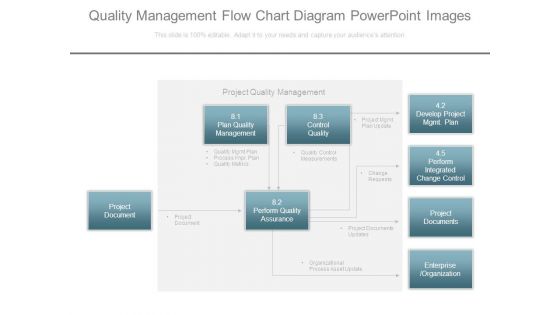
Quality Management Flow Chart Diagram Powerpoint Images
This is a quality management flow chart diagram powerpoint images. This is a four stage process. The stages in this process are project document, project quality management, plan quality management, control quality, perform quality assurance, develop project mgmt. plan, perform integrated, change control, project documents, enterprise, organization, quality mgmt plan, process impr plan, quality metrics, quality control measurements, project mgmt plan update, project document, change requests, project documents updates, organizational process asset update.
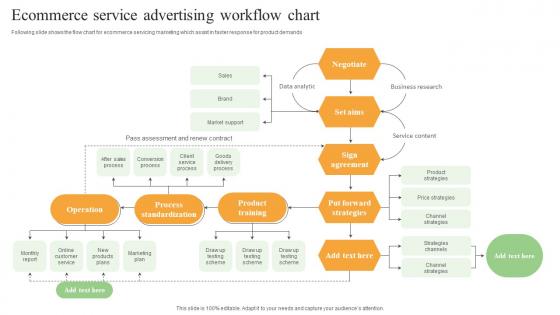
Ecommerce Service Advertising Workflow Chart Themes Pdf
Following slide shows the flow chart for ecommerce servicing marketing which assist in faster response for product demands. Pitch your topic with ease and precision using this Ecommerce Service Advertising Workflow Chart Themes Pdf. This layout presents information on Business Research, Service Content, Product Training. It is also available for immediate download and adjustment. So, changes can be made in the color, design, graphics or any other component to create a unique layout. Following slide shows the flow chart for ecommerce servicing marketing which assist in faster response for product demands.
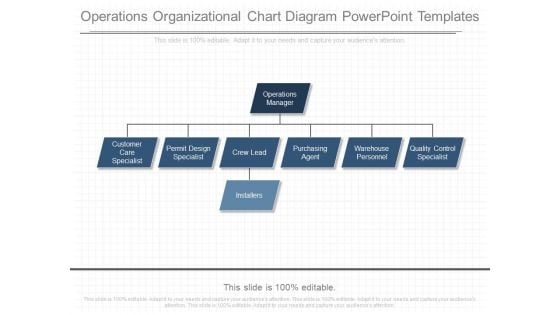
Operations Organizational Chart Diagram Powerpoint Templates
This is a operations organizational chart diagram powerpoint templates. This is a eight stage process. The stages in this process are operations manager, customer care specialist, permit design specialist, crew lead, purchasing agent, warehouse personnel, quality control specialist, installers.\n\n
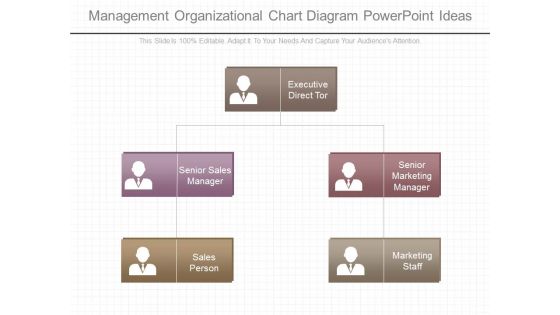
Management Organizational Chart Diagram Powerpoint Ideas
This is a management organizational chart diagram powerpoint ideas. This is a five stage process. The stages in this process are executive director, senior sales manager, senior marketing manager, marketing staff, sales person.


 Continue with Email

 Home
Home


