Process Flow Chart
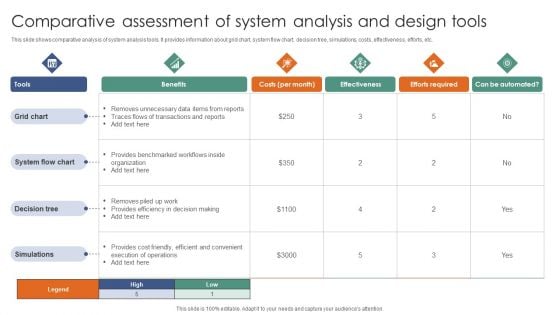
Comparative Assessment Of System Analysis And Design Tools Ppt Infographic Template Microsoft PDF
This slide shows comparative analysis of system analysis tools. It provides information about grid chart, system flow chart, decision tree, simulations, costs, effectiveness, efforts, etc. Pitch your topic with ease and precision using this Comparative Assessment Of System Analysis And Design Tools Ppt Infographic Template Microsoft PDF. This layout presents information on Benefits, Effectiveness, Efforts required, Grid chart. It is also available for immediate download and adjustment. So, changes can be made in the color, design, graphics or any other component to create a unique layout.
Work Execution Liability Message From The Chief Financial Officer Ppt Icon Mockup PDF
The following slide provides an overview of the chief financial officers message that briefly introduces the clients to the annual financial performance along with major annual financial highlights. Deliver and pitch your topic in the best possible manner with this work execution liability message from the chief financial officer ppt icon mockup pdf. Use them to share invaluable insights on revenue, operating profit, cash flow, operating activities and impress your audience. This template can be altered and modified as per your expectations. So, grab it now.
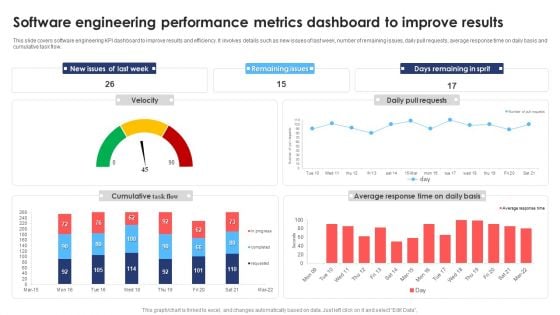
Software Engineering Performance Metrics Dashboard To Improve Results Infographics PDF
This slide covers software engineering KPI dashboard to improve results and efficiency. It involves details such as new issues of last week, number of remaining issues, daily pull requests, average response time on daily basis and cumulative task flow. Pitch your topic with ease and precision using this Software Engineering Performance Metrics Dashboard To Improve Results Infographics PDF. This layout presents information on Software Engineering Performance, Metrics Dashboard Improve Results. It is also available for immediate download and adjustment. So, changes can be made in the color, design, graphics or any other component to create a unique layout.
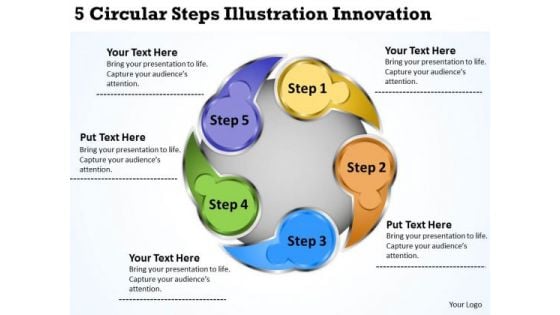
Business Logic Diagram 5 Circular Steps Illustration Innovation PowerPoint Slides
We present our business logic diagram 5 circular steps illustration innovation PowerPoint Slides.Download our Advertising PowerPoint Templates because You can Be the puppeteer with our PowerPoint Templates and Slides as your strings. Lead your team through the steps of your script. Use our Circle Charts PowerPoint Templates because It will Raise the bar of your Thoughts. They are programmed to take you to the next level. Present our Business PowerPoint Templates because Our PowerPoint Templates and Slides will provide weight to your words. They will bring out the depth of your thought process. Download our Shapes PowerPoint Templates because It will Give impetus to the hopes of your colleagues. Our PowerPoint Templates and Slides will aid you in winning their trust. Download our Arrows PowerPoint Templates because Our PowerPoint Templates and Slides are focused like a searchlight beam. They highlight your ideas for your target audience.Use these PowerPoint slides for presentations relating to Analysis, Arrow, Blue, Business, Chart, Circle, Circular, Cycle, Diagram, Five, Flow, Flow-Chart, Flowchart, Graphic, Green, Implementation, Infographic, Lifecycle, Model, Phase, Process, Red, Step, Work, Work-Flow, Workflow, Yellow. The prominent colors used in the PowerPoint template are Yellow, Orange, Green. Progress is inevitable with our Business Logic Diagram 5 Circular Steps Illustration Innovation PowerPoint Slides. Download without worries with our money back guaranteee.
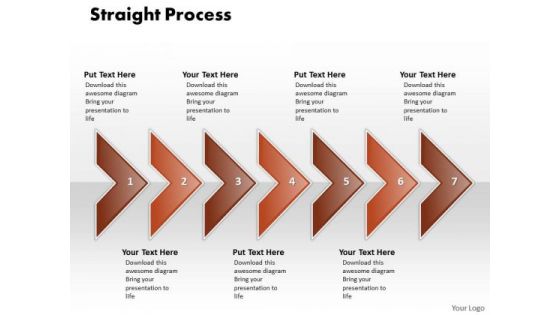
Ppt Correlated Shapes Arrows PowerPoint Straight Line 7 Phase Diagram Templates
PPT correlated shapes arrows powerpoint straight line 7 phase diagram Templates-This Diagram is used to illustrate how information will move between interrelated systems in the accomplishment of a given function, task or process. The visual description of this information flow with each given level showing how data is fed into a given process step and subsequently passed along at the completion of that step.-PPT correlated shapes arrows powerpoint straight line 7 phase diagram Templates-Aim, Arrow, Badge, Border, Color, Connection, Curve, Design, Direction, Download, Icon, Illustration, Indicator, Internet, Label, Link, Magenta, Mark, Next, Object, Orientation, Paper, Peeling, Pointer, Rounded, Set, Shadow, Shape, Sign Give your audience a feast for their eyes. Our brightly colored Ppt Correlated Shapes Arrows PowerPoint Straight Line 7 Phase Diagram Templates will hold their fascnation.
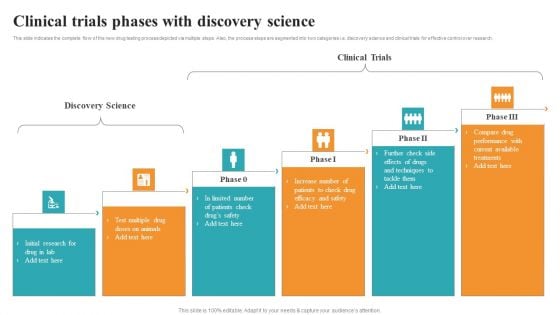
Clinical Trials Phases With Discovery Science Medical Research Phases For Clinical Tests Topics PDF
This slide indicates the complete flow of the new drug testing process depicted via multiple steps. Also, the process steps are segmented into two categories i.e. discovery science and clinical trials for effective control over research. Slidegeeks is here to make your presentations a breeze with Clinical Trials Phases With Discovery Science Medical Research Phases For Clinical Tests Topics PDF With our easy to use and customizable templates, you can focus on delivering your ideas rather than worrying about formatting. With a variety of designs to choose from, you are sure to find one that suits your needs. And with animations and unique photos, illustrations, and fonts, you can make your presentation pop. So whether you are giving a sales pitch or presenting to the board, make sure to check out Slidegeeks first.
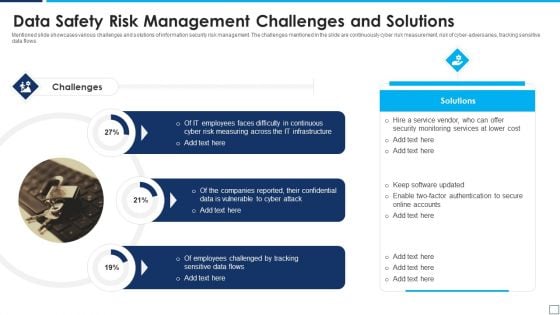
Data Safety Risk Management Challenges And Solutions Clipart PDF
Mentioned slide showcases various challenges and solutions of information security risk management. The challenges mentioned in the slide are continuously cyber risk measurement, risk of cyber-adversaries, tracking sensitive data flows. Showcasing this set of slides titled y risk management challenges and solutions clipart pdf. The topics addressed in these templates are data safety risk management challenges and solutions. All the content presented in this PPT design is completely editable. Download it and make adjustments in color, background, font etc. as per your unique business setting.
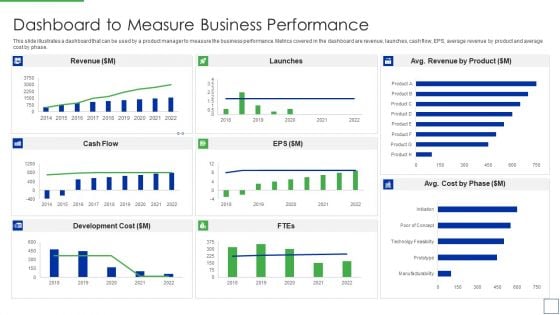
Product Portfolio Management For New Target Region Dashboard To Measure Business Rules PDF
This slide illustrates a dashboard that can be used by a product manager to measure the business performance. Metrics covered in the dashboard are revenue, launches, cash flow, EPS, average revenue by product and average cost by phase.Deliver and pitch your topic in the best possible manner with this Product Portfolio Management For New Target Region Dashboard To Measure Business Rules PDF Use them to share invaluable insights on Dashboard to Measure Business Performance and impress your audience. This template can be altered and modified as per your expectations. So, grab it now.
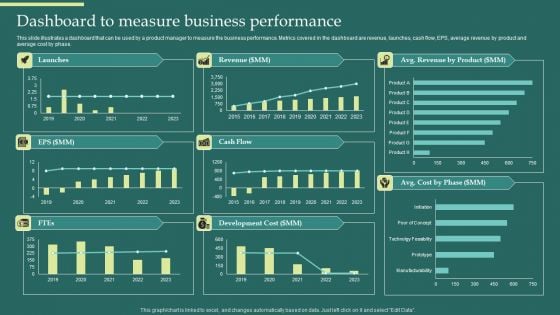
Product Portfolios And Strategic Dashboard To Measure Business Performance Portrait PDF
This slide illustrates a dashboard that can be used by a product manager to measure the business performance. Metrics covered in the dashboard are revenue, launches, cash flow, EPS, average revenue by product and average cost by phase. Do you have an important presentation coming up Are you looking for something that will make your presentation stand out from the rest Look no further than Product Portfolios And Strategic Dashboard To Measure Business Performance Portrait PDF. With our professional designs, you can trust that your presentation will pop and make delivering it a smooth process. And with Slidegeeks, you can trust that your presentation will be unique and memorable. So why wait Grab Product Portfolios And Strategic Dashboard To Measure Business Performance Portrait PDF today and make your presentation stand out from the rest.
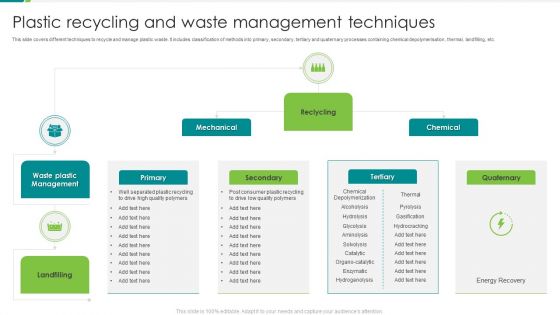
Plastic Recycling And Waste Management Techniques Ppt Infographics Designs PDF
This slide covers different techniques to recycle and manage plastic waste. It includes classification of methods into primary, secondary, tertiary and quaternary processes containing chemical depolymerisation, thermal, landfilling, etc. Persuade your audience using this Plastic Recycling And Waste Management Techniques Ppt Infographics Designs PDF. This PPT design covers three stages, thus making it a great tool to use. It also caters to a variety of topics including Mechanical, Reclycling, Chemical, Secondary. Download this PPT design now to present a convincing pitch that not only emphasizes the topic but also showcases your presentation skills.
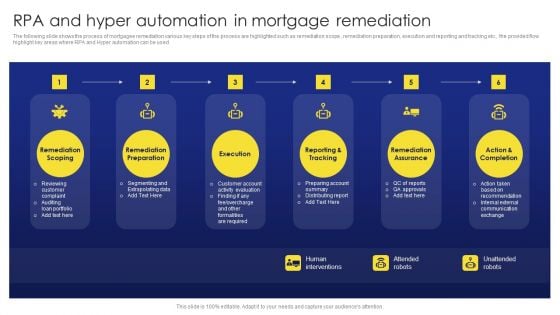
Deployment Procedure Of Hyper Automation RPA And Hyper Automation In Mortgage Remediation Diagrams PDF
The following slide shows the process of mortgagee remediation various key steps of the process are highlighted such as remediation scope , remediation preparation, execution and reporting and tracking etc., the provided flow highlight key areas where RPA and Hyper automation can be used. This modern and well arranged Deployment Procedure Of Hyper Automation RPA And Hyper Automation In Mortgage Remediation Diagrams PDF provides lots of creative possibilities. It is very simple to customize and edit with the Powerpoint Software. Just drag and drop your pictures into the shapes. All facets of this template can be edited with Powerpoint no extra software is necessary. Add your own material, put your images in the places assigned for them, adjust the colors, and then you can show your slides to the world, with an animated slide included.
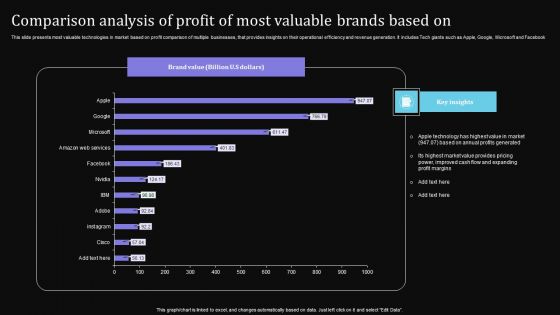
Comparison Analysis Of Profit Of Most Valuable Brands Based On Pictures PDF
This slide presents most valuable technologies in market based on profit comparison of multiple businesses, that provides insights on their operational efficiency and revenue generation. It includes Tech giants such as Apple, Google, Microsoft and Facebook. Showcasing this set of slides titled Comparison Analysis Of Profit Of Most Valuable Brands Based On Pictures PDF. The topics addressed in these templates are Apple Technology, Annual Profits Generated, Improved Cash Flow. All the content presented in this PPT design is completely editable. Download it and make adjustments in color, background, font etc. as per your unique business setting.
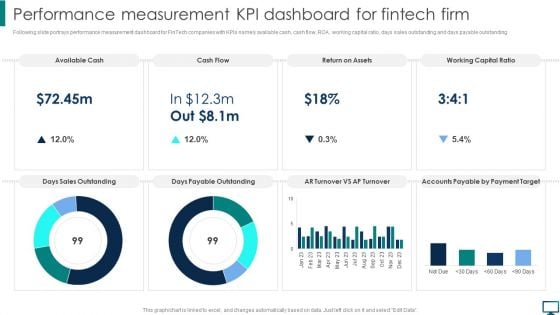
Performance Measurement KPI Dashboard For Fintech Firm Topics PDF
Following slide portrays performance measurement dashboard for FinTech companies with KPIs namely available cash, cash flow, ROA, working capital ratio, days sales outstanding and days payable outstanding. Create an editable Performance Measurement KPI Dashboard For Fintech Firm Topics PDF that communicates your idea and engages your audience. Whether you are presenting a business or an educational presentation, pre designed presentation templates help save time. Performance Measurement KPI Dashboard For Fintech Firm Topics PDF is highly customizable and very easy to edit, covering many different styles from creative to business presentations. Slidegeeks has creative team members who have crafted amazing templates. So, go and get them without any delay.
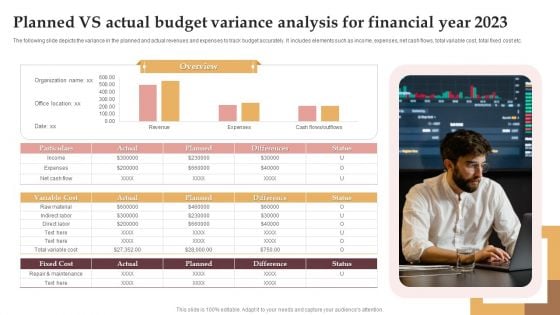
Planned Vs Actual Budget Variance Analysis For Financial Year 2023 Inspiration PDF
The following slide depicts the variance in the planned and actual revenues and expenses to track budget accurately. It includes elements such as income, expenses, net cash flows, total variable cost, total fixed cost etc. Pitch your topic with ease and precision using this Planned Vs Actual Budget Variance Analysis For Financial Year 2023 Inspiration PDF. This layout presents information on Budget Variance Analysis, Variable Cost, Fixed Cost. It is also available for immediate download and adjustment. So, changes can be made in the color, design, graphics or any other component to create a unique layout.
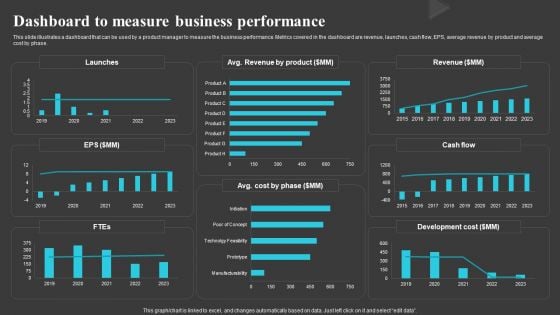
Dashboard To Measure Business Performance Creating And Offering Multiple Product Ranges In New Business Introduction PDF
This slide illustrates a dashboard that can be used by a product manager to measure the business performance. Metrics covered in the dashboard are revenue, launches, cash flow, EPS, average revenue by product and average cost by phase.There are so many reasons you need a Dashboard To Measure Business Performance Creating And Offering Multiple Product Ranges In New Business Introduction PDF. The first reason is you can notspend time making everything from scratch, Thus, Slidegeeks has made presentation templates for you too. You can easily download these templates from our website easily.
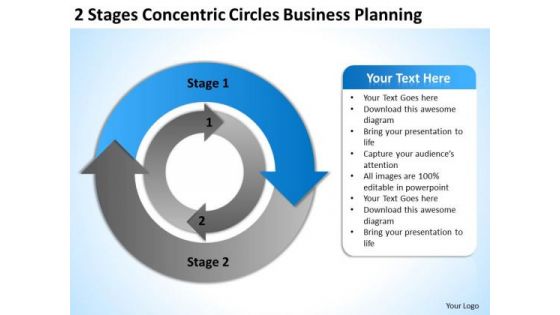
Circles World Business PowerPoint Templates Planning Slides
We present our circles world business powerpoint templates planning Slides.Download and present our Success PowerPoint Templates because Our PowerPoint Templates and Slides provide you with a vast range of viable options. Select the appropriate ones and just fill in your text. Download and present our Finance PowerPoint Templates because You are well armed with penetrative ideas. Our PowerPoint Templates and Slides will provide the gunpowder you need. Use our Arrows PowerPoint Templates because You aspire to touch the sky with glory. Let our PowerPoint Templates and Slides provide the fuel for your ascent. Use our Circle Charts PowerPoint Templates because You can Hit the nail on the head with our PowerPoint Templates and Slides. Embed your ideas in the minds of your audience. Download and present our Business PowerPoint Templates because You aspire to touch the sky with glory. Let our PowerPoint Templates and Slides provide the fuel for your ascent.Use these PowerPoint slides for presentations relating to Arrow, plan, infographic, chart, control, 3d, flow, spiral, method, step, flowchart, model, business, flow-chart, engineering, concept, vector, life, success, diagram, circle, graphic, process, workflow, idea, development, plan-do-check-act, management, cycle, system, strategy, research, iterative, evaluate, design, lifecycle, quality, work, software. The prominent colors used in the PowerPoint template are Blue, Black, Gray. Jump over obstacles with our Circles World Business PowerPoint Templates Planning Slides. Make sure your presentation gets the attention it deserves.
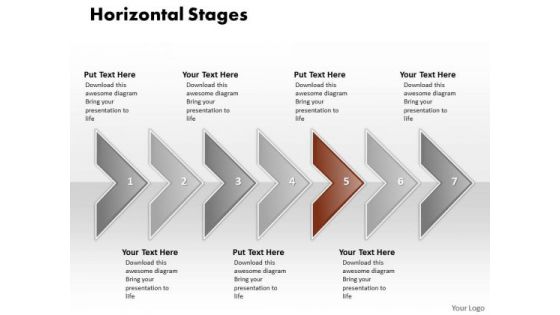
Ppt Correlated Arrows In Horizontal Create PowerPoint Macro 7 State Diagram Templates
PPT correlated arrows in horizontal create powerpoint macro 7 state diagram Templates-This Diagram is used to illustrate how information will move between interrelated systems in the accomplishment of a given function, task or process. The visual description of this information flow with each given level showing how data is fed into a given process step and subsequently passed along at the completion of that step.-PPT correlated arrows in horizontal create powerpoint macro 7 state diagram Templates-Aim, Arrow, Badge, Border, Color, Connection, Curve, Design, Direction, Download, Icon, Illustration, Indicator, Internet, Label, Link, Magenta, Mark, Next, Object, Orientation, Paper, Peeling, Pointer, Rounded, Set, Shadow, Shape, Sign Our Ppt Correlated Arrows In Horizontal Create PowerPoint Macro 7 State Diagram Templates are exceptionally adaptive. They will blend in with any scenario.
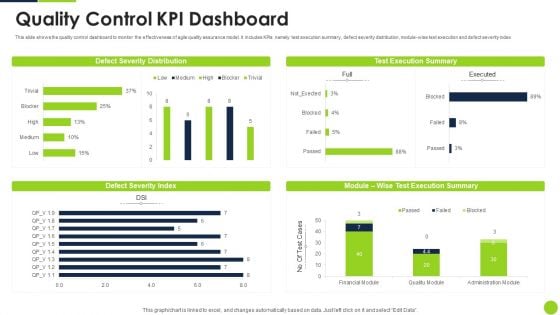
Agile Methodology Quality Control Quality Control KPI Dashboard Ppt Infographic Template Layout Ideas PDF
This slide shows the quality control dashboard to monitor the effectiveness of agile quality assurance model. It includes KPIs namely test execution summary, defect severity distribution, module-wise text execution and defect severity index Deliver an awe inspiring pitch with this creative agile methodology quality control quality control kpi dashboard ppt infographic template layout ideas pdf bundle. Topics like quality control kpi dashboard can be discussed with this completely editable template. It is available for immediate download depending on the needs and requirements of the user.
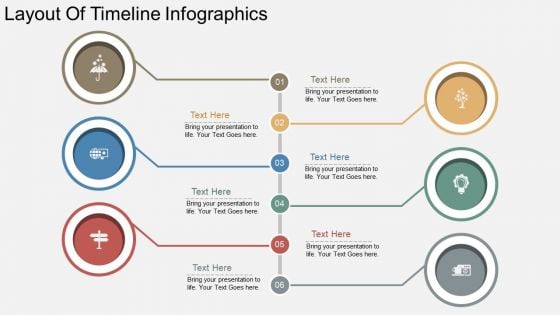
Layout Of Timeline Infographics PowerPoint Template
This PowerPoint slide is one of our formal slides used by corporate sector and business houses. The slide can be effectively used to describe various steps of a process occurring in a systematic manner. Icons can be modified according to particular processes and enough space has been left to add text to describe the steps and their effects in details. The slide can also be the perfect option to explain various departments in an organization or to explain the roles of each department. This can effectively explain the hierarchy in an organization and the flow of communication and orders that are to be followed in an organization or a company. The template is customizable and icons can and font can be edited to add appropriate ones.
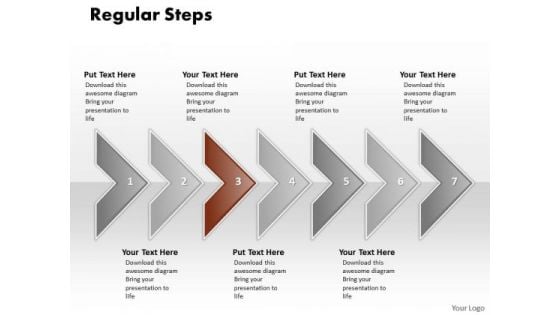
Ppt Correlated Curved Arrows PowerPoint 2010 Regular Line 7 Stages Templates
PPT correlated curved arrows powerpoint 2010 regular line 7 stages Templates-This Diagram is used to illustrate how information will move between interrelated systems in the accomplishment of a given function, task or process. The visual description of this information flow with each given level showing how data is fed into a given process step and subsequently passed along at the completion of that step.-PPT correlated curved arrows powerpoint 2010 regular line 7 stages Templates-Aim, Arrow, Badge, Border, Color, Connection, Curve, Design, Direction, Download, Icon, Illustration, Indicator, Internet, Label, Link, Magenta, Mark, Next, Object, Orientation, Paper, Peeling, Pointer, Rounded, Set, Shadow, Shape, Sign Examine every deatail with our Ppt Correlated Curved Arrows PowerPoint 2010 Regular Line 7 Stages Templates. Put each element to the test.
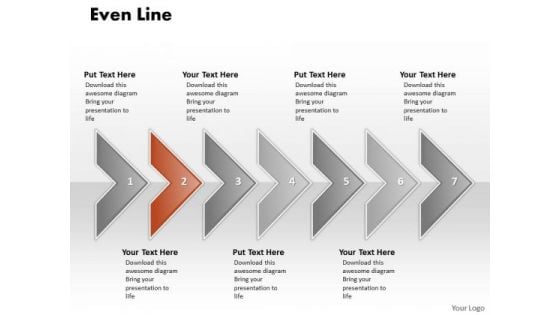
Ppt Correlated Arrows PowerPoint Templates Even Line 7 Stages
PPT correlated arrows powerpoint templates even line 7 stages-This Diagram is used to illustrate how information will move between interrelated systems in the accomplishment of a given function, task or process. The visual description of this information flow with each given level showing how data is fed into a given process step and subsequently passed along at the completion of that step.-PPT correlated arrows powerpoint templates even line 7 stages-Aim, Arrow, Badge, Border, Color, Connection, Curve, Design, Direction, Download, Icon, Illustration, Indicator, Internet, Label, Link, Magenta, Mark, Next, Object, Orientation, Paper, Peeling, Pointer, Rounded, Set, Shadow, Shape, Sign Let your ideas grow in their minds. Our Ppt Correlated Arrows PowerPoint Templates Even Line 7 Stages will act like a fertilizer.
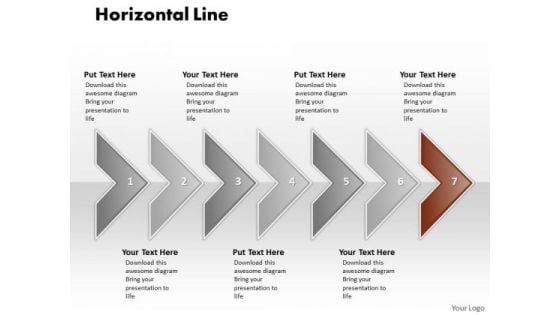
Ppt Correlated Circular Arrows PowerPoint 2010 Horizontal Line 7 Stages Templates
PPT correlated circular arrows powerpoint 2010 horizontal line 7 stages Templates-This Diagram is used to illustrate how information will move between interrelated systems in the accomplishment of a given function, task or process. The visual description of this information flow with each given level showing how data is fed into a given process step and subsequently passed along at the completion of that step.-PPT correlated circular arrows powerpoint 2010 horizontal line 7 stages Templates-Aim, Arrow, Badge, Border, Color, Connection, Curve, Design, Direction, Download, Icon, Illustration, Indicator, Internet, Label, Link, Magenta, Mark, Next, Object, Orientation, Paper, Peeling, Pointer, Rounded, Set, Shadow, Shape, Sign Pioneer changes with our Ppt Correlated Circular Arrows PowerPoint 2010 Horizontal Line 7 Stages Templates. Download without worries with our money back guaranteee.
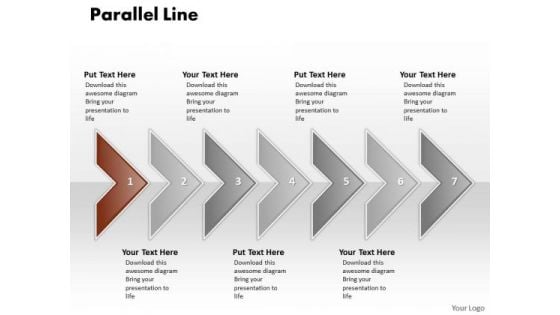
Ppt Correlated PowerPoint Graphics Arrows Parallel Line 7 Stage Templates
PPT correlated powerpoint graphics arrows parallel line 7 stage Templates-This Diagram is used to illustrate how information will move between interrelated systems in the accomplishment of a given function, task or process. The visual description of this information flow with each given level showing how data is fed into a given process step and subsequently passed along at the completion of that step.-PPT correlated powerpoint graphics arrows parallel line 7 stage Templates-Aim, Arrow, Badge, Border, Color, Connection, Curve, Design, Direction, Download, Icon, Illustration, Indicator, Internet, Label, Link, Magenta, Mark, Next, Object, Orientation, Paper, Peeling, Pointer, Rounded, Set, Shadow, Shape, Sign Analyse the effect of different factors. Our Ppt Correlated PowerPoint Graphics Arrows Parallel Line 7 Stage Templates will give them equal attention.
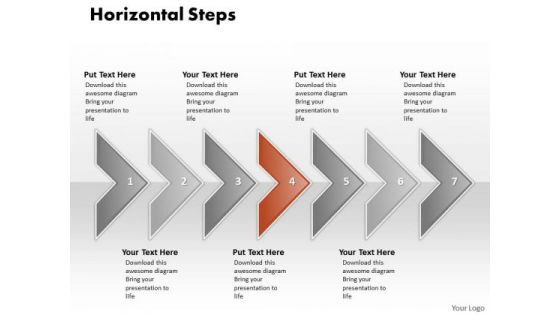
Ppt Correlated Shapes Arrows PowerPoint Horizontal Stages Templates
PPT correlated shapes arrows powerpoint horizontal stages Templates-This Diagram is used to illustrate how information will move between interrelated systems in the accomplishment of a given function, task or process. The visual description of this information flow with each given level showing how data is fed into a given process step and subsequently passed along at the completion of that step.-PPT correlated shapes arrows powerpoint horizontal stages Templates-Aim, Arrow, Badge, Border, Color, Connection, Curve, Design, Direction, Download, Icon, Illustration, Indicator, Internet, Label, Link, Magenta, Mark, Next, Object, Orientation, Paper, Peeling, Pointer, Rounded, Set, Shadow, Shape, Sign Enlist teams with our Ppt Correlated Shapes Arrows PowerPoint Horizontal Stages Templates. Download without worries with our money back guaranteee.
Failure Methods And Effects Assessments FMEA Organization Structure Of FMEA Team Icons PDF
This slide provides the organization or hierarchy chart of FMEA Team. It includes head of the team and 6 team members 2 each from 3 different departments. This is a failure methods and effects assessments fmea organization structure of fmea team icons pdf template with various stages. Focus and dispense information on two stages using this creative set, that comes with editable features. It contains large content boxes to add your information on topics like manufacturing team, quality control team, designing. You can also showcase facts, figures, and other relevant content using this PPT layout. Grab it now.
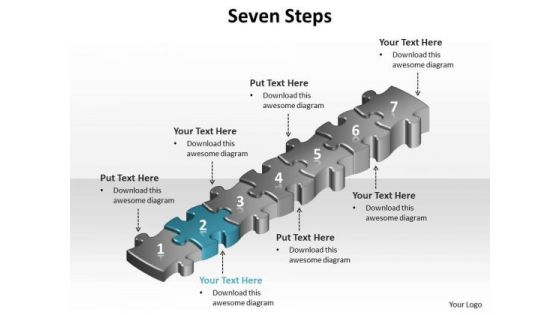
Ppt Blue PowerPoint Template Success Step Templates
PPT blue PowerPoint template success step Templates-Create visually stunning and define your PPT Presentations in a unique and inspiring manner using our above Diagram which contains a graphic of seven stages arranged using puzzle pieces. Use this diagram as a method of graphically representing the flow of data through an information processing system.-PPT blue PowerPoint template success step Templates-achievement, activity, adversity, bridge, built, business, cartoon, challenge, character, computer, concept, construction, creativity, decisions, figure, games, goal, graphic, icon, idea, intelligence, organization, people, planning, problems, puzzle, solution, stick, strategy, success Award yourself with our Ppt Blue PowerPoint Template Success Step Templates. You deserve to deal with the best.

SPI Methodology Continual Project Improvement Dashboard Ppt PowerPoint Presentation File Background Image PDF
This slide provides the glimpse about the continual project improvement dashboard wherein employee engagement, total initiatives, projects prioritization are covered. Deliver an awe inspiring pitch with this creative spi methodology continual project improvement dashboard ppt powerpoint presentation file background image pdf bundle. Topics like employee engagement, project can be discussed with this completely editable template. It is available for immediate download depending on the needs and requirements of the user.
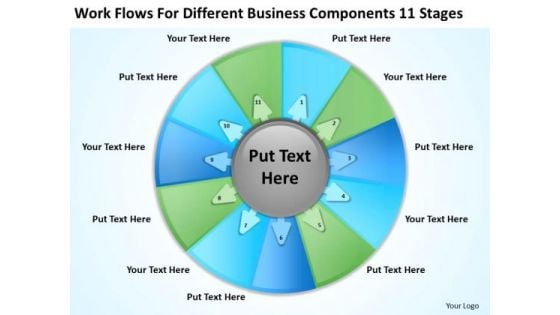
Different Business Components 11 Stages Ppt Plan PowerPoint Slides
We present our different business components 11 stages ppt plan PowerPoint Slides.Download and present our Circle Charts PowerPoint Templates because Our PowerPoint Templates and Slides will generate and maintain the level of interest you desire. They will create the impression you want to imprint on your audience. Download and present our Shapes PowerPoint Templates because Our PowerPoint Templates and Slides are conceived by a dedicated team. Use them and give form to your wondrous ideas. Present our Arrows PowerPoint Templates because You should Throw the gauntlet with our PowerPoint Templates and Slides. They are created to take up any challenge. Present our Maketing PowerPoint Templates because You can Channelise the thoughts of your team with our PowerPoint Templates and Slides. Urge them to focus on the goals you have set. Use our Metaphors-Visual Concepts PowerPoint Templates because You can Double your output with our PowerPoint Templates and Slides. They make beating deadlines a piece of cake.Use these PowerPoint slides for presentations relating to section, sequence, review, step, refresh, order, duplicate, flow, concept, arrow, success, rotation, presentation, course, iterate, diagram, artfulness, relate, circle, ring, recycle, process, report, work flow, simple, react, repeat, manage, cycle, circulation, stage, connection, circular, chart, system, strategy, round, direction, 4 steps diagram, swirl, phase, method, 4 steps, procedure, correlate, cyclic, continuity, repetition. The prominent colors used in the PowerPoint template are Blue, Green, Gray. Despatch your views with the assistance of our Different Business Components 11 Stages Ppt Plan PowerPoint Slides. They will deliver them on the dot.
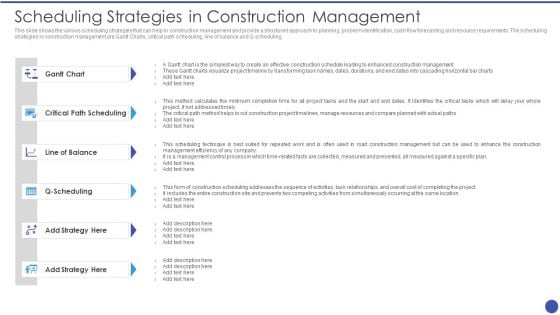
Management Techniques Scheduling Strategies In Construction Management Professional PDF
This slide shows the various scheduling strategies that can help in construction management and provide a structured approach to planning, problem identification, cash flow forecasting and resource requirements. The scheduling strategies in construction management are Gantt Charts, critical path scheduling, line of balance and Q-scheduling. Presenting Management Techniques Scheduling Strategies In Construction Management Professional PDF to provide visual cues and insights. Share and navigate important information on six stages that need your due attention. This template can be used to pitch topics like Gantt Chart, Critical Path Scheduling, Line Balance, Strategy. In addtion, this PPT design contains high resolution images, graphics, etc, that are easily editable and available for immediate download.

Post Implementation Of Agile Methodology To Quality Control Ppt Pictures Themes PDF
This slide shows the impact statistics of introducing agile quality assurance model upon company profits, loss, revenue along with the status of ongoing software projects. Deliver an awe inspiring pitch with this creative post implementation of agile methodology to quality control ppt pictures themes pdf bundle. Topics like post implementation of agile methodology to quality control can be discussed with this completely editable template. It is available for immediate download depending on the needs and requirements of the user.
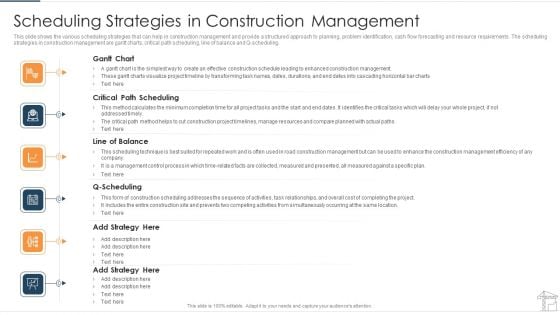
Scheduling Strategies In Construction Management Diagrams PDF
This slide shows the various scheduling strategies that can help in construction management and provide a structured approach to planning, problem identification, cash flow forecasting and resource requirements. The scheduling strategies in construction management are gantt charts, critical path scheduling, line of balance and Q-scheduling. Presenting scheduling strategies in construction management diagrams pdf to provide visual cues and insights. Share and navigate important information on six stages that need your due attention. This template can be used to pitch topics like critical path scheduling, line of balance, gantt chart. In addtion, this PPT design contains high resolution images, graphics, etc, that are easily editable and available for immediate download.

Ppt Background Vertical Steps For Free Idea Strategy 3 Design
We present our PPT Background vertical Steps for free idea strategy 3 design. Use our Circle Charts PowerPoint Templates because, this template with an image of helps you chart the course of your presentation. Use our Arrows PowerPoint Templates because, the basic stages are in place, you need to build upon them with our PowerPoint templates. Use our Communication PowerPoint Templates because; Employ the right colors for your brilliant ideas. Use our Layers PowerPoint Templates because; Outline your targets to your team. Use our Business PowerPoint Templates because, Marketing Strategy Business Template:- Maximizing sales of your product is the intended destination. Use these PowerPoint slides for presentations relating to background, blog, business, chain, communication, community, concept, connection, constructive, contact, design, flow, interaction, internet, line, linear, location, logistic, modern, movement, network, path, pointer, reaction, structure, system, team, . The prominent colors used in the PowerPoint template are Green, Gray, and Black There is never a dull moment with our Ppt Background Vertical Steps For Free Idea Strategy 3 Design. They keep it going at fever pitch.
Agile Methodology To Quality Control Effectiveness Tracking Dashboard Ppt Icon Graphics Download PDF
This slide illustrates the KPI dashboard used for tracking the effectiveness of agile quality assurance model. KPIs covered in the dashboard are release and quality compliance, test functions and defects Deliver an awe inspiring pitch with this creative agile methodology to quality control effectiveness tracking dashboard ppt icon graphics download pdf bundle. Topics like agile methodology to quality control effectiveness tracking dashboard can be discussed with this completely editable template. It is available for immediate download depending on the needs and requirements of the user.
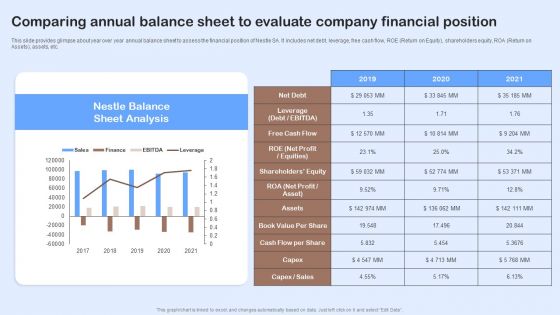
Nestle Performance Management Report Comparing Annual Balance Sheet To Evaluate Download PDF
This slide provides glimpse about year over year annual balance sheet to assess the financial position of Nestle SA. It includes net debt, leverage, free cash flow, ROE Return on Equity, shareholders equity, ROA Return on Assets, assets, etc. Do you have to make sure that everyone on your team knows about any specific topic I yes, then you should give Nestle Performance Management Report Comparing Annual Balance Sheet To Evaluate Download PDF a try. Our experts have put a lot of knowledge and effort into creating this impeccable Nestle Performance Management Report Comparing Annual Balance Sheet To Evaluate Download PDF. You can use this template for your upcoming presentations, as the slides are perfect to represent even the tiniest detail. You can download these templates from the Slidegeeks website and these are easy to edit. So grab these today.
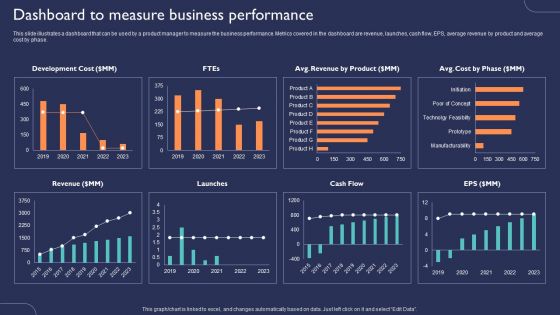
Introduction To New Product Portfolio Dashboard To Measure Business Performance Ppt Ideas Clipart Images PDF
This slide illustrates a dashboard that can be used by a product manager to measure the business performance. Metrics covered in the dashboard are revenue, launches, cash flow, EPS, average revenue by product and average cost by phase. Are you in need of a template that can accommodate all of your creative concepts. This one is crafted professionally and can be altered to fit any style. Use it with Google Slides or PowerPoint. Include striking photographs, symbols, depictions, and other visuals. Fill, move around, or remove text boxes as desired. Test out color palettes and font mixtures. Edit and save your work, or work with colleagues. Download Introduction To New Product Portfolio Dashboard To Measure Business Performance Ppt Ideas Clipart Images PDF and observe how to make your presentation outstanding. Give an impeccable presentation to your group and make your presentation unforgettable.
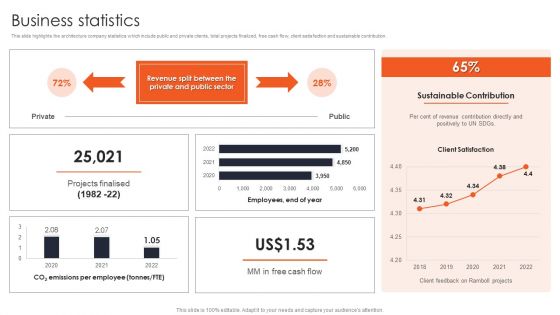
International Design And Architecture Firm Business Statistics Designs PDF
This slide highlights the architecture company statistics which include public and private clients, total projects finalized, free cash flow, client satisfaction and sustainable contribution. Are you in need of a template that can accommodate all of your creative concepts This one is crafted professionally and can be altered to fit any style. Use it with Google Slides or PowerPoint. Include striking photographs, symbols, depictions, and other visuals. Fill, move around, or remove text boxes as desired. Test out color palettes and font mixtures. Edit and save your work, or work with colleagues. Download International Design And Architecture Firm Business Statistics Designs PDF and observe how to make your presentation outstanding. Give an impeccable presentation to your group and make your presentation unforgettable.
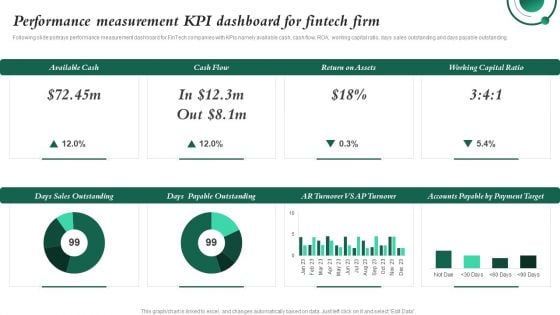
Performance Measurement KPI Dashboard For Fintech Firm Investment In Latest Technology To Ensure Portrait PDF
Following slide portrays performance measurement dashboard for FinTech companies with KPIs namely available cash, cash flow, ROA, working capital ratio, days sales outstanding and days payable outstanding.Whether you have daily or monthly meetings, a brilliant presentation is necessary. Performance Measurement KPI Dashboard For Fintech Firm Investment In Latest Technology To Ensure Portrait PDF can be your best option for delivering a presentation. Represent everything in detail using Performance Measurement KPI Dashboard For Fintech Firm Investment In Latest Technology To Ensure Portrait PDF and make yourself stand out in meetings. The template is versatile and follows a structure that will cater to your requirements. All the templates prepared by Slidegeeks are easy to download and edit. Our research experts have taken care of the corporate themes as well. So, give it a try and see the results.
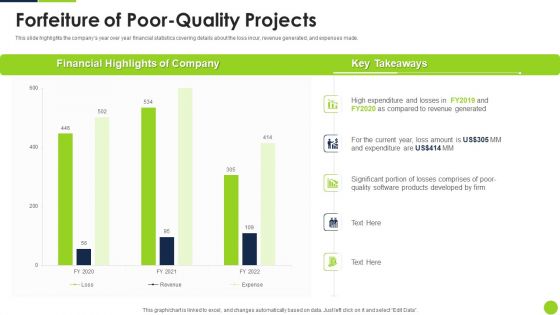
Agile Methodology Quality Control Forfeiture Of Poor Quality Projects Ppt Pictures Introduction PDF
This slide highlights the companys year over year financial statistics covering details about the loss incur, revenue generated, and expenses made. Deliver an awe inspiring pitch with this creative agile methodology quality control forfeiture of poor quality projects ppt pictures introduction pdf bundle. Topics like forfeiture of poor quality projects can be discussed with this completely editable template. It is available for immediate download depending on the needs and requirements of the user.

Agile Methodology Quality Control Reasons Behind Decrease In Revenues Ppt Slides Gridlines PDF
This slide depicts the reasons behind decrease in the number of projects. So, Approximately 50 per cnet of the projects were of poor quality, which eventually lead to decline in revenues. Deliver and pitch your topic in the best possible manner with this agile methodology quality control reasons behind decrease in revenues ppt slides gridlines pdf. Use them to share invaluable insights on reasons behind decrease in revenues and impress your audience. This template can be altered and modified as per your expectations. So, grab it now.

Risk Based Methodology Fault Tree Analysis Method Infographics PDF
This slide covers quality risk management tool such as Fault-tree Analysis for obtaining understanding of the system and problems related to it. This Risk Based Methodology Fault Tree Analysis Method Infographics PDF is perfect for any presentation, be it in front of clients or colleagues. It is a versatile and stylish solution for organizing your meetings. The Risk Based Methodology Fault Tree Analysis Method Infographics PDF features a modern design for your presentation meetings. The adjustable and customizable slides provide unlimited possibilities for acing up your presentation. Slidegeeks has done all the homework before launching the product for you. So, do not wait, grab the presentation templates today
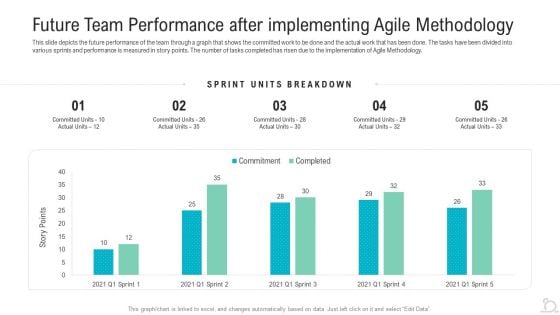
Future Team Performance After Implementing Agile Methodology Elements PDF
This slide depicts the future performance of the team through a graph that shows the committed work to be done and the actual work that has been done. The tasks have been divided into various sprints and performance is measured in story points. The number of tasks completed has risen due to the implementation of Agile Methodology. Deliver and pitch your topic in the best possible manner with this future team performance after implementing agile methodology elements pdf. Use them to share invaluable insights on future team performance after implementing agile methodology and impress your audience. This template can be altered and modified as per your expectations. So, grab it now.
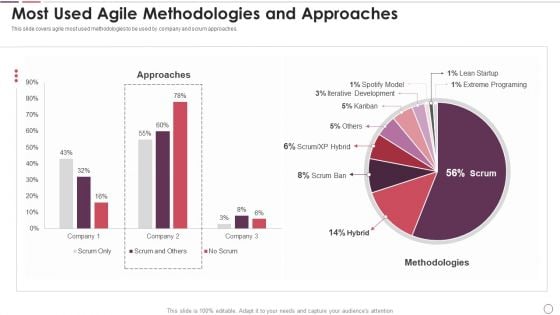
Agile Methodology In Project Management IT Most Used Agile Methodologies And Approaches Inspiration PDF
This slide covers agile most used methodologies to be used by company and scrum approaches. Deliver and pitch your topic in the best possible manner with this agile methodology in project management it most used agile methodologies and approaches inspiration pdf. Use them to share invaluable insights on most used agile methodologies and approaches and impress your audience. This template can be altered and modified as per your expectations. So, grab it now.
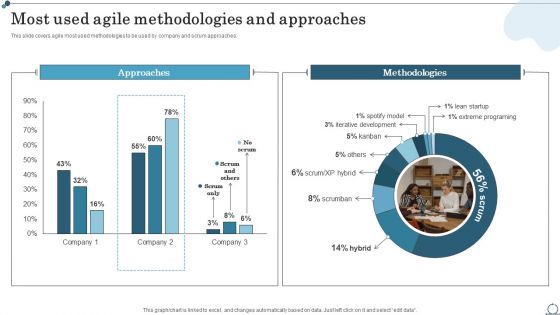
Most Used Agile Methodologies And Approaches Agile IT Methodology In Project Management Template PDF
This slide covers agile most used methodologies to be used by company and scrum approaches. Explore a selection of the finest Most Used Agile Methodologies And Approaches Agile IT Methodology In Project Management Template PDF here. With a plethora of professionally designed and pre-made slide templates, you can quickly and easily find the right one for your upcoming presentation. You can use our Most Used Agile Methodologies And Approaches Agile IT Methodology In Project Management Template PDF to effectively convey your message to a wider audience. Slidegeeks has done a lot of research before preparing these presentation templates. The content can be personalized and the slides are highly editable. Grab templates today from Slidegeeks.
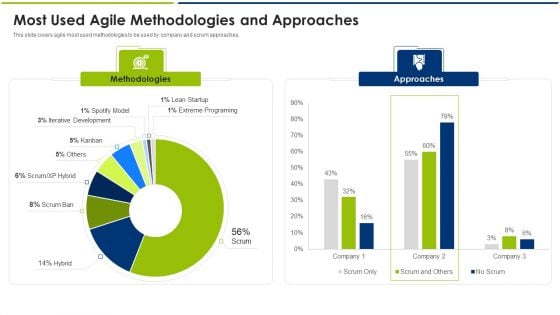
Most Used Agile Methodologies And Approaches Ppt Outline Background PDF
This slide covers agile most used methodologies to be used by company and scrum approaches. Deliver and pitch your topic in the best possible manner with this most used agile methodologies and approaches ppt outline background pdf. Use them to share invaluable insights on most used agile methodologies and approaches and impress your audience. This template can be altered and modified as per your expectations. So, grab it now.
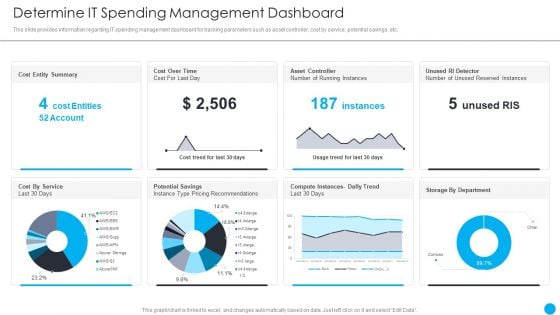
Cios Methodologies To Improve IT Spending Determine It Spending Management Dashboard Professional PDF
This slide provides information regarding IT spending management dashboard for tracking parameters such as asset controller, cost by service, potential savings, etc. Deliver and pitch your topic in the best possible manner with this Cios Methodologies To Improve IT Spending Determine It Spending Management Dashboard Professional PDF Use them to share invaluable insights on Allocated Budget, Across Portfolios, Estimated Cost and impress your audience. This template can be altered and modified as per your expectations. So, grab it now.
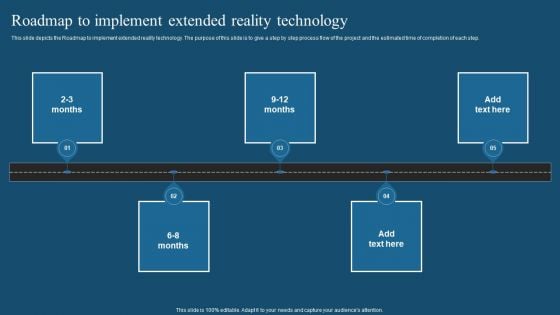
Recent Technologies In IT Industry Roadmap To Implement Extended Reality Technology Structure PDF
This slide depicts the Roadmap to implement extended reality technology. The purpose of this slide is to give a step by step process flow of the project and the estimated time of completion of each step. If you are looking for a format to display your unique thoughts, then the professionally designed Recent Technologies In IT Industry Roadmap To Implement Extended Reality Technology Structure PDF is the one for you. You can use it as a Google Slides template or a PowerPoint template. Incorporate impressive visuals, symbols, images, and other charts. Modify or reorganize the text boxes as you desire. Experiment with shade schemes and font pairings. Alter, share or cooperate with other people on your work. Download Recent Technologies In IT Industry Roadmap To Implement Extended Reality Technology Structure PDF and find out how to give a successful presentation. Present a perfect display to your team and make your presentation unforgettable.
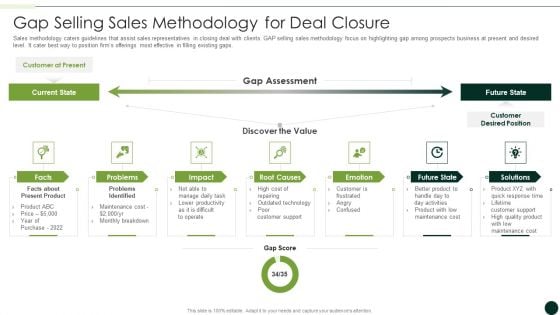
Salesman Principles Playbook Gap Selling Sales Methodology For Deal Closure Introduction PDF
Deliver an awe inspiring pitch with this creative salesman principles playbook gap selling sales methodology for deal closure introduction pdf bundle. Topics like facts about present product, problems identified, future state can be discussed with this completely editable template. It is available for immediate download depending on the needs and requirements of the user.
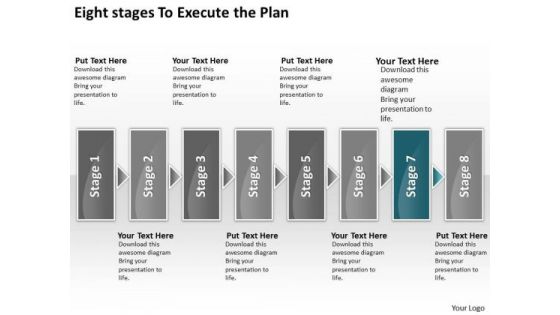
Eight Stages To Execute The Plan Freeware Flowchart PowerPoint Slides
We present our eight stages to execute the plan freeware flowchart PowerPoint Slides.Use our Arrows PowerPoint Templates because you know Coincidentally it will always point to the top. Use our Shapes PowerPoint Templates because displaying your ideas and highlighting your ability will accelerate the growth of your company and yours. Download and present our Business PowerPoint Templates because maximising sales of your product is the intended destination. Download our Boxes PowerPoint Templates because this business powerpoint template helps expound on the logic of your detailed thought process to take your company forward. Use our Communication PowerPoint Templates because it demonstrates the seeds of many of our successes.Use these PowerPoint slides for presentations relating to abstract, action, attach, box, business, center, chain, chart, color, communication, concept, connection, cube, cycle, data, diagram, flow, globe, horizontal, idea, illustration, information, interaction, jigsaw, join, link, pieces, process, puzzle, relation, relationship, shape, success. The prominent colors used in the PowerPoint template are Blue, Gray, White. The feedback we get is that our eight stages to execute the plan freeware flowchart PowerPoint Slides are Functional. PowerPoint presentation experts tell us our chart PowerPoint templates and PPT Slides are Fabulous. People tell us our eight stages to execute the plan freeware flowchart PowerPoint Slides are incredible easy to use. Professionals tell us our chain PowerPoint templates and PPT Slides are readymade to fit into any presentation structure. You can be sure our eight stages to execute the plan freeware flowchart PowerPoint Slides are Magnificent. We assure you our chart PowerPoint templates and PPT Slides are Attractive. Don't let it drag with our Eight Stages To Execute The Plan Freeware Flowchart PowerPoint Slides. They help you keep it crisp and concise.
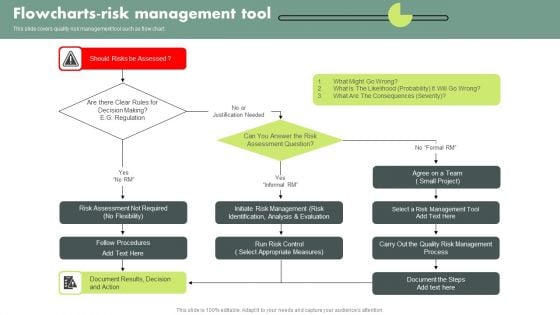
Operational Quality Assurance Flowcharts Risk Management Tool Summary PDF
This slide covers quality risk management tool such as flow chart. This modern and well arranged Operational Quality Assurance Flowcharts Risk Management Tool Summary PDF provides lots of creative possibilities. It is very simple to customize and edit with the Powerpoint Software. Just drag and drop your pictures into the shapes. All facets of this template can be edited with Powerpoint no extra software is necessary. Add your own material, put your images in the places assigned for them, adjust the colors, and then you can show your slides to the world, with an animated slide included.
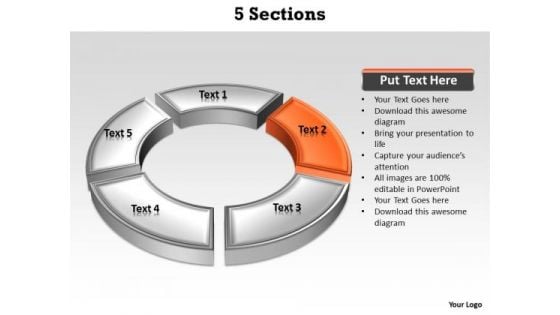
Ppt Orange Section Highlighted In PowerPoint Presentation Circular Manner Templates
PPT orange section highlighted in powerpoint presentation circular manner Templates-This PowerPoint Diagram shows you the five factors responsible for economic growth in Business .It can be used for creating Business presentations where five factors combined to result in one factor. This illustrates orange part of the process.-Can be used for presentations on 5, around, arrows, border, center, circle, circular, concept, connect, connections, curve, cycle, distribution, five, flow, group, illustration, management, middle, objects, plan, process, recycle, rounded, sections, sectors, shape, symbol, vector, workflow-PPT orange section highlighted in powerpoint presentation circular manner Templates Baseless fears can be a bane. Allay them with our Ppt Orange Section Highlighted In PowerPoint Presentation Circular Manner Templates.
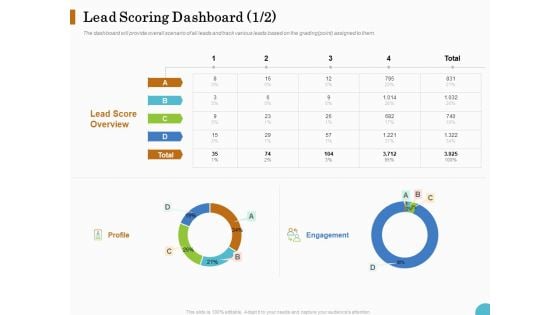
Lead Ranking Sales Methodology Model Lead Scoring Dashboard Profile Ppt PowerPoint Presentation Summary Mockup PDF
Presenting this set of slides with name lead ranking sales methodology model lead scoring dashboard profile ppt powerpoint presentation summary mockup pdf. The topics discussed in these slides are lead score overview, profile, engagement. This is a completely editable PowerPoint presentation and is available for immediate download. Download now and impress your audience.
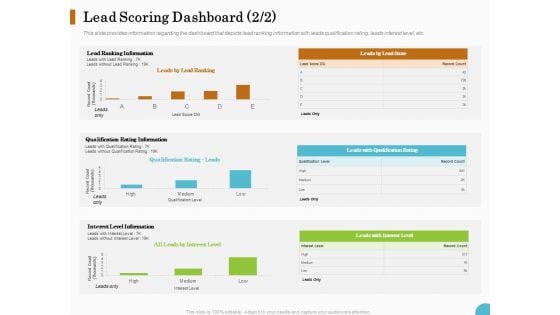
Lead Ranking Sales Methodology Model Lead Scoring Dashboard Information Ppt PowerPoint Presentation Show Picture PDF
Presenting this set of slides with name lead ranking sales methodology model lead scoring dashboard information ppt powerpoint presentation show picture pdf. The topics discussed in these slides are lead ranking information, qualification rating information, interest level information. This is a completely editable PowerPoint presentation and is available for immediate download. Download now and impress your audience.
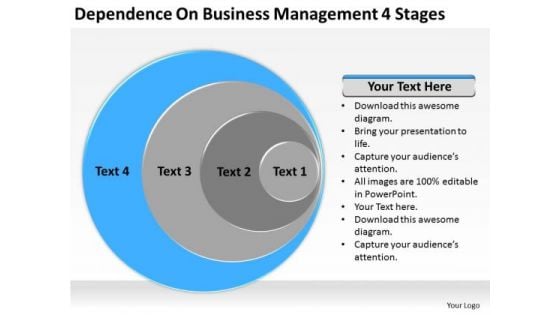
Dependence On Business Management 4 Stages Ppt Plans Sample PowerPoint Templates
We present our dependence on business management 4 stages ppt plans sample PowerPoint templates.Present our Business PowerPoint Templates because Our PowerPoint Templates and Slides are effectively colour coded to prioritise your plans They automatically highlight the sequence of events you desire. Use our Circle Charts PowerPoint Templates because Our PowerPoint Templates and Slides are the chords of your song. String them along and provide the lilt to your views. Use our Layers PowerPoint Templates because Our PowerPoint Templates and Slides will let you Illuminate the road ahead to Pinpoint the important landmarks along the way. Download and present our Circle Charts PowerPoint Templates because Our PowerPoint Templates and Slides will let your words and thoughts hit bullseye everytime. Download and present our Shapes PowerPoint Templates because It can be used to Set your controls for the heart of the sun. Our PowerPoint Templates and Slides will be the propellant to get you there.Use these PowerPoint slides for presentations relating to Diagram, process, business, graphic, design, ideas, model, data, chart, project, schema, corporate, implementation, tag, plan, engineering, concept, vector, success, symbol, stack, circle, guide, work flow, development, shape, team, management, cycle, steps, illustration, system, strategy, objects, phase, professional, organization, implement, background, image, detail, structure, product. The prominent colors used in the PowerPoint template are Blue, Gray, White. Never fail to impress with our Dependence On Business Management 4 Stages Ppt Plans Sample PowerPoint Templates. You will be at the top of your game.
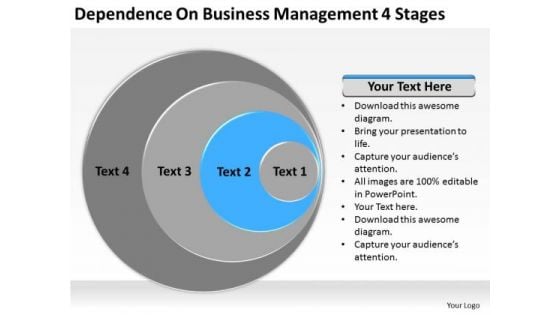
Dependence On Business Management 4 Stages Ppt Plan PowerPoint Templates
We present our dependence on business management 4 stages ppt plan PowerPoint templates.Download and present our Business PowerPoint Templates because Our PowerPoint Templates and Slides are created by a hardworking bunch of busybees. Always flitting around with solutions gauranteed to please. Present our Circle Charts PowerPoint Templates because Our PowerPoint Templates and Slides will give good value for money. They also have respect for the value of your time. Use our Layers PowerPoint Templates because Our PowerPoint Templates and Slides will let you Illuminate the road ahead to Pinpoint the important landmarks along the way. Download and present our Circle Charts PowerPoint Templates because Our PowerPoint Templates and Slides will fulfill your every need. Use them and effectively satisfy the desires of your audience. Download and present our Shapes PowerPoint Templates because Our PowerPoint Templates and Slides provide you with a vast range of viable options. Select the appropriate ones and just fill in your text. Use these PowerPoint slides for presentations relating to Diagram, process, business, graphic, design, ideas, model, data, chart, project, schema, corporate, implementation, tag, plan, engineering, concept, vector, success, symbol, stack, circle, guide, work flow, development, shape, team, management, cycle, steps, illustration, system, strategy, objects, phase, professional, organization, implement, background, image, detail, structure, product. The prominent colors used in the PowerPoint template are Blue, Gray, Black. Our Dependence On Business Management 4 Stages Ppt Plan PowerPoint Templates are designed to excite. Your thoughts will cause much delight.

Dependence On Business Management 4 Stages Ppt Plan PowerPoint Slides
We present our dependence on business management 4 stages ppt plan PowerPoint Slides.Download and present our Business PowerPoint Templates because These PowerPoint Templates and Slides will give the updraft to your ideas. See them soar to great heights with ease. Download and present our Circle Charts PowerPoint Templates because Our PowerPoint Templates and Slides will let your team Walk through your plans. See their energy levels rise as you show them the way. Use our Layers PowerPoint Templates because Our PowerPoint Templates and Slides will let your ideas bloom. Create a bed of roses for your audience. Download our Circle Charts PowerPoint Templates because Our PowerPoint Templates and Slides will let you Clearly mark the path for others to follow. Present our Shapes PowerPoint Templates because our PowerPoint Templates and Slides are the string of your bow. Fire of your ideas and conquer the podium.Use these PowerPoint slides for presentations relating to Diagram, process, business, graphic, design, ideas, model, data, chart, project, schema, corporate, implementation, tag, plan, engineering, concept, vector, success, symbol, stack, circle, guide, work flow, development, shape, team, management, cycle, steps, illustration, system, strategy, objects, phase, professional, organization, implement, background, image, detail, structure, product. The prominent colors used in the PowerPoint template are Green, White, Gray. Fight your battles with our Dependence On Business Management 4 Stages Ppt Plan PowerPoint Slides. You will come out on top.
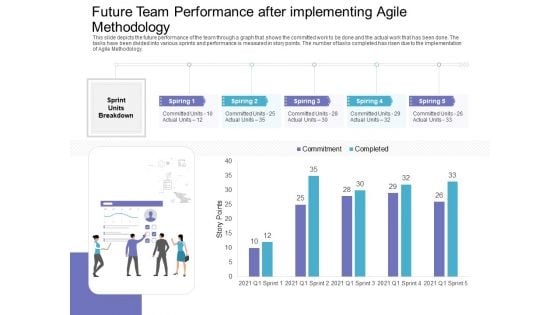
Future Team Performance After Implementing Agile Methodology Diagrams PDF
This slide depicts the future performance of the team through a graph that shows the committed work to be done and the actual work that has been done. The tasks have been divided into various sprints and performance is measured in story points. The number of tasks completed has risen due to the implementation of Agile Methodology. Deliver and pitch your topic in the best possible manner with this future team performance after implementing agile methodology diagrams pdf. Use them to share invaluable insights on future team performance after implementing agile methodology and impress your audience. This template can be altered and modified as per your expectations. So, grab it now.
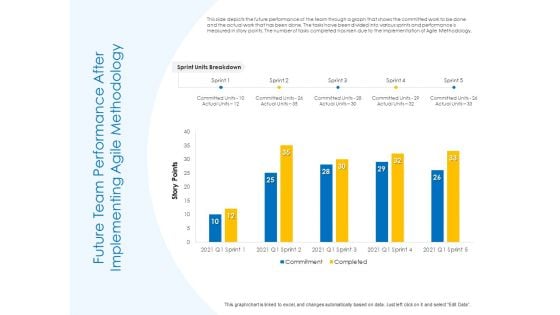
Agile Best Practices For Effective Team Future Team Performance After Implementing Agile Methodology Guidelines PDF
Deliver an awe inspiring pitch with this creative agile best practices for effective team future team performance after implementing agile methodology guidelines pdf bundle. Topics like future team performance after implementing agile methodology can be discussed with this completely editable template. It is available for immediate download depending on the needs and requirements of the user.
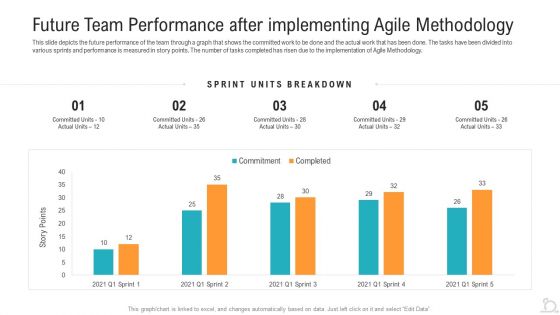
Future Team Performance After Implementing Agile Methodology Information PDF
This slide depicts the future performance of the team through a graph that shows the committed work to be done and the actual work that has been done. The tasks have been divided into various sprints and performance is measured in story points. The number of tasks completed has risen due to the implementation of Agile Methodology.Deliver and pitch your topic in the best possible manner with this future team performance after implementing agile methodology information pdf. Use them to share invaluable insights on future team performance after implementing agile methodology and impress your audience. This template can be altered and modified as per your expectations. So, grab it now.
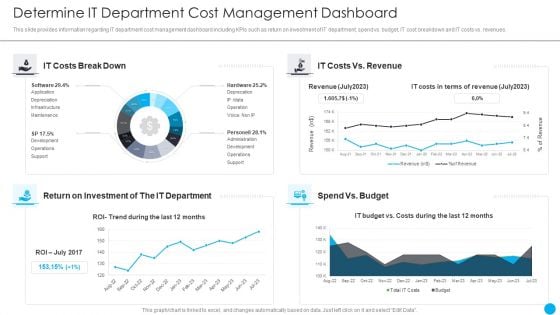
Cios Methodologies To Improve IT Spending Determine It Department Cost Management Dashboard Diagrams PDF
This slide provides information regarding IT department cost management dashboard including KPIs such as return on investment of IT department, spend vs. budget, IT cost breakdown and IT costs vs. revenues. Deliver and pitch your topic in the best possible manner with this Cios Methodologies To Improve IT Spending Determine It Department Cost Management Dashboard Diagrams PDF Use them to share invaluable insights on Extent Organizational, Reprioritization Cancellation, Investment Required and impress your audience. This template can be altered and modified as per your expectations. So, grab it now.
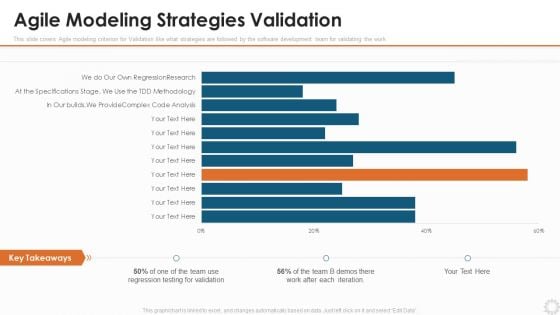
Agile Modelling Methodology IT Agile Modeling Strategies Validation Themes PDF
This slide covers Agile modeling criterion for Validation like what strategies are followed by the software development team for validating the work Deliver an awe inspiring pitch with this creative agile modelling methodology it agile modeling strategies validation themes pdf bundle. Topics like agile modeling strategies validation can be discussed with this completely editable template. It is available for immediate download depending on the needs and requirements of the user.


 Continue with Email

 Home
Home


