Process Infographic
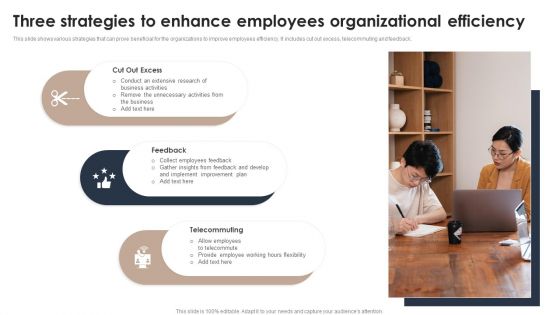
Three Strategies To Enhance Employees Organizational Efficiency Infographics PDF
This slide shows various strategies that can prove beneficial for the organizations to improve employees efficiency. It includes cut out excess, telecommuting and feedback. Persuade your audience using this Three Strategies To Enhance Employees Organizational Efficiency Infographics PDF. This PPT design covers three stages, thus making it a great tool to use. It also caters to a variety of topics including Conduct Extensive, Business Activities, Remove Unnecessary. Download this PPT design now to present a convincing pitch that not only emphasizes the topic but also showcases your presentation skills.
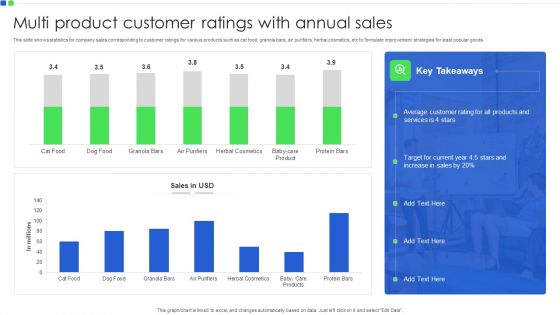
Multi Product Customer Ratings With Annual Sales Infographics PDF
This slide shows statistics for company sales corresponding to customer ratings for various products such as cat food, granola bars, air purifiers, herbal cosmetics, etc to formulate improvement strategies for least popular goods. Showcasing this set of slides titled Multi Product Customer Ratings With Annual Sales Infographics PDF. The topics addressed in these templates are Target For Current Year, Average Customer Rating. All the content presented in this PPT design is completely editable. Download it and make adjustments in color, background, font etc. as per your unique business setting.
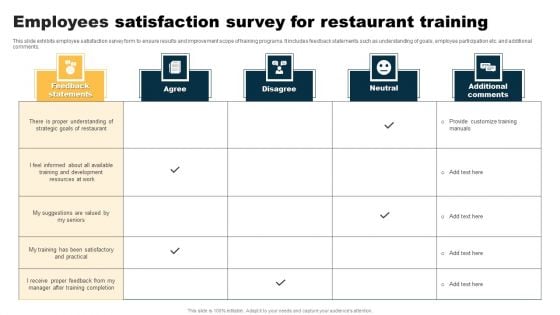
Employees Satisfaction Survey For Restaurant Training Infographics PDF
This slide exhibits employee satisfaction survey form to ensure results and improvement scope of training programs. It includes feedback statements such as understanding of goals, employee participation etc. and additional comments. Pitch your topic with ease and precision using this Employees Satisfaction Survey For Restaurant Training Infographics PDF. This layout presents information on Feedback Statements, Agree, Disagree, Neutral. It is also available for immediate download and adjustment. So, changes can be made in the color, design, graphics or any other component to create a unique layout.
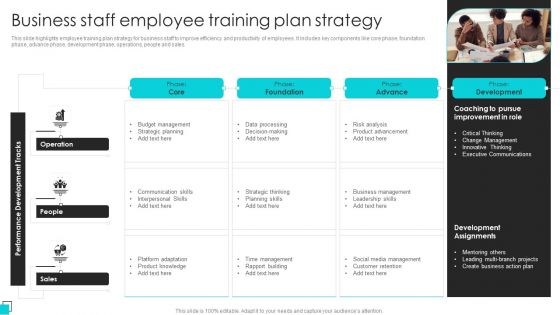
Business Staff Employee Training Plan Strategy Infographics PDF
This slide highlights employee training plan strategy for business staff to improve efficiency and productivity of employees. It includes key components like core phase, foundation phase, advance phase, development phase, operations, people and sales. Presenting Business Staff Employee Training Plan Strategy Infographics PDF to dispense important information. This template comprises Three stages. It also presents valuable insights into the topics including Core, Foundation, Advance. This is a completely customizable PowerPoint theme that can be put to use immediately. So, download it and address the topic impactfully.
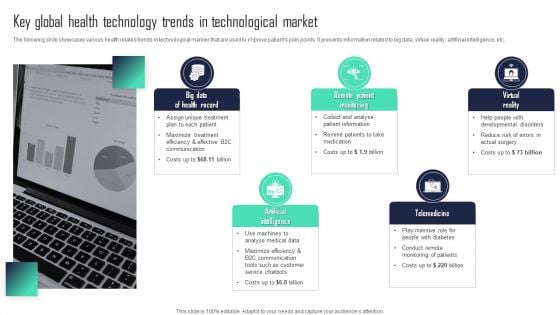
Key Global Health Technology Trends In Technological Market Infographics PDF
The following slide showcases various health related trends in technological manner that are used to improve patients pain points. It presents information related to big data, virtual reality, artificial intelligence, etc. Presenting Key Global Health Technology Trends In Technological Market Infographics PDF to dispense important information. This template comprises five stages. It also presents valuable insights into the topics including Remote Patient Monitoring, Artificial Intelligence, Telemedicine. This is a completely customizable PowerPoint theme that can be put to use immediately. So, download it and address the topic impactfully.

Strategic Advertising Program To Increase University Awareness Infographics PDF
This slide provides university marketing plan which enables marketers to reach wider audience and improve institutes visual identity. It includes goals, target audience, marketing strategies, distribution channels and time duration. Showcasing this set of slides titled Strategic Advertising Program To Increase University Awareness Infographics PDF. The topics addressed in these templates are Goals, Target Audience, Marketing Strategies. All the content presented in this PPT design is completely editable. Download it and make adjustments in color, background, font etc. as per your unique business setting.
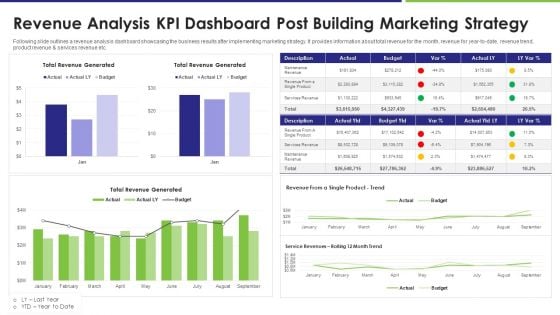
Revenue Analysis KPI Dashboard Post Building Marketing Strategy Infographics PDF
Following slide outlines a revenue analysis dashboard showcasing the business results after implementing marketing strategy. It provides information about total revenue for the month, revenue for year to date, revenue trend, product revenue and services revenue etc. Pitch your topic with ease and precision using this revenue analysis kpi dashboard post building marketing strategy infographics pdf. This layout presents information on revenue analysis kpi dashboard post building marketing strategy. It is also available for immediate download and adjustment. So, changes can be made in the color, design, graphics or any other component to create a unique layout.
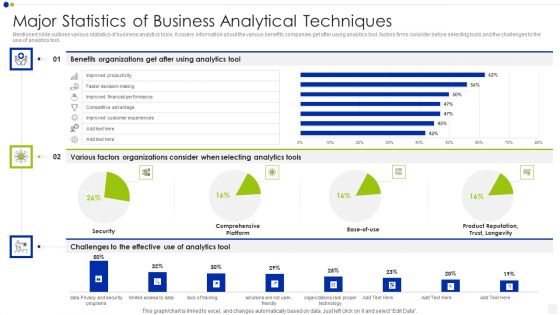
Major Statistics Of Business Analytical Techniques Infographics PDF
Mentioned slide outlines various statistics of business analytics tools. It covers information about the various benefits companies get after using analytics tool, factors firms consider before selecting tools and the challenges to the use of analytics tool. Showcasing this set of slides titled major statistics of business analytical techniques infographics pdf. The topics addressed in these templates are security, analytics, organizations. All the content presented in this PPT design is completely editable. Download it and make adjustments in color, background, font etc. as per your unique business setting.
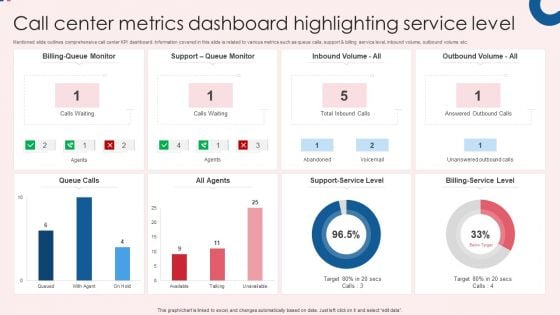
Call Center Metrics Dashboard Highlighting Service Level Infographics PDF
Mentioned slide outlines comprehensive call center KPI dashboard. Information covered in this slide is related to various metrics such as queue calls, support and billing service level, inbound volume, outbound volume etc. Pitch your topic with ease and precision using this Call Center Metrics Dashboard Highlighting Service Level Infographics PDF. This layout presents information on All Agents, Queue Calls, Billing Service Level. It is also available for immediate download and adjustment. So, changes can be made in the color, design, graphics or any other component to create a unique layout.
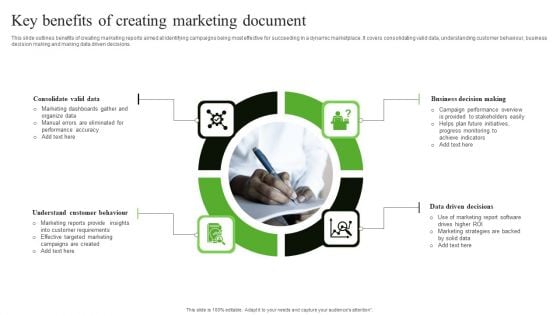
Key Benefits Of Creating Marketing Document Infographics PDF
This slide outlines benefits of creating marketing reports aimed at identifying campaigns being most effective for succeeding in a dynamic marketplace. It covers consolidating valid data, understanding customer behaviour, business decision making and making data driven decisions. Presenting Key Benefits Of Creating Marketing Document Infographics PDF to dispense important information. This template comprises four stages. It also presents valuable insights into the topics including Consolidate Valid Data, Understand Customer Behaviour, Business Decision Making. This is a completely customizable PowerPoint theme that can be put to use immediately. So, download it and address the topic impactfully.
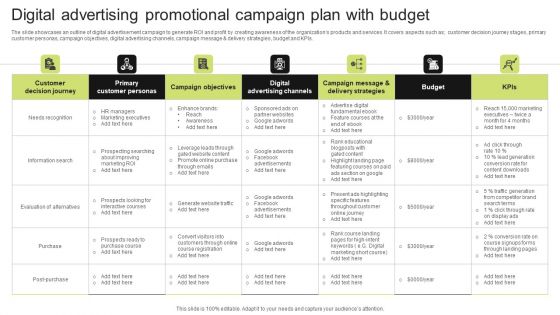
Digital Advertising Promotional Campaign Plan With Budget Infographics PDF
The slide showcases an outline of digital advertisement campaign to generate ROI and profit by creating awareness of the organizations products and services. It covers aspects such as customer decision journey stages, primary customer personas, campaign objectives, digital advertising channels, campaign message and delivery strategies, budget and KPIs. Showcasing this set of slides titled Digital Advertising Promotional Campaign Plan With Budget Infographics PDF. The topics addressed in these templates are Primary Customer Personas, Digital Advertising Channels, Customer Decision Journey. All the content presented in this PPT design is completely editable. Download it and make adjustments in color, background, font etc. as per your unique business setting.
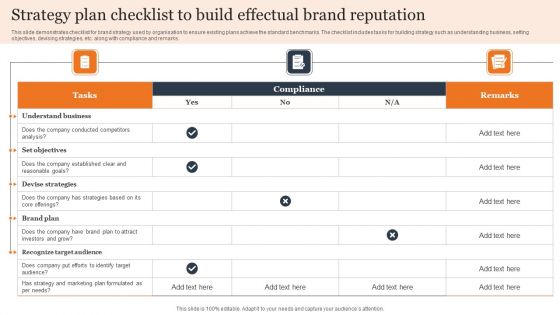
Strategy Plan Checklist To Build Effectual Brand Reputation Infographics PDF
This slide demonstrates checklist for brand strategy used by organisation to ensure existing plans achieve the standard benchmarks. The checklist includes tasks for building strategy such as understanding business, setting objectives, devising strategies, etc. along with compliance and remarks. Pitch your topic with ease and precision using this Strategy Plan Checklist To Build Effectual Brand Reputation Infographics PDF. This layout presents information on Devise Strategies, Recognize Target Audience, Understand Business. It is also available for immediate download and adjustment. So, changes can be made in the color, design, graphics or any other component to create a unique layout.
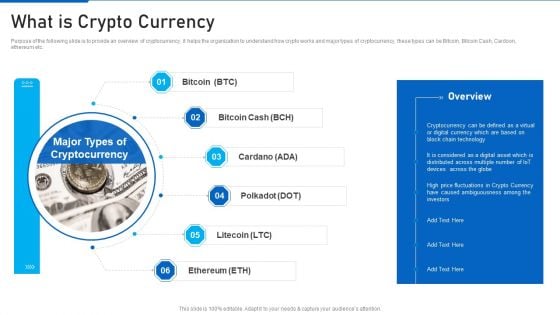
Cryptocurrency Investment Playbook What Is Crypto Currency Infographics PDF
Purpose of the following slide is to provide an overview of cryptocurrency, it helps the organization to understand how crypto works and major types of cryptocurrency, these types can be Bitcoin, Bitcoin Cash, Cardoon, ethereum etc. Presenting cryptocurrency investment playbook what is crypto currency infographics pdf to provide visual cues and insights. Share and navigate important information on six stages that need your due attention. This template can be used to pitch topics like what is crypto currency In addtion, this PPT design contains high resolution images, graphics, etc, that are easily editable and available for immediate download.
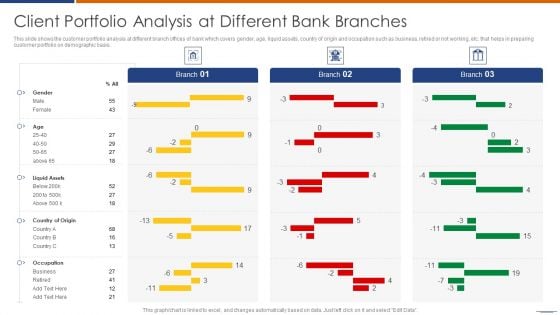
Client Portfolio Analysis At Different Bank Branches Infographics PDF
This slide shows the customer portfolio analysis at different branch offices of bank which covers gender, age, liquid assets, country of origin and occupation such as business, retired or not working, etc. that helps in preparing customer portfolio on demographic basis.Showcasing this set of slides titled Client Portfolio Analysis At Different Bank Branches Infographics PDF The topics addressed in these templates are Client Portfolio, Analysis Different, Bank Branches All the content presented in this PPT design is completely editable. Download it and make adjustments in color, background, font etc. as per your unique business setting.
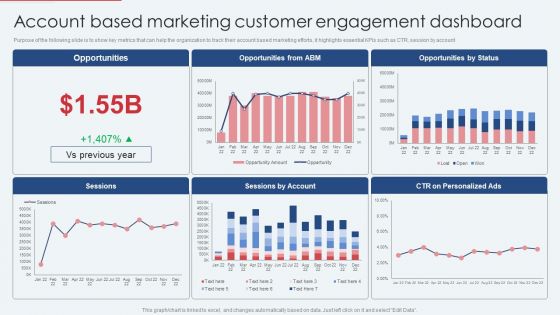
Account Based Marketing Customer Engagement Dashboard Infographics PDF
Purpose of the following slide is to show key metrics that can help the organization to track their account based marketing efforts, it highlights essential KPIs such as CTR, session by account. Boost your pitch with our creative Account Based Marketing Customer Engagement Dashboard Infographics PDF. Deliver an awe inspiring pitch that will mesmerize everyone. Using these presentation templates you will surely catch everyones attention. You can browse the ppts collection on our website. We have researchers who are experts at creating the right content for the templates. So you do not have to invest time in any additional work. Just grab the template now and use them.
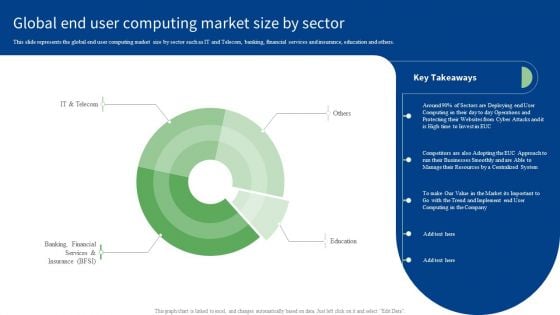
Global End User Computing Market Size By Sector Infographics PDF
This slide represents the global end user computing market size by sector such as IT and Telecom, banking, financial services and insurance, education and others. Boost your pitch with our creative Global End User Computing Market Size By Sector Infographics PDF. Deliver an awe-inspiring pitch that will mesmerize everyone. Using these presentation templates you will surely catch everyones attention. You can browse the ppts collection on our website. We have researchers who are experts at creating the right content for the templates. So you do not have to invest time in any additional work. Just grab the template now and use them.
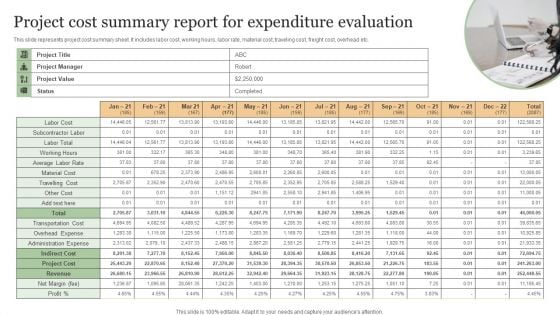
Project Cost Summary Report For Expenditure Evaluation Infographics PDF
This slide represents project cost summary sheet. It includes labor cost, working hours, labor rate, material cost, traveling cost, freight cost, overhead etc. Persuade your audience using this Project Cost Summary Report For Expenditure Evaluation Infographics PDF. This PPT design covers One stage, thus making it a great tool to use. It also caters to a variety of topics including Project Cost Summary, Report For Expenditure Evaluation. Download this PPT design now to present a convincing pitch that not only emphasizes the topic but also showcases your presentation skills.
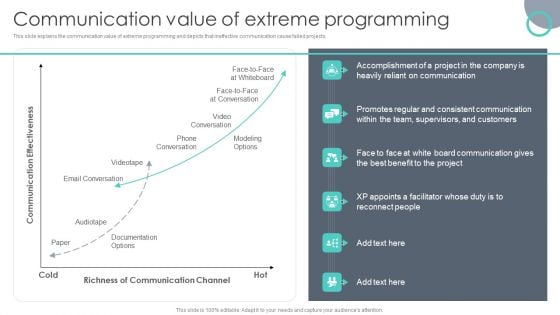
Extreme Programming Methodology Communication Value Of Extreme Programming Infographics PDF
This slide explains the communication value of extreme programming and depicts that ineffective communication cause failed projects. Boost your pitch with our creative Extreme Programming Methodology Communication Value Of Extreme Programming Infographics PDF. Deliver an awe inspiring pitch that will mesmerize everyone. Using these presentation templates you will surely catch everyones attention. You can browse the ppts collection on our website. We have researchers who are experts at creating the right content for the templates. So you do not have to invest time in any additional work. Just grab the template now and use them.
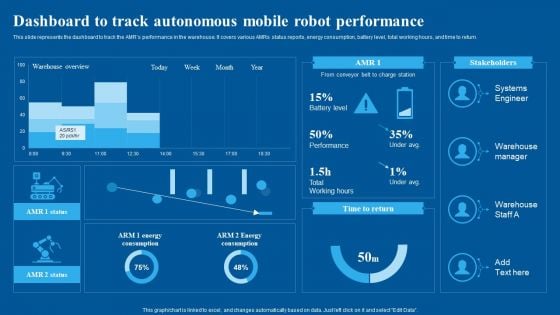
Dashboard To Track Autonomous Mobile Robot Performance Infographics PDF
This slide represents the dashboard to track the AMRs performance in the warehouse. It covers various AMRs status reports, energy consumption, battery level, total working hours, and time to return. Take your projects to the next level with our ultimate collection of Dashboard To Track Autonomous Mobile Robot Performance Infographics PDF. Slidegeeks has designed a range of layouts that are perfect for representing task or activity duration, keeping track of all your deadlines at a glance. Tailor these designs to your exact needs and give them a truly corporate look with your own brand colors they will make your projects stand out from the rest.
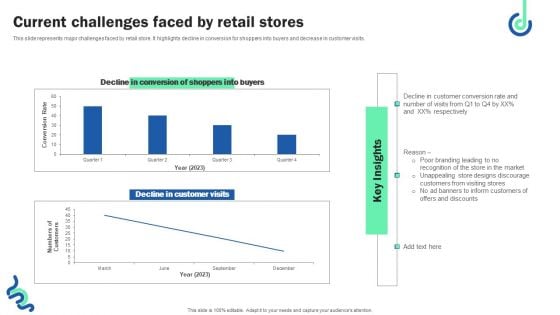
Current Challenges Faced By Retail Stores Infographics PDF
This slide represents major challenges faced by retail store. It highlights decline in conversion for shoppers into buyers and decrease in customer visits. Boost your pitch with our creative Current Challenges Faced By Retail Stores Infographics PDF. Deliver an awe inspiring pitch that will mesmerize everyone. Using these presentation templates you will surely catch everyones attention. You can browse the ppts collection on our website. We have researchers who are experts at creating the right content for the templates. So you do not have to invest time in any additional work. Just grab the template now and use them.
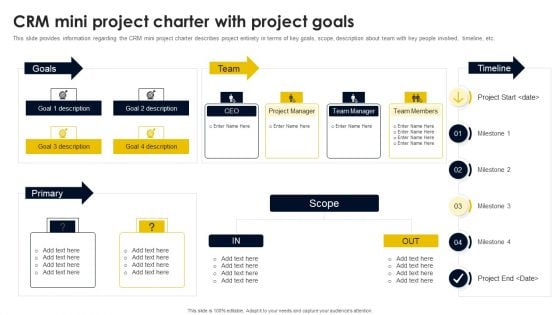
CRM Mini Project Charter With Project Goals Infographics PDF
This slide provides information regarding the CRM mini project charter describes project entirety in terms of key goals, scope, description about team with key people involved, timeline, etc. Boost your pitch with our creative CRM Mini Project Charter With Project Goals Infographics PDF. Deliver an awe-inspiring pitch that will mesmerize everyone. Using these presentation templates you will surely catch everyones attention. You can browse the ppts collection on our website. We have researchers who are experts at creating the right content for the templates. So you do not have to invest time in any additional work. Just grab the template now and use them.
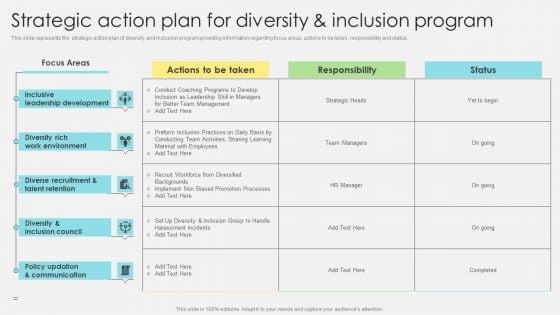
Strategic Action Plan For Diversity And Inclusion Program Infographics PDF
This slide represents the strategic action plan of diversity and inclusion program providing information regarding focus areas, actions to be taken, responsibility and status. Boost your pitch with our creative Strategic Action Plan For Diversity And Inclusion Program Infographics PDF. Deliver an awe inspiring pitch that will mesmerize everyone. Using these presentation templates you will surely catch everyones attention. You can browse the ppts collection on our website. We have researchers who are experts at creating the right content for the templates. So you do not have to invest time in any additional work. Just grab the template now and use them.
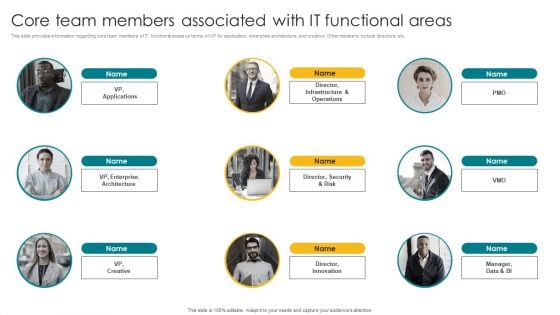
Core Team Members Associated With IT Functional Areas Infographics PDF
This slide provides information regarding core team members of IT functional areas un terms of VP for application, enterprise architecture, and creative. Other members include directors, etc. Boost your pitch with our creative Core Team Members Associated With IT Functional Areas Infographics PDF. Deliver an awe inspiring pitch that will mesmerize everyone. Using these presentation templates you will surely catch everyones attention. You can browse the ppts collection on our website. We have researchers who are experts at creating the right content for the templates. So you do not have to invest time in any additional work. Just grab the template now and use them.
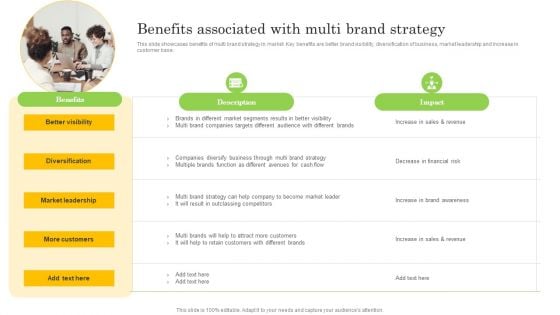
Benefits Associated With Multi Brand Strategy Infographics PDF
This slide showcases benefits of multi brand strategy in market. Key benefits are better brand visibility, diversification of business, market leadership and increase in customer base. Boost your pitch with our creative Benefits Associated With Multi Brand Strategy Infographics PDF. Deliver an awe inspiring pitch that will mesmerize everyone. Using these presentation templates you will surely catch everyones attention. You can browse the ppts collection on our website. We have researchers who are experts at creating the right content for the templates. So you do not have to invest time in any additional work. Just grab the template now and use them.
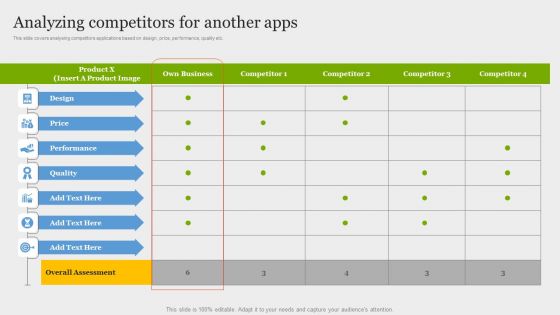
Online Application Development Analyzing Competitors For Another Apps Infographics PDF
This slide covers analysing competitors applications based on design, price, performance, quality etc. Boost your pitch with our creative Online Application Development Analyzing Competitors For Another Apps Infographics PDF. Deliver an awe-inspiring pitch that will mesmerize everyone. Using these presentation templates you will surely catch everyones attention. You can browse the ppts collection on our website. We have researchers who are experts at creating the right content for the templates. So you do not have to invest time in any additional work. Just grab the template now and use them.

Major Factors Of Workflow Inefficiencies In Organization Infographics PDF
This slide provides the major reasons that lead up to workflow inefficiencies in organization. It cover factors such as unessential activities, manual data entry, communication gap, human errors etc. Boost your pitch with our creative Major Factors Of Workflow Inefficiencies In Organization Infographics PDF. Deliver an awe-inspiring pitch that will mesmerize everyone. Using these presentation templates you will surely catch everyones attention. You can browse the ppts collection on our website. We have researchers who are experts at creating the right content for the templates. So you do not have to invest time in any additional work. Just grab the template now and use them.
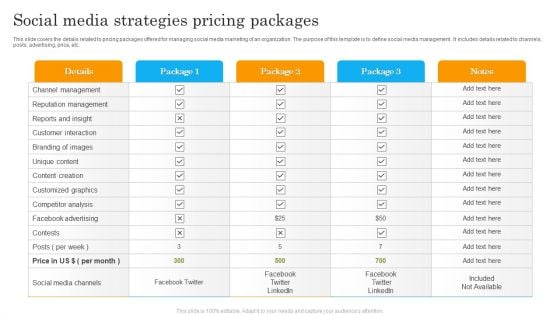
Social Media Strategies Pricing Packages Ppt Infographics Structure PDF
This slide covers the details related to pricing packages offered for managing social media marketing of an organization. The purpose of this template is to define social media management . It includes details related to channels, posts, advertising, price, etc. Showcasing this set of slides titled Social Media Strategies Pricing Packages Ppt Infographics Structure PDF. The topics addressed in these templates are Details, Channel Management, Reputation Management. All the content presented in this PPT design is completely editable. Download it and make adjustments in color, background, font etc. as per your unique business setting.

ITIL Authorization Management Key Performance Indicators Infographics Pdf
This slide showcase KPI indicators which helps in identifying areas of improvement and align all parties involved in access management. It include KPIs such as unauthorized access setting, request access number, revoked instances and deviation in defined security policies. Showcasing this set of slides titled ITIL Authorization Management Key Performance Indicators Infographics Pdf The topics addressed in these templates are Unit Of Measures, Defined Security, Access Management All the content presented in this PPT design is completely editable. Download it and make adjustments in color, background, font etc. as per your unique business setting. This slide showcase KPI indicators which helps in identifying areas of improvement and align all parties involved in access management. It include KPIs such as unauthorized access setting, request access number, revoked instances and deviation in defined security policies.
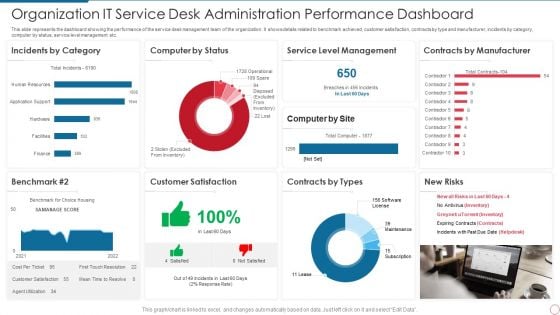
Organization IT Service Desk Administration Performance Dashboard Infographics PDF
This slide represents the dashboard showing the performance of the service desk management team of the organization. It shows details related to benchmark achieved, customer satisfaction, contracts by type and manufacturer, incidents by category, computer by status, service level management etc. Showcasing this set of slides titled Organization IT Service Desk Administration Performance Dashboard Infographics PDF. The topics addressed in these templates are Service, Management, Manufacturer. All the content presented in this PPT design is completely editable. Download it and make adjustments in color, background, font etc. as per your unique business setting.
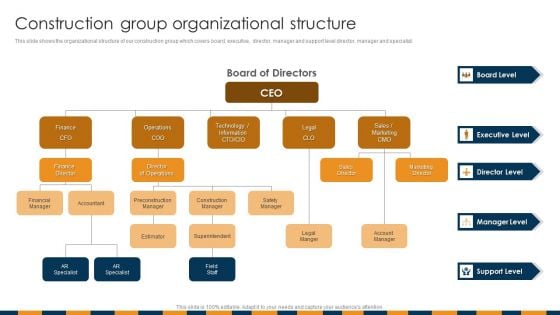
Construction Services Company Profile Construction Group Organizational Structure Infographics PDF
This slide shows the organizational structure of our construction group which covers board, executive, director, manager and support level director, manager and specialist.Presenting Construction Services Company Profile Construction Group Organizational Structure Infographics PDF to provide visual cues and insights. Share and navigate important information on five stages that need your due attention. This template can be used to pitch topics like Financial Manager, Finance Director, Executive Level In addtion, this PPT design contains high resolution images, graphics, etc, that are easily editable and available for immediate download.
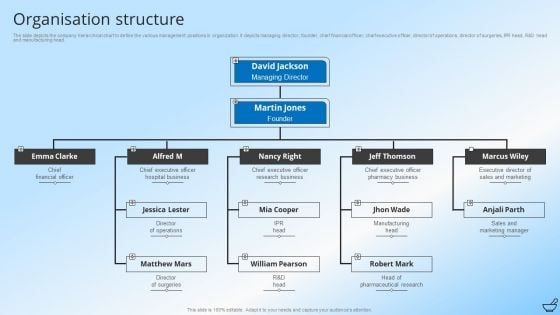
Pharmaceutical And Clinical Research Summary Organisation Structure Infographics PDF
The slide depicts the company hierarchical chart to define the various management positions in organization. It depicts managing director, founder, chief financial officer, chief executive officer, director of operations, director of surgeries, IPR head, R and D head and manufacturing head. This is a Pharmaceutical And Clinical Research Summary Organisation Structure Infographics PDF template with various stages. Focus and dispense information on four stages using this creative set, that comes with editable features. It contains large content boxes to add your information on topics like Sales And Marketing Manager, Manufacturing Head Chief, Financial Officer. You can also showcase facts, figures, and other relevant content using this PPT layout. Grab it now.
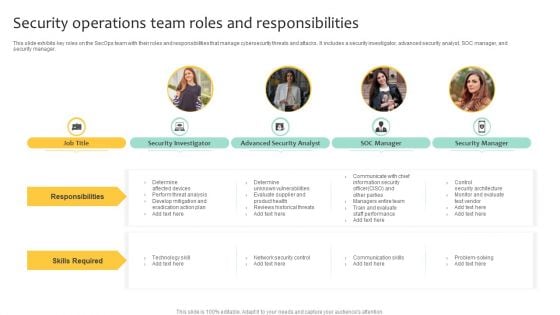
Security Operations Team Roles And Responsibilities Infographics PDF
This slide exhibits key roles on the SecOps team with their roles and responsibilities that manage cybersecurity threats and attacks. It includes a security investigator, advanced security analyst, SOC manager, and security manager. Presenting Security Operations Team Roles And Responsibilities Infographics PDF to dispense important information. This template comprises four stages. It also presents valuable insights into the topics including Skills Required, Determine, Develop Mitigation. This is a completely customizable PowerPoint theme that can be put to use immediately. So, download it and address the topic impactfully.
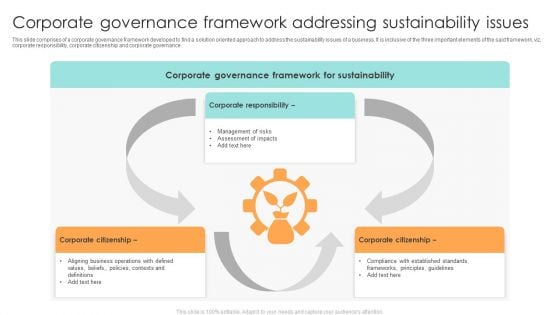
Corporate Governance Framework Addressing Sustainability Issues Ppt Infographics Graphics PDF
This slide comprises of a corporate governance framework developed to find a solution oriented approach to address the sustainability issues of a business. It is inclusive of the three important elements of the said framework, viz, corporate responsibility, corporate citizenship and corporate governance. Presenting Corporate Governance Framework Addressing Sustainability Issues Ppt Infographics Graphics PDF to dispense important information. This template comprises one stages. It also presents valuable insights into the topics including Corporate Responsibility, Corporate Citizenship, Risks Assessment. This is a completely customizable PowerPoint theme that can be put to use immediately. So, download it and address the topic impactfully.
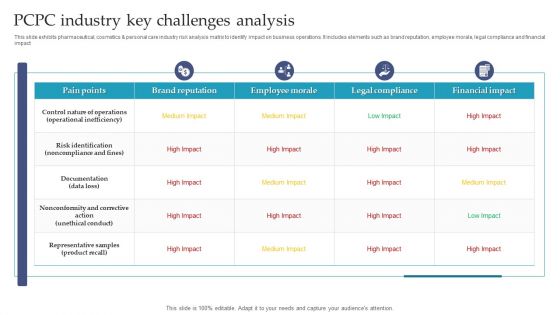
Pcpc Industry Key Challenges Analysis Ppt Infographics Introduction PDF
This slide exhibits pharmaceutical, cosmetics and personal care industry risk analysis matrix to identify impact on business operations. It includes elements such as brand reputation, employee morale, legal compliance and financial impact. Showcasing this set of slides titled Pcpc Industry Key Challenges Analysis Ppt Infographics Introduction PDF. The topics addressed in these templates are Pain Points, Brand Reputation, Employee Morale. All the content presented in this PPT design is completely editable. Download it and make adjustments in color, background, font etc. as per your unique business setting.
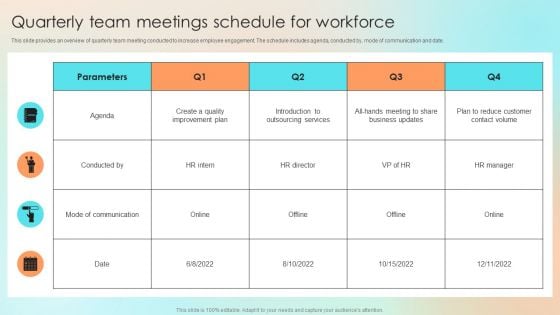
Quarterly Team Meetings Schedule For Workforce Infographics PDF
This slide provides an overview of quarterly team meeting conducted to increase employee engagement. The schedule includes agenda, conducted by, mode of communication and date. The Quarterly Team Meetings Schedule For Workforce Infographics PDF is a compilation of the most recent design trends as a series of slides. It is suitable for any subject or industry presentation, containing attractive visuals and photo spots for businesses to clearly express their messages. This template contains a variety of slides for the user to input data, such as structures to contrast two elements, bullet points, and slides for written information. Slidegeeks is prepared to create an impression.
Online Money Transfer Cost Analysis Sheet Ppt Infographics Icon PDF
The following slide highlights the cost assessment sheet to minimize future expense. It includes elements such as name of service providers, amount transfer, fee charged from sender and recipient etc. Showcasing this set of slides titled Online Money Transfer Cost Analysis Sheet Ppt Infographics Icon PDF. The topics addressed in these templates are Service Provider, Amount Transferred, Total Cost. All the content presented in this PPT design is completely editable. Download it and make adjustments in color, background, font etc. as per your unique business setting.
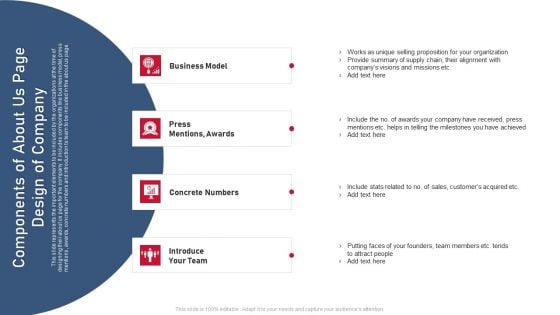
Components Of About Us Page Design Of Company Infographics PDF
This slide represents the important elements to be included by the organizations at the time of designing their about us page for the company. It includes components like business model, press mentions, awards, concrete numbers and introduction to team to be included in the about us page. Pitch your topic with ease and precision using this Components Of About Us Page Design Of Company Infographics PDF. This layout presents information on Selling Proposition, Telling Milestones, Customers Acquired. It is also available for immediate download and adjustment. So, changes can be made in the color, design, graphics or any other component to create a unique layout.
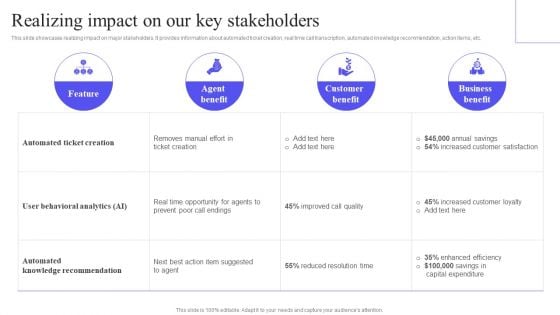
Realizing Impact On Our Key Stakeholders Infographics PDF
This slide showcases realizing impact on major stakeholders. It provides information about automated ticket creation, real time call transcription, automated knowledge recommendation, action items, etc. The Realizing Impact On Our Key Stakeholders Infographics PDF is a compilation of the most recent design trends as a series of slides. It is suitable for any subject or industry presentation, containing attractive visuals and photo spots for businesses to clearly express their messages. This template contains a variety of slides for the user to input data, such as structures to contrast two elements, bullet points, and slides for written information. Slidegeeks is prepared to create an impression.

Before And After Decoy Odd Pricing Tactic Implementation Infographics PDF
This slide showcase decay psychological strategy before and after implementation effect on percentage of buyers availing the service. It includes elements such as web service only, print service only, web print service. Showcasing this set of slides titled Before And After Decoy Odd Pricing Tactic Implementation Infographics PDF. The topics addressed in these templates are Before And After, Decoy Odd Pricing, Tactic Implementation. All the content presented in this PPT design is completely editable. Download it and make adjustments in color, background, font etc. as per your unique business setting.
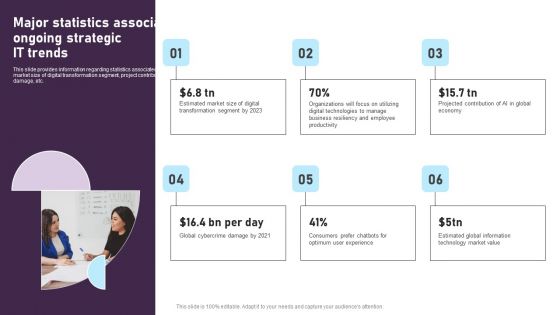
Major Statistics Associated With Ongoing Strategic IT Trends Infographics PDF
This slide provides information regarding statistics associated with ongoing IT trends in terms of market size of digital transformation segment, project contribution of AI, amount of global crime damage, etc. The Major Statistics Associated With Ongoing Strategic IT Trends Infographics PDF is a compilation of the most recent design trends as a series of slides. It is suitable for any subject or industry presentation, containing attractive visuals and photo spots for businesses to clearly express their messages. This template contains a variety of slides for the user to input data, such as structures to contrast two elements, bullet points, and slides for written information. Slidegeeks is prepared to create an impression.

Hotel Administration Software Dashboard For Business Intelligence Infographics PDF
This slide covers HMS dashboard. The purpose of this dashboard is to get an overview of hotel key metrics and to check financial status against targets. It includes elements such as reservations, check in guests, reservation type and housekeeping. Pitch your topic with ease and precision using this Hotel Administration Software Dashboard For Business Intelligence Infographics PDF. This layout presents information on Guest, Housekeeping, Reservation Type. It is also available for immediate download and adjustment. So, changes can be made in the color, design, graphics or any other component to create a unique layout.
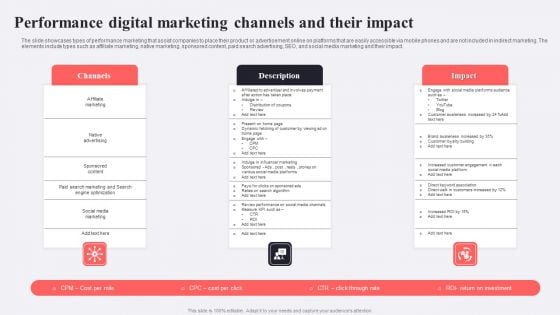
Performance Digital Marketing Channels And Their Impact Infographics PDF
The slide showcases types of performance marketing that assist companies to place their product or advertisement online on platforms that are easily accessible via mobile phones and are not included in indirect marketing. The elements include types such as affiliate marketing, native marketing, sponsored content, paid search advertising, SEO, and social media marketing and their impact. Showcasing this set of slides titled Performance Digital Marketing Channels And Their Impact Infographics PDF. The topics addressed in these templates are Channels, Impact, Affiliate Marketing. All the content presented in this PPT design is completely editable. Download it and make adjustments in color, background, font etc. as per your unique business setting.
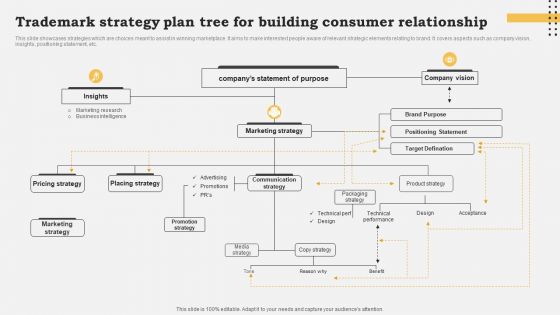
Trademark Strategy Plan Tree For Building Consumer Relationship Infographics PDF
This slide showcases strategies which are choices meant to assist in winning marketplace. It aims to make interested people aware of relevant strategic elements relating to brand. It covers aspects such as company vision, insights, positioning statement, etc. Showcasing this set of slides titled Trademark Strategy Plan Tree For Building Consumer Relationship Infographics PDF. The topics addressed in these templates are Insights, Marketing Strategy, Communication Strategy. All the content presented in this PPT design is completely editable. Download it and make adjustments in color, background, font etc. as per your unique business setting.
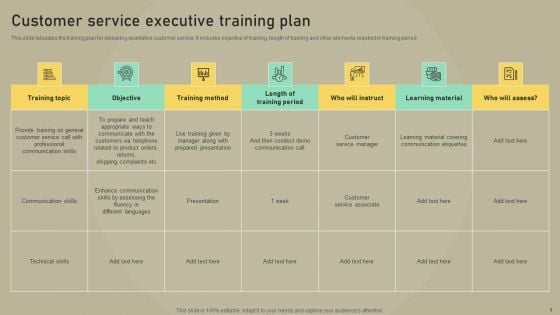
Customer Experience Optimization Customer Service Executive Training Plan Infographics PDF
This slide tabulates the training plan for delivering qualitative customer service. It includes objective of training, length of training and other elements required in training period Take your projects to the next level with our ultimate collection of Customer Experience Optimization Customer Service Executive Training Plan Infographics PDF. Slidegeeks has designed a range of layouts that are perfect for representing task or activity duration, keeping track of all your deadlines at a glance. Tailor these designs to your exact needs and give them a truly corporate look with your own brand colors they will make your projects stand out from the rest.
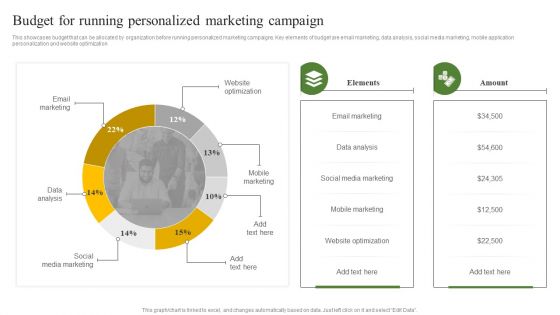
Budget For Running Personalized Marketing Campaign Ppt Infographics Images PDF
This showcases budget that can be allocated by organization before running personalized marketing campaigns. Key elements of budget are email marketing, data analysis, social media marketing, mobile application personalization and website optimization. This Budget For Running Personalized Marketing Campaign Ppt Infographics Images PDF is perfect for any presentation, be it in front of clients or colleagues. It is a versatile and stylish solution for organizing your meetings. The product features a modern design for your presentation meetings. The adjustable and customizable slides provide unlimited possibilities for acing up your presentation. Slidegeeks has done all the homework before launching the product for you. So, do not wait, grab the presentation templates today
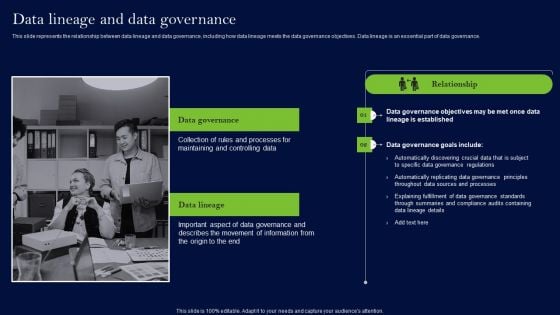
Data Lineage Methods Data Lineage And Data Governance Infographics PDF
This slide represents the relationship between data lineage and data governance, including how data lineage meets the data governance objectives. Data lineage is an essential part of data governance. The Data Lineage Methods Data Lineage And Data Governance Infographics PDF is a compilation of the most recent design trends as a series of slides. It is suitable for any subject or industry presentation, containing attractive visuals and photo spots for businesses to clearly express their messages. This template contains a variety of slides for the user to input data, such as structures to contrast two elements, bullet points, and slides for written information. Slidegeeks is prepared to create an impression.

Tactical Group Map For Determining Competitors Infographics PDF
The following highlights strategic group map for industrial competition analysis and revenue generation measurement. It includes elements such as- sales of electric vehicle, company position and breadth of offerings. Showcasing this set of slides titled Tactical Group Map For Determining Competitors Infographics PDF. The topics addressed in these templates are Breadth Offerings, Lowest Sales Electric, Determining Competitors. All the content presented in this PPT design is completely editable. Download it and make adjustments in color, background, font etc. as per your unique business setting.
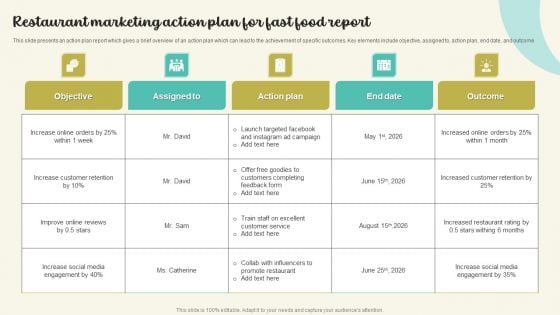
Restaurant Marketing Action Plan For Fast Food Report Infographics PDF
This slide presents an action plan report which gives a brief overview of an action plan which can lead to the achievement of specific outcomes. Key elements include objective, assigned to, action plan, end date, and outcome. Pitch your topic with ease and precision using this Restaurant Marketing Action Plan For Fast Food Report Infographics PDF. This layout presents information on Increase Social Media, Increase Customer Retention, Action Plan. It is also available for immediate download and adjustment. So, changes can be made in the color, design, graphics or any other component to create a unique layout.
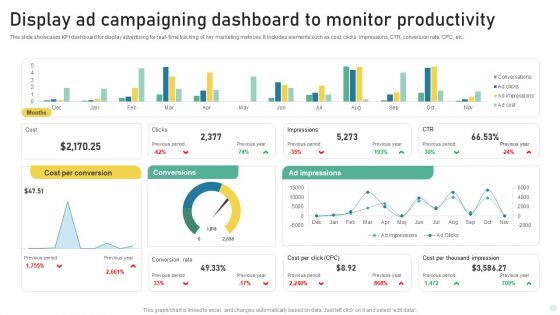
Display Ad Campaigning Dashboard To Monitor Productivity Infographics PDF
This slide showcases KPI dashboard for display advertising for real- time tracking of key marketing metrices, It includes elements such as cost, clicks, impressions, CTR, conversion rate, CPC, etc. Showcasing this set of slides titled Display Ad Campaigning Dashboard To Monitor Productivity Infographics PDF. The topics addressed in these templates are Cost Per Conversion, Conversions, Ad Impressions. All the content presented in this PPT design is completely editable. Download it and make adjustments in color, background, font etc. as per your unique business setting.
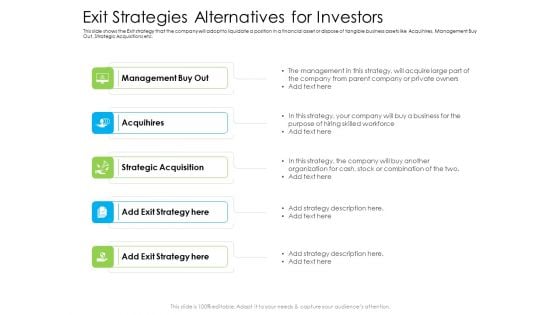
Exit Strategies Alternatives For Investors Ppt Infographics Background PDF
This slide shows the Exit strategy that the company will adopt to liquidate a position in a financial asset or dispose of tangible business assets like Acquihires, Management Buy Out, Strategic Acquisitions etc. Presenting exit strategies alternatives for investors ppt infographics background pdf to provide visual cues and insights. Share and navigate important information on five stages that need your due attention. This template can be used to pitch topics like strategic acquisition, acquihires, management buy out. In addition, this PPT design contains high-resolution images, graphics, etc, that are easily editable and available for immediate download.
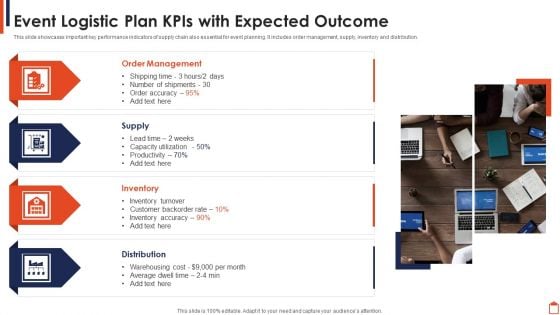
Event Logistic Plan Kpis With Expected Outcome Infographics PDF
This slide showcases important key performance indicators of supply chain also essential for event planning. It includes order management, supply, inventory and distribution.Persuade your audience using this Event Logistic Plan Kpis With Expected Outcome Infographics PDF This PPT design covers four stages, thus making it a great tool to use. It also caters to a variety of topics including Order Management, Inventory Turnover, Distribution Download this PPT design now to present a convincing pitch that not only emphasizes the topic but also showcases your presentation skills.
Healthcare Services Company Profile Organization Structure Infographics PDF
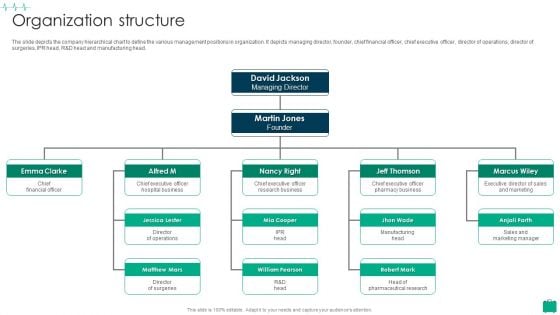
The slide depicts the company hierarchical chart to define the various management positions in organization. It depicts managing director, founder, chief financial officer, chief executive officer, director of operations, director of surgeries, IPR head, R and D head and manufacturing head.This is a Healthcare Services Company Profile Organization Structure Infographics PDF template with various stages. Focus and dispense information on five stages using this creative set, that comes with editable features. It contains large content boxes to add your information on topics like Hospital Business, Research Business, Pharmacy Business You can also showcase facts, figures, and other relevant content using this PPT layout. Grab it now.
CRM Implementation Strategy CRM Training Program For Employees Infographics PDF
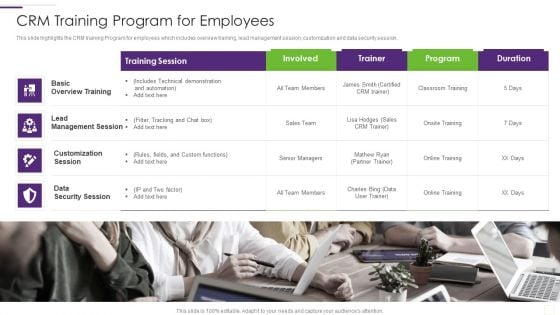
This slide highlights the CRM training Program for employees which includes overview training, lead management session, customization and data security session.This is a CRM Implementation Strategy CRM Training Program For Employees Infographics PDF template with various stages. Focus and dispense information on one stage using this creative set, that comes with editable features. It contains large content boxes to add your information on topics like Management Session, Customization Session, Overview Training You can also showcase facts, figures, and other relevant content using this PPT layout. Grab it now.
Requirements For Successful Common Data Environment Ppt Infographics Summary PDF
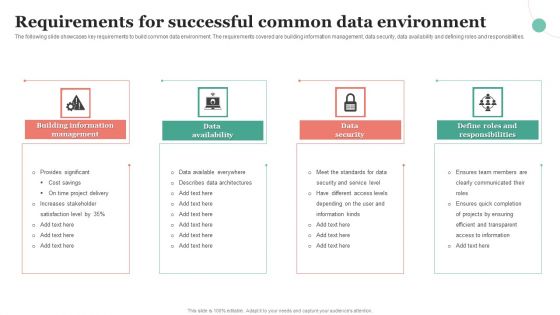
The following slide showcases key requirements to build common data environment. The requirements covered are building information management, data security, data availability and defining roles and responsibilities. Presenting Requirements For Successful Common Data Environment Ppt Infographics Summary PDF to dispense important information. This template comprises four stages. It also presents valuable insights into the topics including Building Information Management, Data Availability, Data Security. This is a completely customizable PowerPoint theme that can be put to use immediately. So, download it and address the topic impactfully.
Revenue Generated From Operations Administration In It Services Infographics PDF
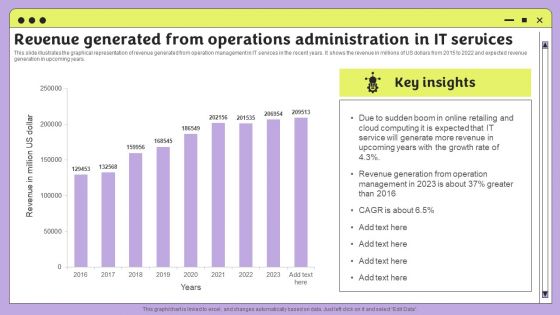
This slide illustrates the graphical representation of revenue generated from operation management in IT services in the recent years. It shows the revenue in millions of US dollars from 2015 to 2022 and expected revenue generation in upcoming years. Pitch your topic with ease and precision using this Revenue Generated From Operations Administration In It Services Infographics PDF. This layout presents information on Revenue, Management, Cloud Computing. It is also available for immediate download and adjustment. So, changes can be made in the color, design, graphics or any other component to create a unique layout.
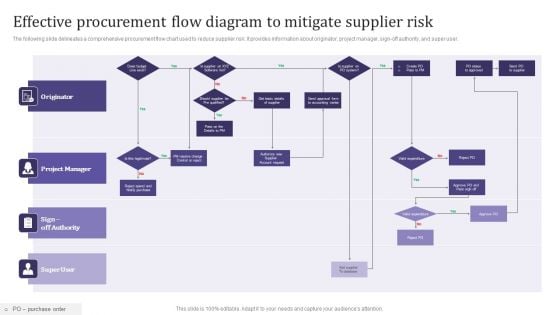
Effective Procurement Flow Diagram To Mitigate Supplier Risk Infographics PDF
The following slide delineates a comprehensive procurement flow chart used to reduce supplier risk. It provides information about originator, project manager, sign-off authority, and super user. Persuade your audience using this Effective Procurement Flow Diagram To Mitigate Supplier Risk Infographics PDF. This PPT design covers four stages, thus making it a great tool to use. It also caters to a variety of topics including Project Manager, Originator, Super User. Download this PPT design now to present a convincing pitch that not only emphasizes the topic but also showcases your presentation skills.
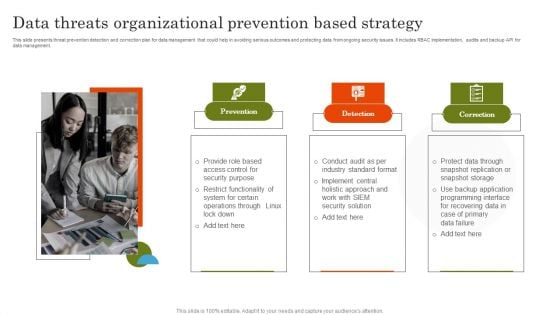
Data Threats Organizational Prevention Based Strategy Infographics PDF
This slide presents threat prevention detection and correction plan for data management that could help in avoiding serious outcomes and protecting data from ongoing security issues. It includes RBAC implementation, audits and backup API for data management. Increase audience engagement and knowledge by dispensing information using Data Threats Organizational Prevention Based Strategy Infographics PDF. This template helps you present information on three stages. You can also present information on Prevention, Detection, Correction using this PPT design. This layout is completely editable so personaize it now to meet your audiences expectations.
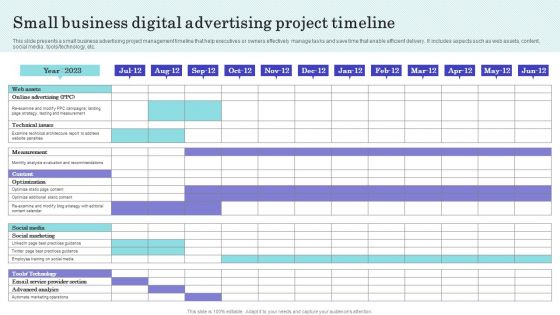
Small Business Digital Advertising Project Timeline Infographics PDF
This slide presents a small business advertising project management timeline that help executives or owners effectively manage tasks and save time that enable efficient delivery. It includes aspects such as web assets, content, social media , tools technology, etc. Pitch your topic with ease and precision using this Small Business Digital Advertising Project Timeline Infographics PDF. This layout presents information on Timeline, Small, Digital. It is also available for immediate download and adjustment. So, changes can be made in the color, design, graphics or any other component to create a unique layout.
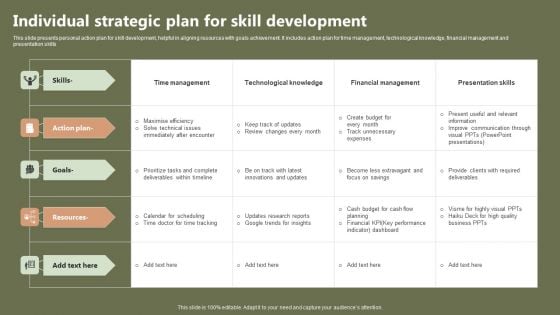
Individual Strategic Plan For Skill Development Infographics PDF
This slide presents personal action plan for skill development, helpful in aligning resources with goals achievement. It includes action plan for time management, technological knowledge, financial management and presentation skills. Pitch your topic with ease and precision using this Individual Strategic Plan For Skill Development Infographics PDF. This layout presents information on Action Plan, Goals, Resources. It is also available for immediate download and adjustment. So, changes can be made in the color, design, graphics or any other component to create a unique layout.
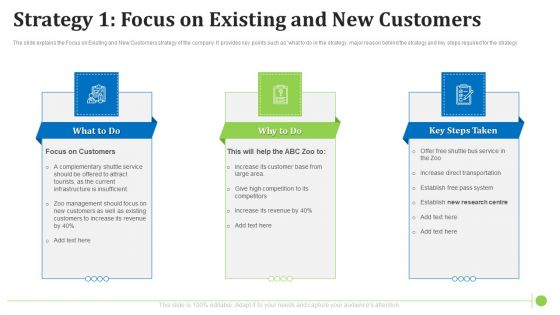
Strategy 1 Focus On Existing And New Customers Infographics PDF
The slide explains the Focus on Existing and New Customers strategy of the company. It provides key points such as what to do in the strategy, major reason behind the strategy and key steps required for the strategy. Presenting strategy 1 focus on existing and new customers infographics pdf to provide visual cues and insights. Share and navigate important information on three stages that need your due attention. This template can be used to pitch topics like service, customers, management, revenue. In addtion, this PPT design contains high resolution images, graphics, etc, that are easily editable and available for immediate download.


 Continue with Email

 Home
Home


