Procurement Planning Dashboards
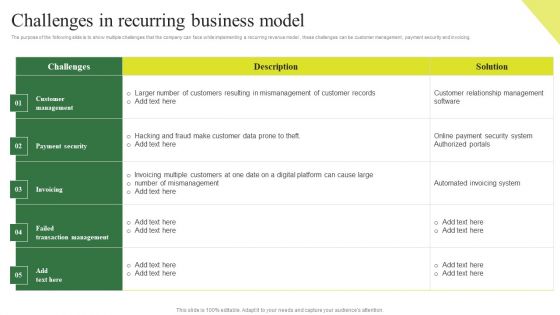
Consumption Based Pricing Model Challenges In Recurring Business Model Slides PDF
The purpose of the following slide is to show multiple challenges that the company can face while implementing a recurring revenue model , these challenges can be customer management, payment security and invoicing. Make sure to capture your audiences attention in your business displays with our gratis customizable Consumption Based Pricing Model Business Performance Dashboard Demonstration PDF. These are great for business strategies, office conferences, capital raising or task suggestions. If you desire to acquire more customers for your tech business and ensure they stay satisfied, create your own sales presentation with these plain slides.
Developing Significant Business Product And Customer Performance Tracking Clipart PDF
This slide provides information regarding dashboard utilized by firm to monitor performance of products offered and customer associated. The performance is tracked through revenues generated, new customer acquired, customer satisfaction, sales comparison, etc. Deliver and pitch your topic in the best possible manner with this Developing Significant Business Product And Customer Performance Tracking Clipart PDF. Use them to share invaluable insights on Revenue, New Customer, Revenue and impress your audience. This template can be altered and modified as per your expectations. So, grab it now.

Inventory Management Summary By Production Team Summary Designs PDF
This slide shows the dashboard representing the analysis of the inventory management report prepared by the production team manager. It includes information related to total no. of sales, inventory, suppliers, accounts payable etc. Pitch your topic with ease and precision using this Inventory Management Summary By Production Team Summary Designs PDF. This layout presents information on Days Inventory Outstanding, Inventory Value By Item. It is also available for immediate download and adjustment. So, changes can be made in the color, design, graphics or any other component to create a unique layout.
Magnifying Glass Ppt PowerPoint Presentation Outline Graphic Tips
This is a magnifying glass ppt powerpoint presentation outline graphic tips. This is a six stage process. The stages in this process are sales, magnifying glass, business, marketing, technology.
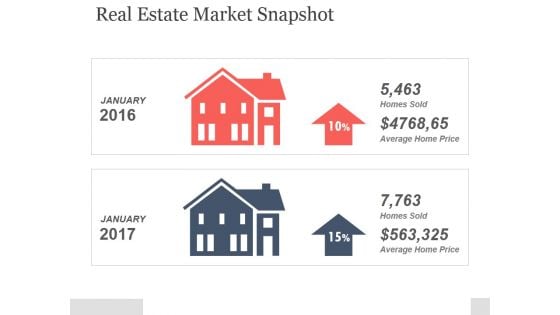
Real Estate Market Snapshot Ppt PowerPoint Presentation Model
This is a real estate market snapshot ppt powerpoint presentation model. This is a two stage process. The stages in this process are real estate, market snapshot, business, marketing, success.

Scorecard Table With Kpi PowerPoint Presentation Template
Brace Yourself, Arm Your Thoughts. Prepare For The Hustle With Our Scorecard Table With KPI PowerPoint Presentation Template Powerpoint Templates. Generate Ecstasy With Our Marketing Plan Powerpoint Templates. Your Thoughts Will Delight Your Audience.
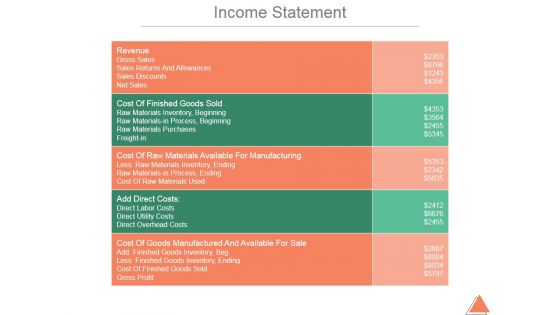
Income Statement Ppt PowerPoint Presentation Background Images
This is a income statement ppt powerpoint presentation background images. This is a five stage process. The stages in this process are revenue, gross sales, sales returns and allowances, sales discounts, net sales.
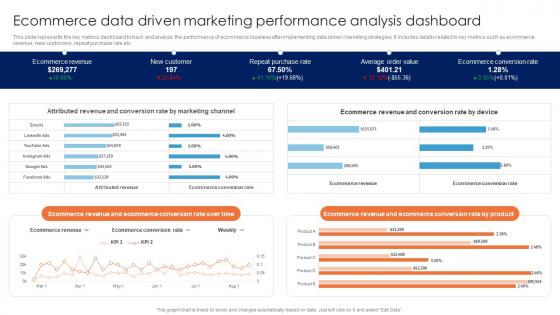
Ecommerce Data Driven Marketing Performance Guide For Data Driven Advertising Brochure Pdf
This slide represents the key metrics dashboard to track and analyze the performance of ecommerce business after implementing data driven marketing strategies. It includes details related to key metrics such as ecommerce revenue, new customers, repeat purchase rate etc.Here you can discover an assortment of the finest PowerPoint and Google Slides templates. With these templates, you can create presentations for a variety of purposes while simultaneously providing your audience with an eye-catching visual experience. Download Ecommerce Data Driven Marketing Performance Guide For Data Driven Advertising Brochure Pdf to deliver an impeccable presentation. These templates will make your job of preparing presentations much quicker, yet still, maintain a high level of quality. Slidegeeks has experienced researchers who prepare these templates and write high-quality content for you. Later on, you can personalize the content by editing the Ecommerce Data Driven Marketing Performance Guide For Data Driven Advertising Brochure Pdf. This slide represents the key metrics dashboard to track and analyze the performance of ecommerce business after implementing data driven marketing strategies. It includes details related to key metrics such as ecommerce revenue, new customers, repeat purchase rate etc.
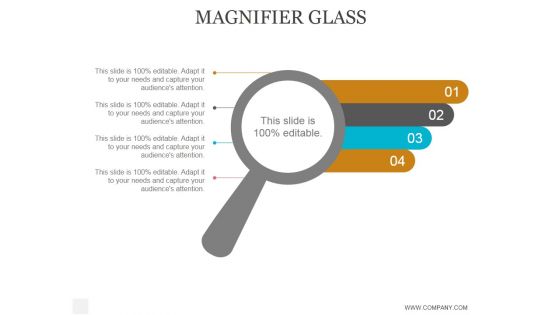
Magnifier Glass Ppt PowerPoint Presentation Visual Aids
This is a magnifier glass ppt powerpoint presentation visual aids. This is a four stage process. The stages in this process are business, strategy, marketing, analysis, success, magnifier glass.

Magnifying Glass Ppt PowerPoint Presentation Gallery Example Introduction
This is a magnifying glass ppt powerpoint presentation gallery example introduction. This is a one stage process. The stages in this process are business, strategy, marketing, analysis, magnifying glass.
Social Media Performance Tracking Sales Performance Enhancement Infographics Pdf
The following slide showcases a dashboard to track and measure social media platforms performance. It includes key elements such as website traffic, social media referral rate, site revenue, social media site revenue, etc. Here you can discover an assortment of the finest PowerPoint and Google Slides templates. With these templates, you can create presentations for a variety of purposes while simultaneously providing your audience with an eye catching visual experience. Download Social Media Performance Tracking Sales Performance Enhancement Infographics Pdf to deliver an impeccable presentation. These templates will make your job of preparing presentations much quicker, yet still, maintain a high level of quality. Slidegeeks has experienced researchers who prepare these templates and write high quality content for you. Later on, you can personalize the content by editing the Social Media Performance Tracking Sales Performance Enhancement Infographics Pdf. The following slide showcases a dashboard to track and measure social media platforms performance. It includes key elements such as website traffic, social media referral rate, site revenue, social media site revenue, etc.
Monthly Sales Performance Tracking Sales Performance Enhancement Background Pdf
This slide showcases a dashboard presenting various metrics to measure and analyze sales performance for revenue growth. It includes key components such as number of sales, revenue, profit, cost, sales revenue, sales increment, cost analysis and cross sell. Coming up with a presentation necessitates that the majority of the effort goes into the content and the message you intend to convey. The visuals of a PowerPoint presentation can only be effective if it supplements and supports the story that is being told. Keeping this in mind our experts created Monthly Sales Performance Tracking Sales Performance Enhancement Background Pdf to reduce the time that goes into designing the presentation. This way, you can concentrate on the message while our designers take care of providing you with the right template for the situation. This slide showcases a dashboard presenting various metrics to measure and analyze sales performance for revenue growth. It includes key components such as number of sales, revenue, profit, cost, sales revenue, sales increment, cost analysis and cross sell.

Analysis Of Ecommerce Sales In Power BI Ppt Slide SS
This slide showcases dashboard for customer segmentation analysis. This template aims to provide opportunities to focus on more customers for selling cosmetics products and can be used to predict business growth. It helps business organization to enhance revenue from sales by focusing on the profit margins. Create an editable Analysis Of Ecommerce Sales In Power BI Ppt Slide SS that communicates your idea and engages your audience. Whether you are presenting a business or an educational presentation, pre-designed presentation templates help save time. Analysis Of Ecommerce Sales In Power BI Ppt Slide SS is highly customizable and very easy to edit, covering many different styles from creative to business presentations. Slidegeeks has creative team members who have crafted amazing templates. So, go and get them without any delay. This slide showcases dashboard for customer segmentation analysis. This template aims to provide opportunities to focus on more customers for selling cosmetics products and can be used to predict business growth. It helps business organization to enhance revenue from sales by focusing on the profit margins.
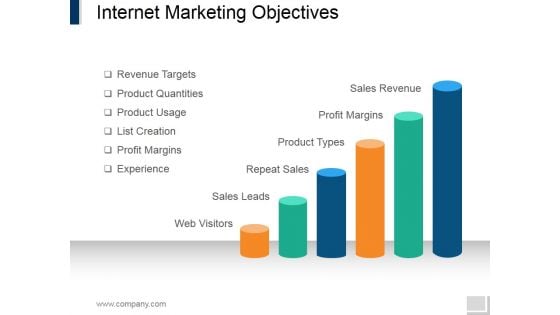
Internet Marketing Objectives Ppt PowerPoint Presentation Summary Portrait
This is a internet marketing objectives ppt powerpoint presentation summary portrait. This is a six stage process. The stages in this process are sales revenue, profit margins, product types, repeat sales, sales leads, web visitors.
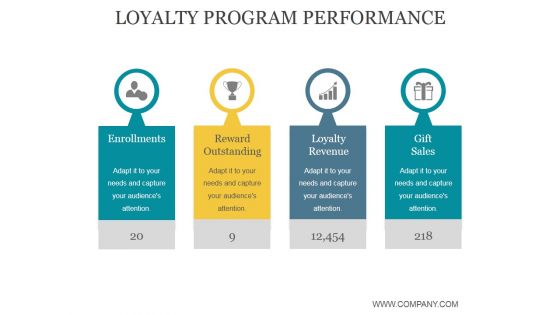
Loyalty Program Performance Ppt PowerPoint Presentation Portfolio
This is a loyalty program performance ppt powerpoint presentation portfolio. This is a four stage process. The stages in this process are enrollments, reward outstanding, loyalty revenue, gift sales.
Influencers Marketing Campaign Performance Tracking Word Of Mouth Marketing Ideas Pdf
This slide covers performance monitoring dashboard of influencer based referral marketing program. It includes elements such as impressions on Instagram, likes, comments, clicks, sales generated along with value calculators and campaign breakdown based on gender and age.Formulating a presentation can take up a lot of effort and time, so the content and message should always be the primary focus. The visuals of the PowerPoint can enhance the presenters message, so our Influencers Marketing Campaign Performance Tracking Word Of Mouth Marketing Ideas Pdf was created to help save time. Instead of worrying about the design, the presenter can concentrate on the message while our designers work on creating the ideal templates for whatever situation is needed. Slidegeeks has experts for everything from amazing designs to valuable content, we have put everything into Influencers Marketing Campaign Performance Tracking Word Of Mouth Marketing Ideas Pdf. This slide covers performance monitoring dashboard of influencer based referral marketing program. It includes elements such as impressions on Instagram, likes, comments, clicks, sales generated along with value calculators and campaign breakdown based on gender and age.
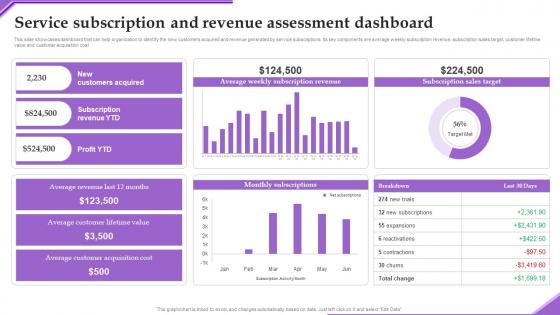
Service Subscription Revenue Adverting New Sarvice Via Social Network Platform Demonstration Pdf
This slide showcases dashboard that can help organization to identify the new customers acquired and revenue generated by service subscriptions. Its key components are average weekly subscription revenue, subscription sales target, customer lifetime value and customer acquisition cost Explore a selection of the finest Service Subscription Revenue Adverting New Sarvice Via Social Network Platform Demonstration Pdf here. With a plethora of professionally designed and pre made slide templates, you can quickly and easily find the right one for your upcoming presentation. You can use our Service Subscription Revenue Adverting New Sarvice Via Social Network Platform Demonstration Pdf to effectively convey your message to a wider audience. Slidegeeks has done a lot of research before preparing these presentation templates. The content can be personalized and the slides are highly editable. Grab templates today from Slidegeeks. This slide showcases dashboard that can help organization to identify the new customers acquired and revenue generated by service subscriptions. Its key components are average weekly subscription revenue, subscription sales target, customer lifetime value and customer acquisition cost
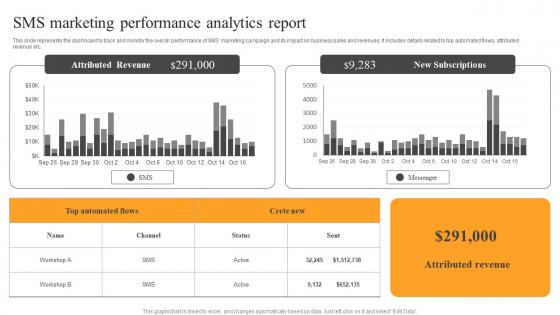
SMS Marketing Performance Analytics Text Message Advertising Solutions Enhancing Microsoft Pdf
This slide represents the dashboard to track and monitor the overall performance of SMS marketing campaign and its impact on business sales and revenues. It includes details related to top automated flows, attributed revenue etc. Do you have an important presentation coming up Are you looking for something that will make your presentation stand out from the rest Look no further than SMS Marketing Performance Analytics Text Message Advertising Solutions Enhancing Microsoft Pdf With our professional designs, you can trust that your presentation will pop and make delivering it a smooth process. And with Slidegeeks, you can trust that your presentation will be unique and memorable. So why wait Grab SMS Marketing Performance Analytics Text Message Advertising Solutions Enhancing Microsoft Pdf today and make your presentation stand out from the rest This slide represents the dashboard to track and monitor the overall performance of SMS marketing campaign and its impact on business sales and revenues. It includes details related to top automated flows, attributed revenue etc.
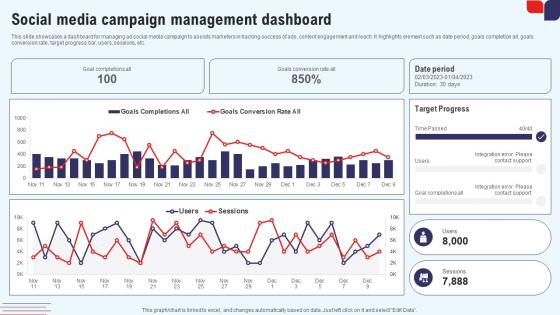
Efficient Marketing Process For Business Social Media Campaign Management Themes Pdf
This slide showcases a dashboard for managing ad social media campaign to assists marketers in tracking success of ads, content engagement and reach. It highlights element such as date period, goals completion all, goals conversion rate, target progress bar, users, sessions, etc. Slidegeeks is here to make your presentations a breeze with Efficient Marketing Process For Business Social Media Campaign Management Themes Pdf With our easy-to-use and customizable templates, you can focus on delivering your ideas rather than worrying about formatting. With a variety of designs to choose from, you are sure to find one that suits your needs. And with animations and unique photos, illustrations, and fonts, you can make your presentation pop. So whether you are giving a sales pitch or presenting to the board, make sure to check out Slidegeeks first. This slide showcases a dashboard for managing ad social media campaign to assists marketers in tracking success of ads, content engagement and reach. It highlights element such as date period, goals completion all, goals conversion rate, target progress bar, users, sessions, etc.

Sales Kpi Performance Summary Ppt PowerPoint Presentation Infographic Template Infographics
This is a sales kpi performance summary ppt powerpoint presentation infographic template infographics. This is a seven stage process. The stages in this process are revenue comparison, quantity comparison, product sales mix, regional sales mix.
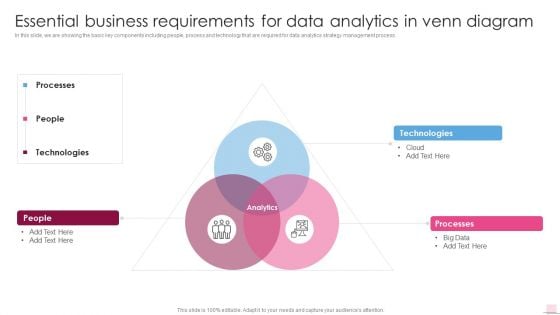
Essential Business Requirements For Data Analytics Business Analysis Modification Toolkit Topics PDF
In this slide, we are showing the basic key components including people, process and technology that are required for data analytics strategy management process.This is a Essential Business Requirements For Data Analytics Business Analysis Modification Toolkit Topics PDF template with various stages. Focus and dispense information on three stages using this creative set, that comes with editable features. It contains large content boxes to add your information on topics like Technologies, Processes, Technologies. You can also showcase facts, figures, and other relevant content using this PPT layout. Grab it now.
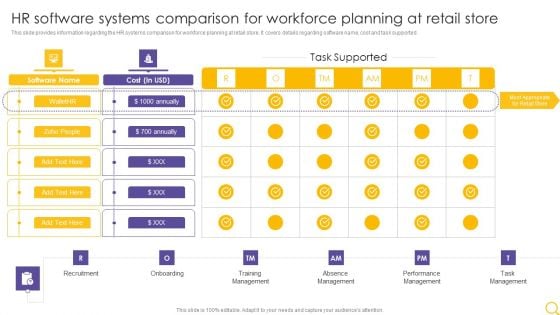
Retail Outlet Operational Efficiency Analytics HR Software Systems Comparison For Workforce Infographics PDF
This slide provides information regarding the HR systems comparison for workforce planning at retail store. It covers details regarding software name, cost and task supported. Deliver and pitch your topic in the best possible manner with this Retail Outlet Operational Efficiency Analytics HR Software Systems Comparison For Workforce Infographics PDF. Use them to share invaluable insights on Performance Management, Task Management, Absence Management and impress your audience. This template can be altered and modified as per your expectations. So, grab it now.
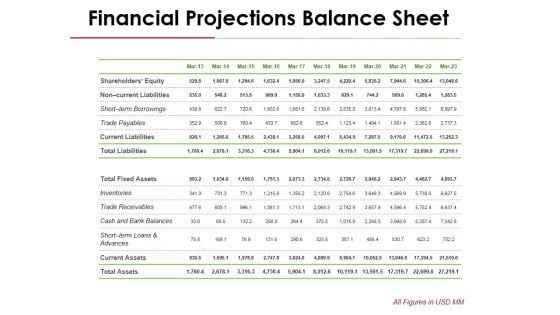
Financial Projections Balance Sheet Ppt PowerPoint Presentation Gallery Show
This is a financial projections balance sheet ppt powerpoint presentation gallery show. This is a two stage process. The stages in this process are non current liabilities, short term borrowings, trade payables, inventories, trade receivables.
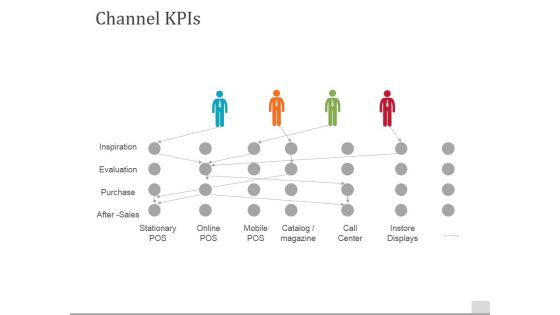
Channel Kpis Template 2 Ppt PowerPoint Presentation Show Designs
This is a channel kpis template 2 ppt powerpoint presentation show designs. This is a four stage process. The stages in this process are channel kpis, inspiration, evaluation, purchase, stationary pos.
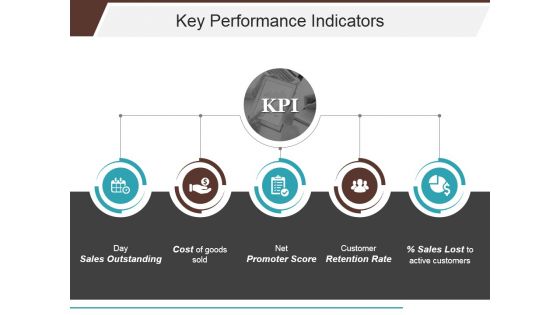
Key Performance Indicators Template 1 Ppt PowerPoint Presentation Portfolio Background Image
This is a key performance indicators template 1 ppt powerpoint presentation portfolio background image. This is a five stage process. The stages in this process are sales outstanding, cost of goods sold, net promoter score, customer retention rate, sales lost to active customers.
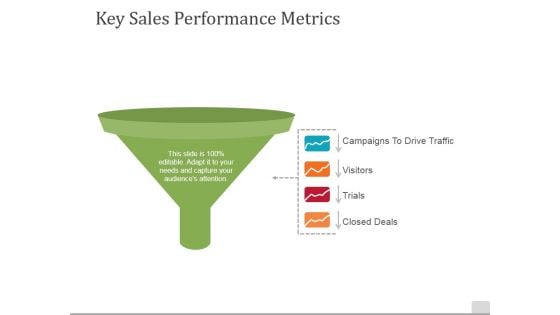
Key Sales Performance Metrics Ppt PowerPoint Presentation Slides Designs
This is a key sales performance metrics ppt powerpoint presentation slides designs. This is a four stage process. The stages in this process are campaigns to drive traffic, visitors, trials, closed deals.
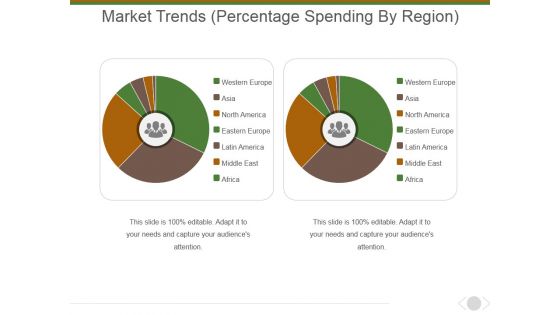
Market Trends Percentage Spending By Region Ppt PowerPoint Presentation Inspiration Graphic Images
This is a market trends percentage spending by region ppt powerpoint presentation inspiration graphic images. This is a two stage process. The stages in this process are western europe, asia, north america, eastern europe, latin america, middle east.
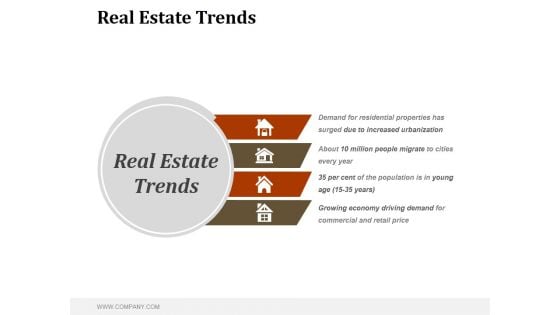
Real Estate Trends Ppt PowerPoint Presentation Examples
This is a real estate trends ppt powerpoint presentation examples. This is a four stage process. The stages in this process are business, marketing, management, trends, innovation.
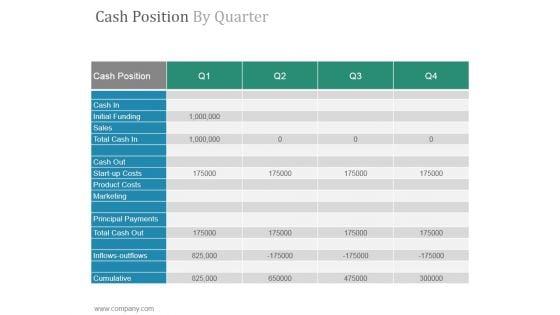
Cash Position By Quarter Ppt PowerPoint Presentation Outline
This is a cash position by quarter ppt powerpoint presentation outline. This is a four stage process. The stages in this process are cash position, cash in, initial funding, sales, total cash in.

Financial Projections Income Statement Ppt PowerPoint Presentation Inspiration Vector
This is a financial projections income statement ppt powerpoint presentation inspiration vector. This is a four stage process. The stages in this process are net sales, expenses, cost of goods sold, employee benefit expense, financing cost.
Agenda Ppt PowerPoint Presentation Professional Inspiration
This is a agenda ppt powerpoint presentation professional inspiration. This is a six stage process. The stages in this process are business, strategy, marketing, analysis, agenda.
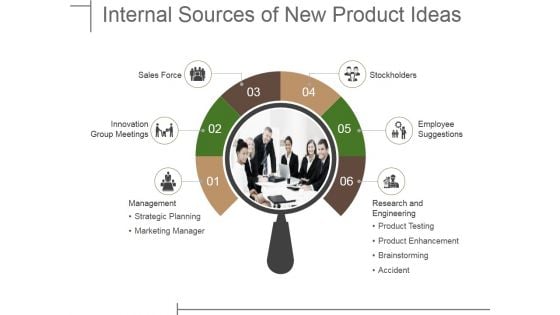
Internal Sources Of New Product Ideas Ppt PowerPoint Presentation Infographics Graphics Download
This is a internal sources of new product ideas ppt powerpoint presentation infographics graphics download. This is a six stage process. The stages in this process are sales force, innovation group meetings, management, stockholders, employee suggestions.

Financial Projections And Key Metrics Ppt PowerPoint Presentation Styles Skills
This is a financial projections and key metrics ppt powerpoint presentation styles skills. This is a five stage process. The stages in this process are expenses, profits, sales, employees, years.

Media Kpis Performance Evaluation Ppt PowerPoint Presentation Information
This is a media kpis performance evaluation ppt powerpoint presentation information. This is a three stage process. The stages in this process are traffic, engagement, conversion.
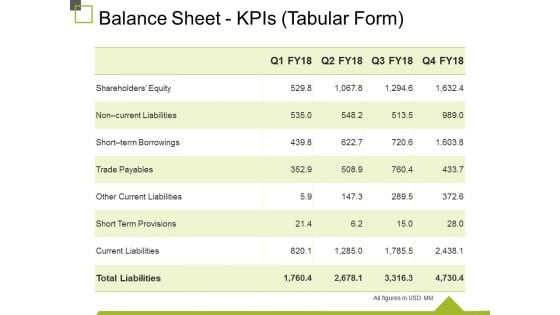
Balance Sheet Kpis Tabular Form Ppt PowerPoint Presentation Gallery Example
This is a balance sheet kpis tabular form ppt powerpoint presentation gallery example. This is a four stage process. The stages in this process are trade payables, other current liabilities, short term provisions, current liabilities, total liabilities.
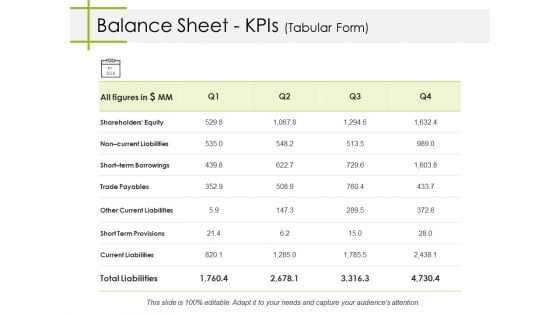
Balance Sheet Kpis Tabular Form Ppt PowerPoint Presentation Pictures Gridlines
This is a balance sheet kpis tabular form ppt powerpoint presentation pictures gridlines. This is a four stage process. The stages in this process are trade payables, other current liabilities, short term provisions, current liabilities, short term borrowings.
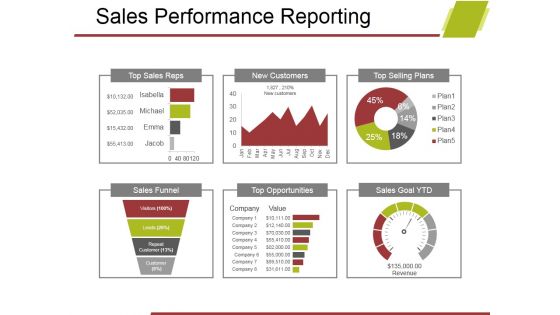
Sales Performance Reporting Ppt PowerPoint Presentation Gallery Introduction
This is a sales performance reporting ppt powerpoint presentation gallery introduction. This is a six stage process. The stages in this process are top sales reps, new customers, top selling plans, sales funnel, opportunities, sales goal ytd.
Post It Ppt PowerPoint Presentation Show
This is a post it ppt powerpoint presentation show. This is a four stage process. The stages in this process are business, strategy, marketing, analysis, post it.
Post It Ppt PowerPoint Presentation Gallery Templates
This is a post it ppt powerpoint presentation gallery templates. This is a three stage process. The stages in this process are business, strategy, marketing, analysis, post it.
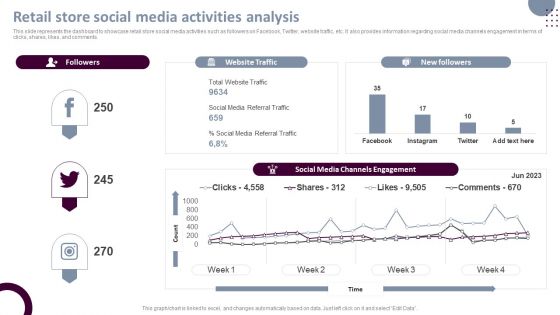
Retail Store Operations Retail Store Social Media Activities Analysis Clipart PDF
This slide represents the dashboard to showcase retail store social media activities such as followers on Facebook, Twitter, website traffic, etc. It also provides information regarding social media channels engagement in terms of clicks, shares, likes, and comments. Crafting an eye-catching presentation has never been more straightforward. Let your presentation shine with this tasteful yet straightforward Retail Store Operations Retail Store Social Media Activities Analysis Clipart PDF template. It offers a minimalistic and classy look that is great for making a statement. The colors have been employed intelligently to add a bit of playfulness while still remaining professional. Construct the ideal Retail Store Operations Retail Store Social Media Activities Analysis Clipart PDF that effortlessly grabs the attention of your audience Begin now and be certain to wow your customers.

P And L Kpis Ppt PowerPoint Presentation Portfolio Slide
This is a p and l kpis ppt powerpoint presentation portfolio slide. This is a four stage process. The stages in this process are ebitda, profit before tax, profit after tax, expenses, net sales.
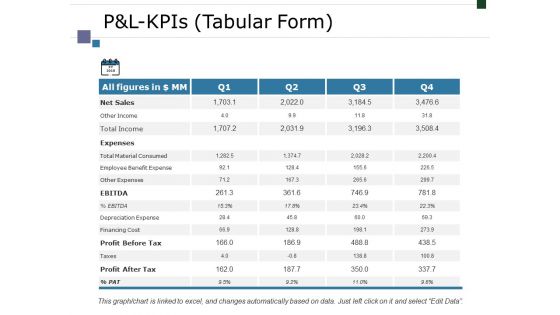
Pandl Kpis Tabular Form Ppt PowerPoint Presentation Outline Background
This is a pandl kpis tabular form ppt powerpoint presentation outline background. This is a four stage process. The stages in this process are net sales, expenses, ebitda, profit before tax, profit after tax.

Balance Sheet Kpis Tabular Form Template 1 Ppt PowerPoint Presentation Pictures Tips
This is a balance sheet kpis tabular form template 1 ppt powerpoint presentation pictures tips. This is a four stage process. The stages in this process are noncurrent liabilities, short term borrowings, trade payables, other current liabilities, short term provisions.

Balance Sheet Kpis Tabular Form Cont Ppt PowerPoint Presentation Model Graphics Tutorials
This is a balance sheet kpis tabular form cont ppt powerpoint presentation model graphics tutorials. This is a four stage process. The stages in this process are long term loans and advances, current investments, inventories, trade receivables.
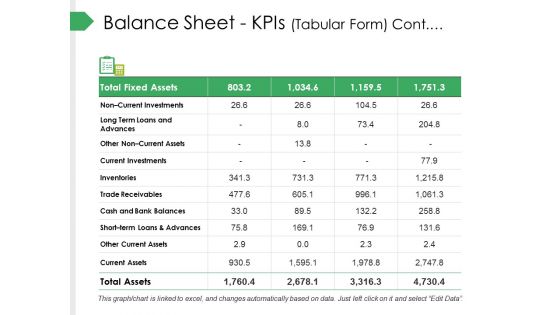
Balance Sheet Kpis Tabular Form Cont Ppt PowerPoint Presentation Summary Templates
This is a balance sheet kpis tabular form cont ppt powerpoint presentation summary templates. This is a four stage process. The stages in this process are current investments, inventories, trade receivables, cash and bank balances.
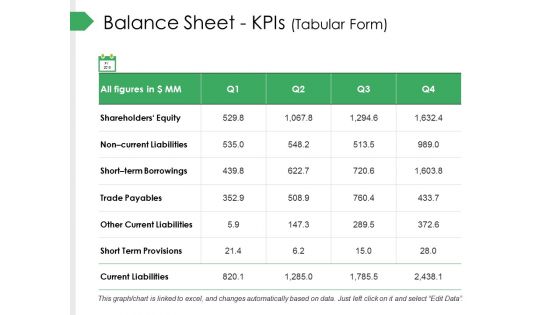
Balance Sheet Kpis Tabular Form Ppt PowerPoint Presentation Slides Designs Download
This is a balance sheet kpis tabular form ppt powerpoint presentation slides designs download. This is a four stage process. The stages in this process are trade payables, other current liabilities, short term provisions, current liabilities, short term borrowings.
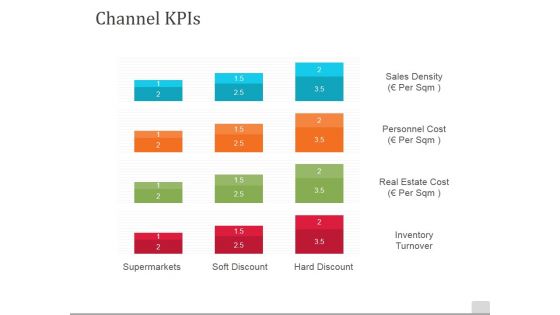
Channel Kpis Template 1 Ppt PowerPoint Presentation Infographic Template Elements
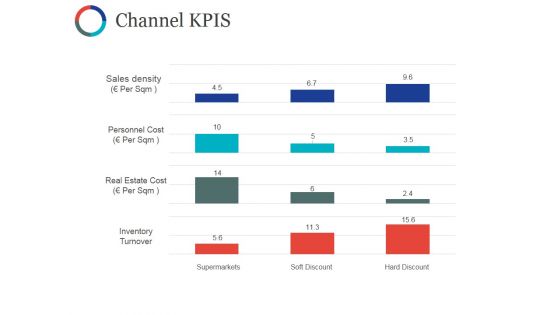
This is a channel kpis template 1 ppt powerpoint presentation infographic template elements. This is a four stage process. The stages in this process are channel kpis, sales density, personnel cost, real estate cost, inventory turnover.
Channel Kpis Template Ppt PowerPoint Presentation Show Portfolio
This is a channel kpis template ppt powerpoint presentation show portfolio. This is a four stage process. The stages in this process are sales density, personnel cost, real estate cost, inventory turnover.
Pandl Kpis Tabular Form Ppt PowerPoint Presentation Icon
This is a pandl kpis tabular form ppt powerpoint presentation icon. This is a four stage process. The stages in this process are business, net sales, total income, expenses, profit before tax, profit after tax.
P And L Kpis Ppt PowerPoint Presentation Infographics Background
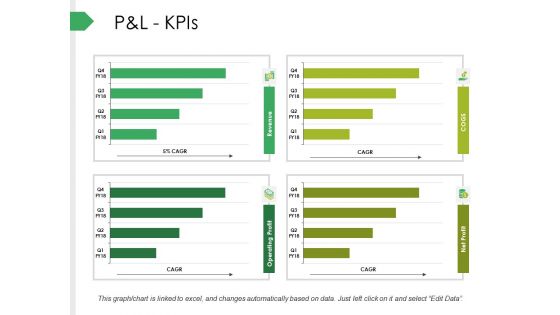
This is a p and l kpis ppt powerpoint presentation infographics background. This is a four stage process. The stages in this process are net sales, expenses, ebitda, profit before tax, profit after tax.
Competitive Analysis Report Ppt PowerPoint Presentation Tips
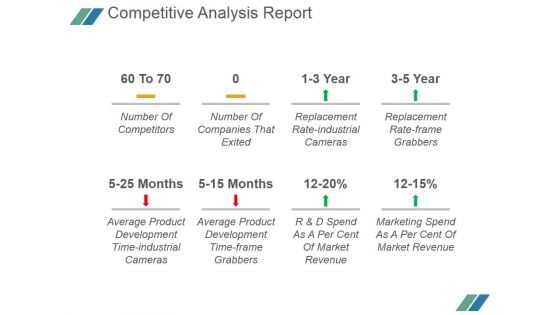
This is a competitive analysis report ppt powerpoint presentation tips. This is a eight stage process. The stages in this process are number of competitors, number of companies that exited, replacement rate industrial cameras, replacement rate frame grabbers, average product development time industrial cameras, average product development time frame grabbers, r and d spend as a per cent of market revenue, marketing spend as a per cent of market revenue.
Performance Report Powerpoint Ppt Template Bundles
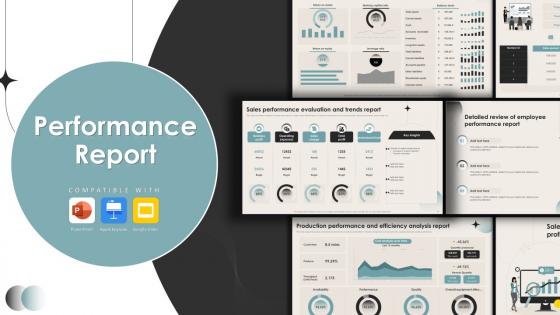
This Marketing, Sales, Production, Project, Construction-slide Performance Report Powerpoint Ppt Template Bundles is your content ready tool to impress the stakeholders with your business planning and its manner of execution. Showcase your ideas and how you plan to make them real in detail with this PPT Template Bundle. The slides have the conceptual bandwidth to present the crucial aspects of your plan, such as funding, marketing, resource allocation, timeline, roadmap, and more. When you present your plans with this PPT Layout, the stakeholders are sure to come on board because you will be able to present a succinct, thought-out, winning project. Download this Complete Deck now to take control into your hands. The 100 percent customizable offer is just too good to be resisted. Performance report showcases the outcome of activity or individual work over a specific period for informed decision making. It may compare the result with the desired standard or target. The purpose of this template is to enable teams to identify areas of improvement and make strategic decisions. It consists of financial, marketing, sales, Production, Construction plan and project performance evaluation and strategic review reports for evaluating efficiency and alignment with organizational goals.
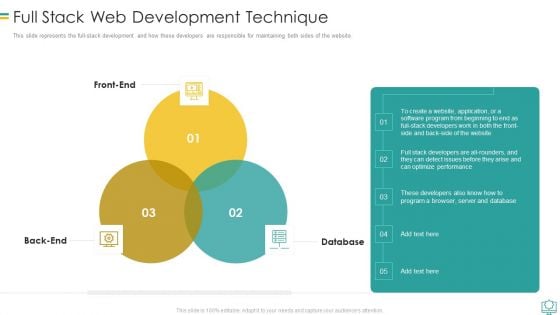
Full Stack Web Development Technique Infographics PDF
This slide represents the full stack development and how these developers are responsible for maintaining both sides of the website.Presenting Full Stack Web Development Technique Infographics PDF to provide visual cues and insights. Share and navigate important information on three stages that need your due attention. This template can be used to pitch topics like Program A Browser, Optimize Performance, Software Program In addtion, this PPT design contains high resolution images, graphics, etc, that are easily editable and available for immediate download.
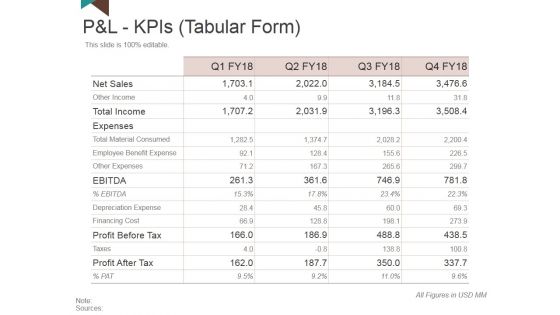
P And L Kpis Template 2 Ppt PowerPoint Presentation Outline Clipart
This is a p and l kpis template 2 ppt powerpoint presentation outline clipart. This is a four stage process. The stages in this process are net sales, total income, expenses, profit before tax, profit after tax.
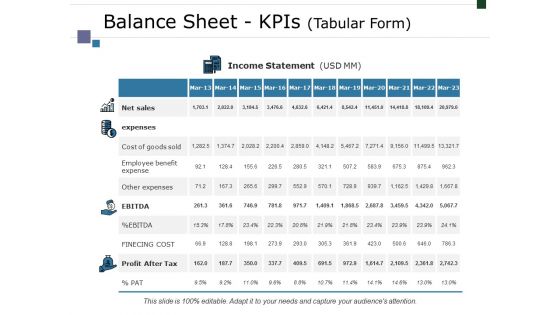
Balance Sheet Kpis Tabular Form Template 2 Ppt PowerPoint Presentation Summary Structure
This is a balance sheet kpis tabular form template 2 ppt powerpoint presentation summary structure. This is a four stage process. The stages in this process are net sales, expenses, ebitda, profit after tax, finecing cost.
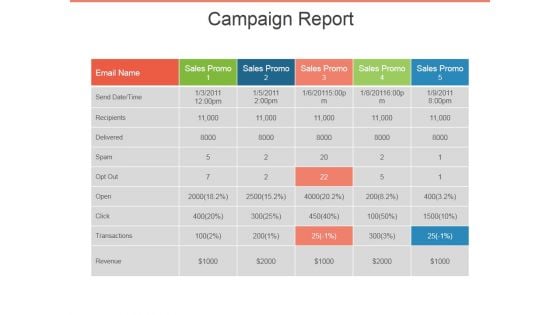
Campaign Report Ppt PowerPoint Presentation Infographic Template Images
This is a campaign report ppt powerpoint presentation infographic template images. This is a five stage process. The stages in this process are sales promo, email name, recipients, spam, delivered.
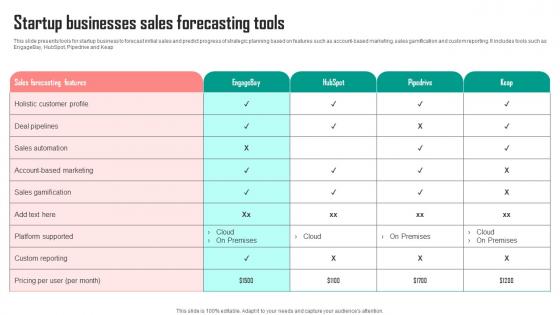
Startup Businesses Sales Forecasting Tools Rules Pdf
This slide presents tools for startup business to forecast initial sales and predict progress of strategic planning based on features such as account-based marketing, sales gamification and custom reporting. It includes tools such as EngageBay, HubSpot, Pipedrive and Keap Showcasing this set of slides titled Startup Businesses Sales Forecasting Tools Rules Pdf. The topics addressed in these templates are Forecasting Tools, Startup, Businesses. All the content presented in this PPT design is completely editable. Download it and make adjustments in color, background, font etc. as per your unique business setting. This slide presents tools for startup business to forecast initial sales and predict progress of strategic planning based on features such as account-based marketing, sales gamification and custom reporting. It includes tools such as EngageBay, HubSpot, Pipedrive and Keap
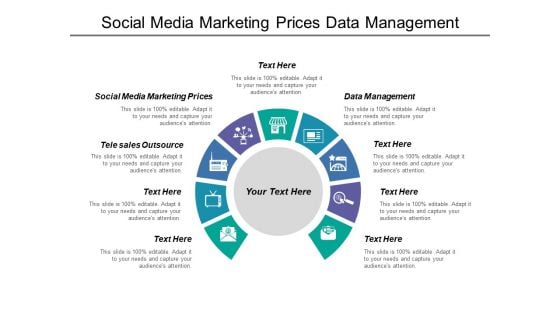
Social Media Marketing Prices Data Management Tele Sales Outsource Ppt PowerPoint Presentation Infographic Template Background
This is a social media marketing prices data management tele sales outsource ppt powerpoint presentation infographic template background. This is a nine stage process. The stages in this process are social media marketing prices, data management, tele sales outsource.
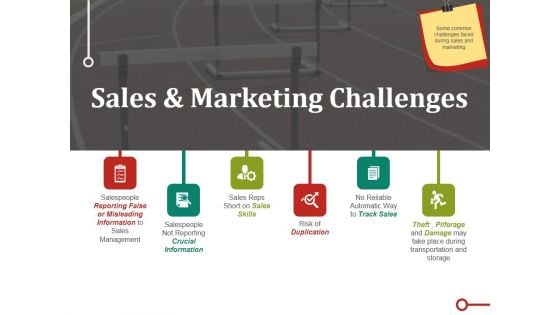
Sales And Marketing Challenges Ppt PowerPoint Presentation Styles Master Slide
This is a sales and marketing challenges ppt powerpoint presentation styles master slide. This is a six stage process. The stages in this process are salespeople reporting false or misleading information to sales management, salespeople not reporting crucial information, sales reps short on sales skills, risk of duplication, no reliable automatic way to track sales.
Quality Cost Report Ppt PowerPoint Presentation Icon Information
This is a quality cost report ppt powerpoint presentation icon information. This is a three stage process. The stages in this process are types of cost, quality cost, percentage of sales, prevention cost business.


 Continue with Email

 Home
Home


