Procurement Planning Dashboards
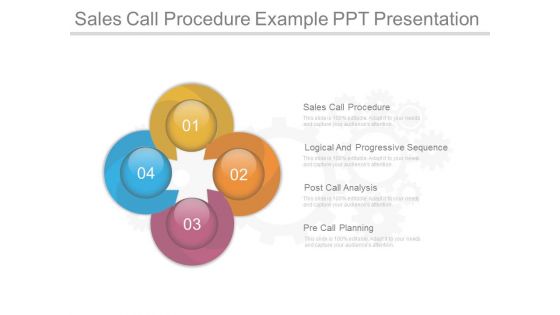
Sales Call Procedure Example Ppt Presentation
This is a sales call procedure example ppt presentation. This is a four stage process. The stages in this process are sales call procedure, logical and progressive sequence, post call analysis, pre call planning. \n \n
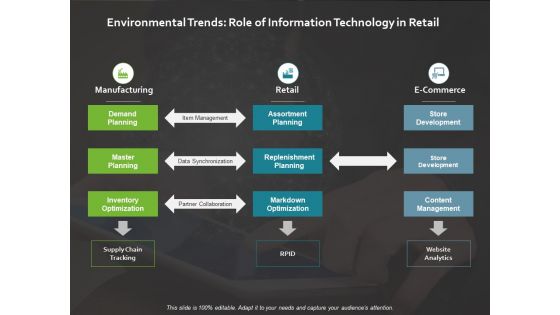
Environmental Trends Role Of Information Technology Ppt PowerPoint Presentation Outline Background
This is a environmental trends role of information technology ppt powerpoint presentation outline background. This is a three stage process. The stages in this process are manufacturing, retail, supply chain tracking, store development, demand planning.

Data Mining Techniques Regression Analysis Data Warehousing And Data Mining Guide AI SS V
This slide showcases regression analysis method of data mining to help businesses forecasting and tracking useful patterns for their operations. It provides details about linear, polynomial, logistic, ridge, lasso, marketing planning, crop yield, etc. Make sure to capture your audiences attention in your business displays with our gratis customizable Data Mining Techniques Regression Analysis Data Warehousing And Data Mining Guide AI SS V. These are great for business strategies, office conferences, capital raising or task suggestions. If you desire to acquire more customers for your tech business and ensure they stay satisfied, create your own sales presentation with these plain slides. This slide showcases regression analysis method of data mining to help businesses forecasting and tracking useful patterns for their operations. It provides details about linear, polynomial, logistic, ridge, lasso, marketing planning, crop yield, etc.
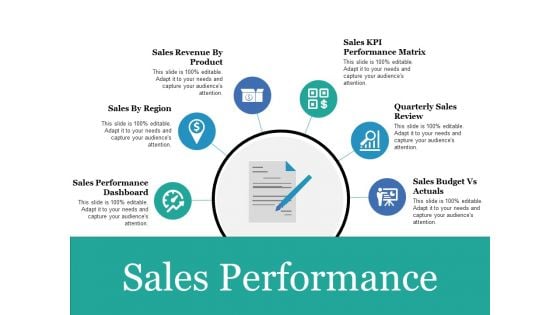
Sales Performance Ppt PowerPoint Presentation Portfolio Show
This is a sales performance ppt powerpoint presentation portfolio show. This is a six stage process. The stages in this process are sales performance dashboard, sales by region, sales revenue by product, quarterly sales review, sales budget vs actuals.
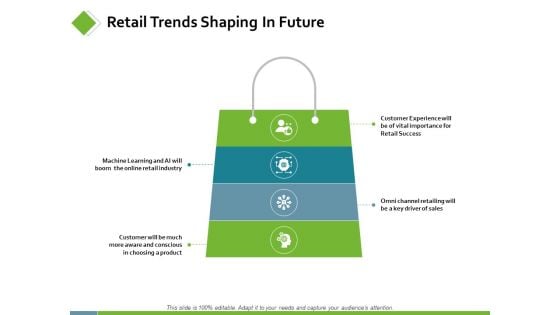
Retail Trends Shaping In Future Ppt PowerPoint Presentation Ideas Graphic Tips
This is a retail trends shaping in future ppt powerpoint presentation ideas graphic tips. This is a four stage process. The stages in this process are business, planning, strategy, marketing, management.
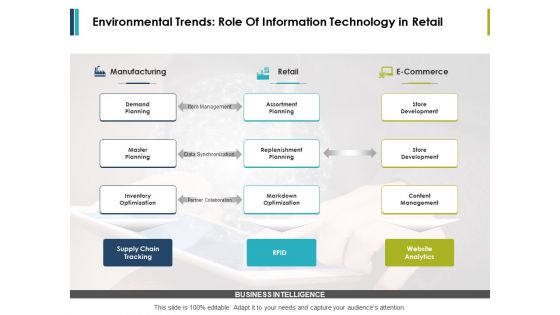
Environmental Trends Role Of Information Technology In Retail Ppt PowerPoint Presentation Styles Microsoft
This is a environmental trends role of information technology in retail ppt powerpoint presentation styles microsoft. This is a three stage process. The stages in this process are marketing, business, management, planning, strategy.
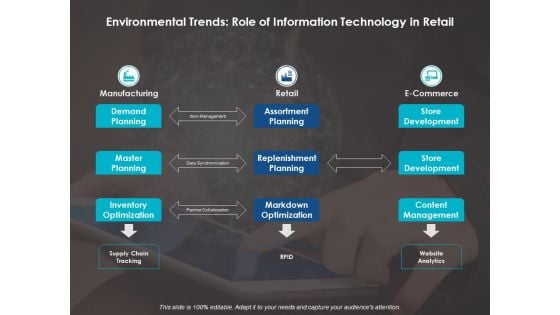
Environmental Trends Role Of Information Technology In Retail Ppt Powerpoint Presentation Infographic Template Portrait
This is a environmental trends role of information technology in retail ppt powerpoint presentation infographic template portrait. This is a twelve stage process. The stages in this process are business, management, planning, strategy.
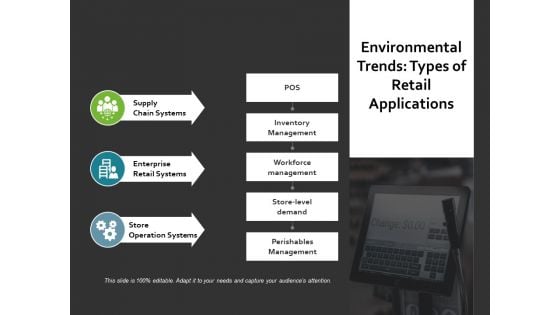
Environmental Trends Types Of Retail Applications Ppt PowerPoint Presentation Gallery Images
This is a environmental trends types of retail applications ppt powerpoint presentation gallery images. This is a three stage process. The stages in this process are supply chain systems, inventory management, workforce management, marketing, planning.
Three Options Tags With Icons Powerpoint Templates
This business slide displays four tags with icons around laptop. Download this diagram to display sales data and planning. Enlighten your audience with your breathtaking ideas.
Bulb With Business Analysis Icons Powerpoint Templates
This PowerPoint slide contains graphics of bulb diagram with icons. It helps to exhibit concepts of sales planning. Use this diagram to impart more clarity to data and to create more sound impact on viewers.
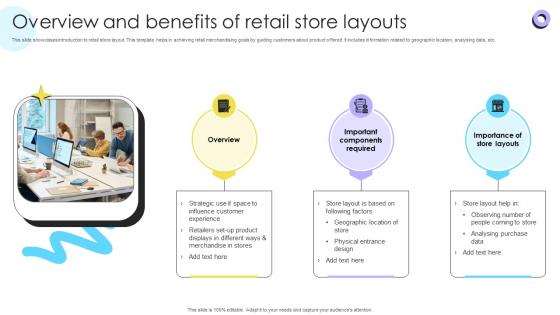
Overview And Benefits Of Retail Store Layouts Encouraging Repetitive Customer Purchase Ppt Presentation
This slide showcases introduction to retail store layout. This template helps in achieving retail merchandising goals by guiding customers about product offered. It includes information related to geographic location, analysing data, etc. Explore a selection of the finest Overview And Benefits Of Retail Store Layouts Encouraging Repetitive Customer Purchase Ppt Presentation here. With a plethora of professionally designed and pre-made slide templates, you can quickly and easily find the right one for your upcoming presentation. You can use our Overview And Benefits Of Retail Store Layouts Encouraging Repetitive Customer Purchase Ppt Presentation to effectively convey your message to a wider audience. Slidegeeks has done a lot of research before preparing these presentation templates. The content can be personalized and the slides are highly editable. Grab templates today from Slidegeeks. This slide showcases introduction to retail store layout. This template helps in achieving retail merchandising goals by guiding customers about product offered. It includes information related to geographic location, analysing data, etc.
Product Feasibility And Review Ppt PowerPoint Presentation File Icons
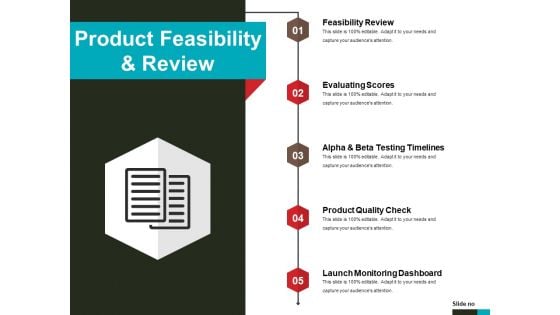
This is a product feasibility and review ppt powerpoint presentation file icons. This is a five stage process. The stages in this process are feasibility review, evaluating scores, alpha and beta testing timelines, product quality check, launch monitoring dashboard.
Product Feasibility And Review Ppt PowerPoint Presentation Pictures Backgrounds
This is a product feasibility and review ppt powerpoint presentation pictures backgrounds. This is a five stage process. The stages in this process are feasibility review, evaluating scores, alpha and beta testing timelines, product quality check, launch monitoring dashboard.
Information Analysis In Supply Chain Management Ppt Professional Clipart Images PDF
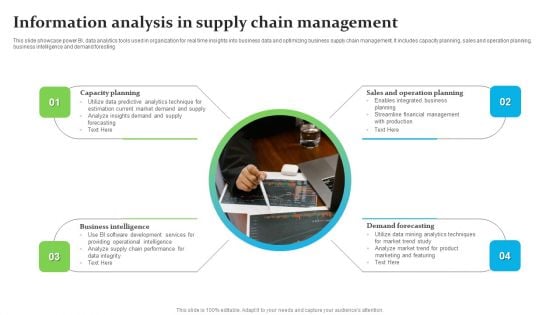
This slide showcase power BI, data analytics tools used in organization for real time insights into business data and optimizing business supply chain management. It includes capacity planning, sales and operation planning, business intelligence and demand foresting. Persuade your audience using this Information Analysis In Supply Chain Management Ppt Professional Clipart Images PDF. This PPT design covers four stages, thus making it a great tool to use. It also caters to a variety of topics including Capacity Planning, Demand Forecasting, Business Intelligence. Download this PPT design now to present a convincing pitch that not only emphasizes the topic but also showcases your presentation skills.
Statistical And Data Analysis Techniques Data Analytics For Informed Decision Ppt Sample
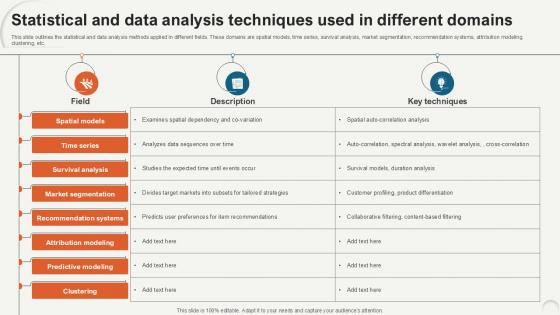
This slide outlines the statistical and data analysis methods applied in different fields. These domains are spatial models, time series, survival analysis, market segmentation, recommendation systems, attribution modeling, clustering, etc. Boost your pitch with our creative Statistical And Data Analysis Techniques Data Analytics For Informed Decision Ppt Sample. Deliver an awe-inspiring pitch that will mesmerize everyone. Using these presentation templates you will surely catch everyones attention. You can browse the ppts collection on our website. We have researchers who are experts at creating the right content for the templates. So you do not have to invest time in any additional work. Just grab the template now and use them. This slide outlines the statistical and data analysis methods applied in different fields. These domains are spatial models, time series, survival analysis, market segmentation, recommendation systems, attribution modeling, clustering, etc.
Balance Sheet Kpis Ppt PowerPoint Presentation Summary Gridlines
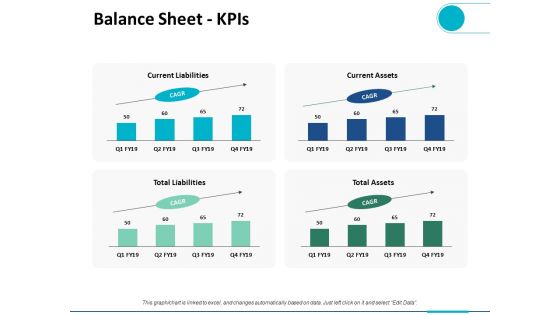
This is a balance sheet kpis ppt powerpoint presentation summary gridlines. This is a four stage process. The stages in this process are current liabilities, trade payables, marketing, planning, strategy.
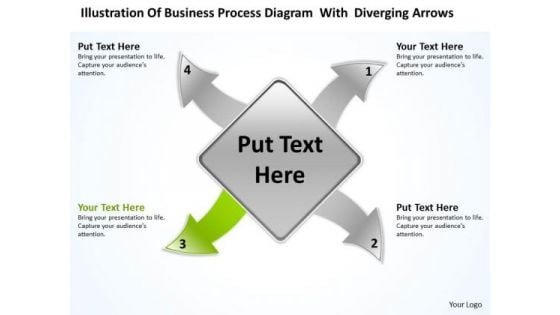
Diagram With Diverging Arrows Relative Circular Flow Process PowerPoint Slide
We present our diagram with diverging arrows Relative Circular Flow Process PowerPoint Slide.Download our Process and Flows PowerPoint Templates because you have played a stellar role and have a few ideas. Present our Flow Charts PowerPoint Templates because this helps you to chart the path ahead to arrive at your destination and acheive the goal. Download and present our Shapes PowerPoint Templates because they will Amplify your basic corporate concept and forefront the benefits of overlapping processes to arrive at common goals. Use our Business PowerPoint Templates because you are sure you have the right people for your plans. Download and present our Targets PowerPoint Templates because firing the arrows to emblazon the desired path will let you achieve anticipated results.Use these PowerPoint slides for presentations relating to Arrow, background, ball, business, button, catalog,chart, circle, circular, clipart, company,concept, cross, cycle, development,diagram, edit, editable, element, goals, icon, leader, marketing, model, navigation,organization, parts, pie, plans, presentation, report, representation,retro, six, sphere, stakeholder, team. The prominent colors used in the PowerPoint template are Green, White, Black. Use our diagram with diverging arrows Relative Circular Flow Process PowerPoint Slide are Multicolored. Professionals tell us our chart PowerPoint templates and PPT Slides are Elegant. Customers tell us our diagram with diverging arrows Relative Circular Flow Process PowerPoint Slide are effectively colour coded to prioritise your plans They automatically highlight the sequence of events you desire. Presenters tell us our chart PowerPoint templates and PPT Slides are readymade to fit into any presentation structure. You can be sure our diagram with diverging arrows Relative Circular Flow Process PowerPoint Slide are Beautiful. PowerPoint presentation experts tell us our button PowerPoint templates and PPT Slides are Upbeat. Add emphasis to your ideas with our Diagram With Diverging Arrows Relative Circular Flow Process PowerPoint Slide. Lend greater credence to your expression.
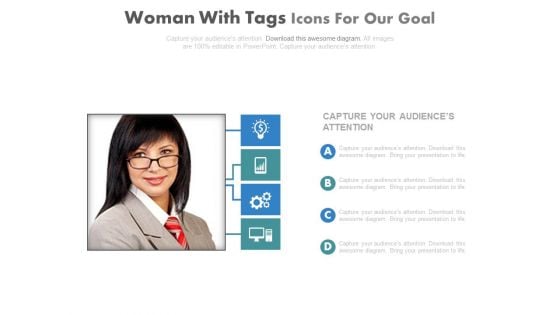
Woman Photo With Business Report Powerpoint Slides
This PowerPoint template is useful for setting goals and developing strategies. This PPT background has a design of female employee picture with icons. This PPT slide is suitable for topics like corporate strategic planning.
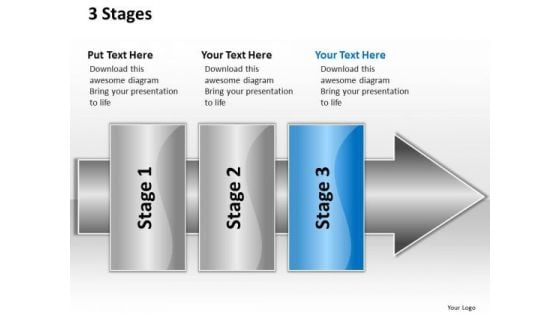
Ppt Linear Flow 3 Stages1 PowerPoint Templates
PPT linear flow 3 stages1 PowerPoint Templates-This PowerPoint Diagram can be used to represent worldwide business issues such as financial data, stock market Exchange, increase in sales, corporate presentations and more. It illustrates the blue component of this worldwide PowerPoint Diagram.-PPT linear flow 3 stages1 PowerPoint Templates-Abstract, Arrow, Blank, Business, Chart, Circular, Circulation, Concept, Conceptual, Design, Diagram, Executive, Icon, Idea, Illustration, Management, Model, Numbers, Organization, Procedure, Process, Progression, Resource, Sequence, Sequential, 3Stages, Steps, Strategy Finalise plans with our Ppt Linear Flow 3 Stages1 PowerPoint Templates. Give the final touch to your thoughts.
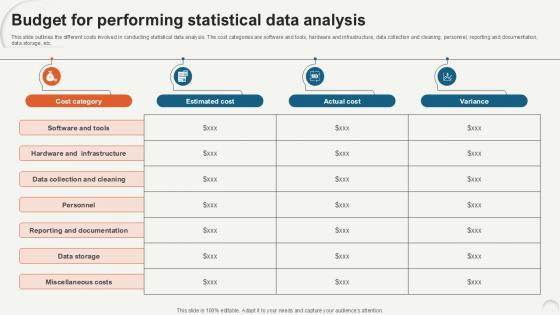
Budget For Performing Statistical Data Analytics For Informed Decision Ppt Template
This slide outlines the different costs involved in conducting statistical data analysis. The cost categories are software and tools, hardware and infrastructure, data collection and cleaning, personnel, reporting and documentation, data storage, etc. There are so many reasons you need a Budget For Performing Statistical Data Analytics For Informed Decision Ppt Template. The first reason is you can not spend time making everything from scratch, Thus, Slidegeeks has made presentation templates for you too. You can easily download these templates from our website easily. This slide outlines the different costs involved in conducting statistical data analysis. The cost categories are software and tools, hardware and infrastructure, data collection and cleaning, personnel, reporting and documentation, data storage, etc.
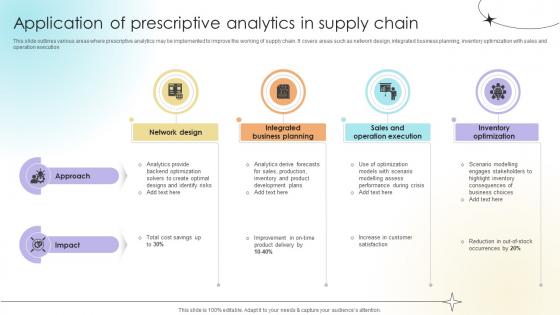
Application Of Prescriptive Analytics In Supply Chain Data Analytics SS V
This slide outlines various areas where prescriptive analytics may be implemented to improve the working of supply chain. It covers areas such as network design, integrated business planning, inventory optimization with sales and operation execution There are so many reasons you need a Application Of Prescriptive Analytics In Supply Chain Data Analytics SS V. The first reason is you can not spend time making everything from scratch, Thus, Slidegeeks has made presentation templates for you too. You can easily download these templates from our website easily. This slide outlines various areas where prescriptive analytics may be implemented to improve the working of supply chain. It covers areas such as network design, integrated business planning, inventory optimization with sales and operation execution

Role Of Big Data Analytics In Retail Process Developing Strategic Insights Using Big Data Analytics SS V
This slide showcases need of big data analytics to optimize retail operations and improve overall business revenue. It provides information regarding strategic decisions, predicting trends and market assessment. The best PPT templates are a great way to save time, energy, and resources. Slidegeeks have 100 percent editable powerpoint slides making them incredibly versatile. With these quality presentation templates, you can create a captivating and memorable presentation by combining visually appealing slides and effectively communicating your message. Download Role Of Big Data Analytics In Retail Process Developing Strategic Insights Using Big Data Analytics SS V from Slidegeeks and deliver a wonderful presentation. This slide showcases need of big data analytics to optimize retail operations and improve overall business revenue. It provides information regarding strategic decisions, predicting trends and market assessment.
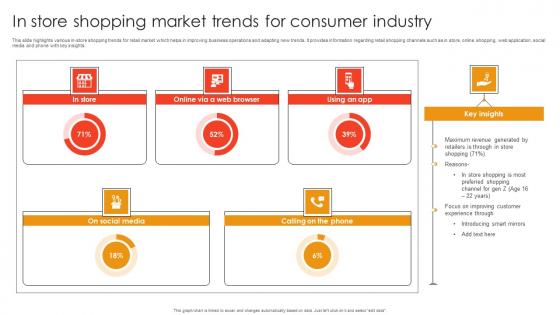
In Store Shopping Market Trends For Consumer Industry Ideas Pdf
This slide highlights various in store shopping trends for retail market which helps in improving business operations and adapting new trends. It provides information regarding retail shopping channels such as in store, online shopping, web application, social media and phone with key insights. Showcasing this set of slides titled In Store Shopping Market Trends For Consumer Industry Ideas Pdf. The topics addressed in these templates are Online Via Web Browser, Using App, On Social Media. All the content presented in this PPT design is completely editable. Download it and make adjustments in color, background, font etc. as per your unique business setting. This slide highlights various in store shopping trends for retail market which helps in improving business operations and adapting new trends. It provides information regarding retail shopping channels such as in store, online shopping, web application, social media and phone with key insights.
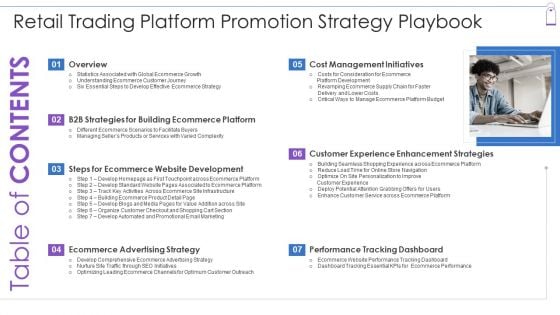
Table Of Contents Retail Trading Platform Promotion Strategy Playbook Slide4 Elements PDF
This is a table of contents retail trading platform promotion strategy playbook slide4 elements pdf template with various stages. Focus and dispense information on seven stages using this creative set, that comes with editable features. It contains large content boxes to add your information on topics like b2b strategies, building ecommerce platform, ecommerce advertising strategy, performance tracking dashboard. You can also showcase facts, figures, and other relevant content using this PPT layout. Grab it now.
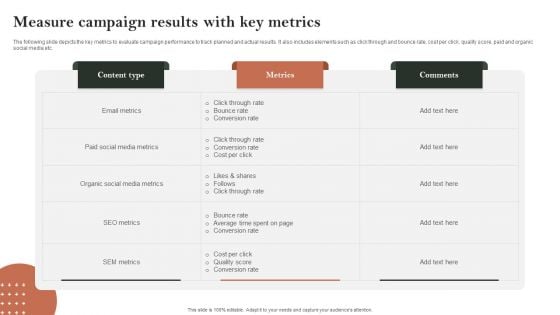
Search Engine Marketing Measure Campaign Results With Key Metrics Infographics PDF
The following slide depicts the key metrics to evaluate campaign performance to track planned and actual results. It also includes elements such as click through and bounce rate, cost per click, quality score, paid and organic social media etc. Slidegeeks is here to make your presentations a breeze with Search Engine Marketing Measure Campaign Results With Key Metrics Infographics PDF With our easy-to-use and customizable templates, you can focus on delivering your ideas rather than worrying about formatting. With a variety of designs to choose from, youre sure to find one that suits your needs. And with animations and unique photos, illustrations, and fonts, you can make your presentation pop. So whether youre giving a sales pitch or presenting to the board, make sure to check out Slidegeeks first.
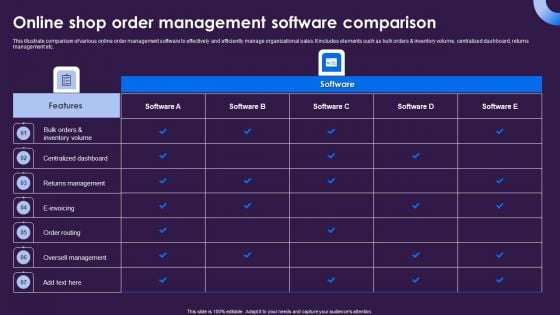
Online Shop Order Management Software Comparison Graphics PDF
This illustrate comparison of various online order management software to effectively and efficiently manage organizational sales. It includes elements such as bulk orders and inventory volume, centralized dashboard, returns management etc. Showcasing this set of slides titled Online Shop Order Management Software Comparison Graphics PDF. The topics addressed in these templates are Bulk Orders Inventory Volume, Centralized Dashboard, Returns Management. All the content presented in this PPT design is completely editable. Download it and make adjustments in color, background, font etc. as per your unique business setting.
Colorful Bulb With Three Icons Powerpoint Templates
This PowerPoint slide contains graphics of bulb diagram with icons. It helps to exhibit concepts of sales planning. Use this diagram to impart more clarity to data and to create more sound impact on viewers.
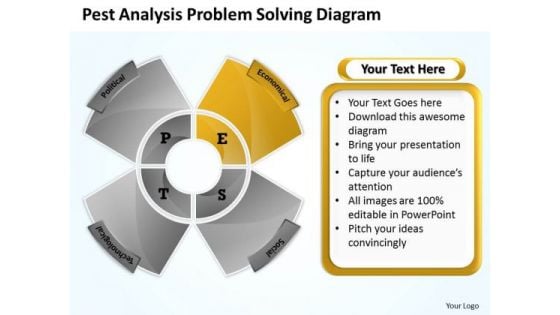
Sample Business PowerPoint Presentations Analysis Problem Solving Diagram Slides
We present our sample business powerpoint presentations analysis problem solving diagram Slides.Download and present our Process and flows PowerPoint Templates because Our PowerPoint Templates and Slides will provide you the cutting edge. Slice through the doubts in the minds of your listeners. Download our Flow Charts PowerPoint Templates because It will mark the footprints of your journey. Illustrate how they will lead you to your desired destination. Present our Business PowerPoint Templates because Our PowerPoint Templates and Slides are effectively colour coded to prioritise your plans They automatically highlight the sequence of events you desire. Present our Circle Charts PowerPoint Templates because It will Strengthen your hand with your thoughts. They have all the aces you need to win the day. Use our Shapes PowerPoint Templates because You can safely bank on our PowerPoint Templates and Slides. They will provide a growth factor to your valuable thoughts.Use these PowerPoint slides for presentations relating to Circle, company, cross, data, design, diagram, direction, document, financial, four, glossy, goals, graph, green, junction, management, market, marketing, model, multicolored, multiple, navigation, network, options, orange, pie, plan, presentation, process, red, results, shiny, sphere. The prominent colors used in the PowerPoint template are Yellow, Gray, Black. Professionals tell us our sample business powerpoint presentations analysis problem solving diagram Slides provide you with a vast range of viable options. Select the appropriate ones and just fill in your text. Presenters tell us our cross PowerPoint templates and PPT Slides help you meet deadlines which are an element of today's workplace. Just browse and pick the slides that appeal to your intuitive senses. The feedback we get is that our sample business powerpoint presentations analysis problem solving diagram Slides will help you be quick off the draw. Just enter your specific text and see your points hit home. Use our cross PowerPoint templates and PPT Slides are effectively colour coded to prioritise your plans They automatically highlight the sequence of events you desire. You can be sure our sample business powerpoint presentations analysis problem solving diagram Slides look good visually. Customers tell us our document PowerPoint templates and PPT Slides are the best it can get when it comes to presenting. Brake for no one with our Sample Business PowerPoint Presentations Analysis Problem Solving Diagram Slides. You will come out on top.
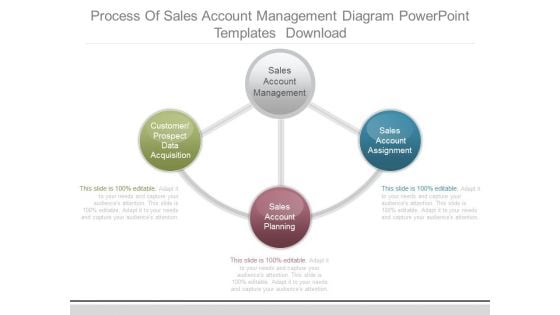
Process Of Sales Account Management Diagram Powerpoint Templates Download
This is a process of sales account management diagram powerpoint templates download. This is a three stage process. The stages in this process are sales account management, customer prospect data acquisition, sales account assignment, sales account planning.
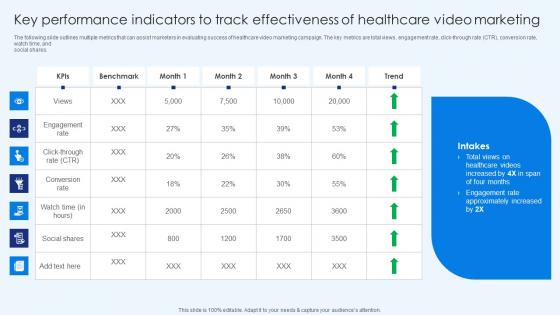
Healthcare Promotion Key Performance Indicators To Track Effectiveness Formats Pdf
The following slide outlines multiple metrics that can assist marketers in evaluating success of healthcare video marketing campaign. The key metrics are total views, engagement rate, click-through rate CTR, conversion rate, watch time, and social shares. Make sure to capture your audiences attention in your business displays with our gratis customizable Healthcare Promotion Key Performance Indicators To Track Effectiveness Formats Pdf. These are great for business strategies, office conferences, capital raising or task suggestions. If you desire to acquire more customers for your tech business and ensure they stay satisfied, create your own sales presentation with these plain slides. The following slide outlines multiple metrics that can assist marketers in evaluating success of healthcare video marketing campaign. The key metrics are total views, engagement rate, click-through rate CTR, conversion rate, watch time, and social shares.
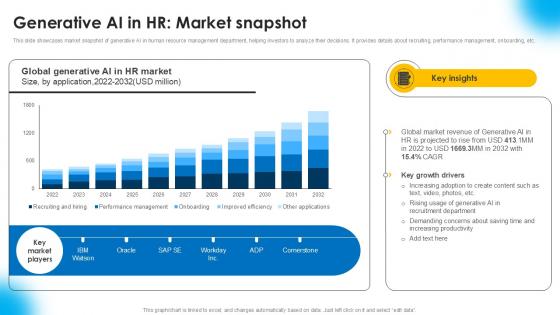
Generative Ai In HR Market Snapshot AI Powered Recruitment Enhancing Ppt Template AI SS V
This slide showcases market snapshot of generative AI in human resource management department, helping investors to analyze their decisions. It provides details about recruiting, performance management, onboarding, etc.Make sure to capture your audiences attention in your business displays with our gratis customizable Generative Ai In HR Market Snapshot AI Powered Recruitment Enhancing Ppt Template AI SS V. These are great for business strategies, office conferences, capital raising or task suggestions. If you desire to acquire more customers for your tech business and ensure they stay satisfied, create your own sales presentation with these plain slides. This slide showcases market snapshot of generative AI in human resource management department, helping investors to analyze their decisions. It provides details about recruiting, performance management, onboarding, etc.
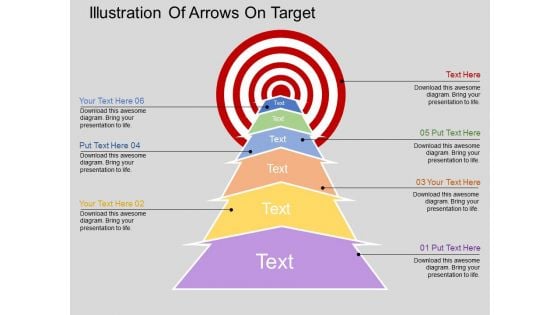
Illustration Of Arrows On Target Powerpoint Templates
Our above slide illustrates arrow steps towards target. This PowerPoint template may be used to exhibit target planning. Use this diagram to impart more clarity to data and to create more sound impact on viewers.

Retail Industry Data Analytics Company Outline Download PDF
The following slide highlights the research services offered by Kantar company to the retail industry. It also shows the clients and impact of solutions provided Here you can discover an assortment of the finest PowerPoint and Google Slides templates. With these templates, you can create presentations for a variety of purposes while simultaneously providing your audience with an eye-catching visual experience. Download Retail Industry Data Analytics Company Outline Download PDF to deliver an impeccable presentation. These templates will make your job of preparing presentations much quicker, yet still, maintain a high level of quality. Slidegeeks has experienced researchers who prepare these templates and write high-quality content for you. Later on, you can personalize the content by editing the Retail Industry Data Analytics Company Outline Download PDF The following slide highlights the research services offered by Kantar company to the retail industry. It also shows the clients and impact of solutions provided
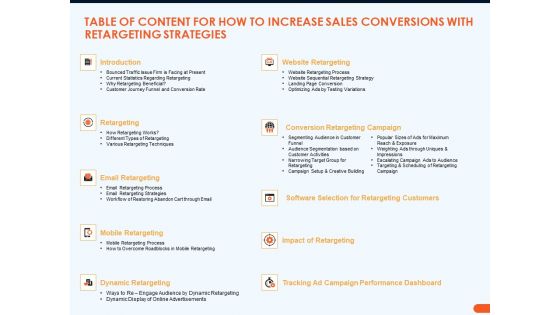
Table Of Content For How To Increase Sales Conversions With Retargeting Strategies Download PDF
Presenting this set of slides with name table of content for how to increase sales conversions with retargeting strategies download pdf. The topics discussed in these slides are retargeting, dynamic retargeting, campaign, performance, dashboard. This is a completely editable PowerPoint presentation and is available for immediate download. Download now and impress your audience.
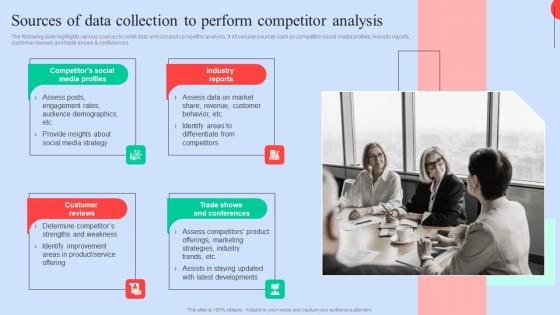
Sources Data Collection Executing Competitors Strategies To Assess Organizational Performance Mockup Pdf
The following slide highlights various sources to collet data and conduct competitor analysis. It showcase sources such as competitor social media profiles, industry reports,customer reviews and trade shows and conferences. Here you can discover an assortment of the finest PowerPoint and Google Slides templates. With these templates, you can create presentations for a variety of purposes while simultaneously providing your audience with an eye catching visual experience. Download Sources Data Collection Executing Competitors Strategies To Assess Organizational Performance Mockup Pdf to deliver an impeccable presentation. These templates will make your job of preparing presentations much quicker, yet still, maintain a high level of quality. Slidegeeks has experienced researchers who prepare these templates and write high quality content for you. Later on, you can personalize the content by editing the Sources Data Collection Executing Competitors Strategies To Assess Organizational Performance Mockup Pdf. The following slide highlights various sources to collet data and conduct competitor analysis. It showcase sources such as competitor social media profiles, industry reports,customer reviews and trade shows and conferences.
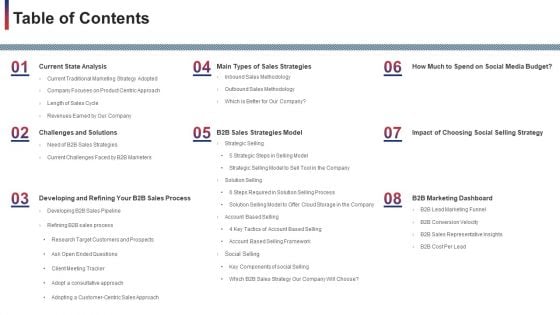
Table Of Contents Diagrams PDF
Deliver and pitch your topic in the best possible manner with this table of contents diagrams pdf. Use them to share invaluable insights on main types of sales strategies, b2b sales strategies model, b2b marketing dashboard, current state analysis, challenges and solutions and impress your audience. This template can be altered and modified as per your expectations. So, grab it now.
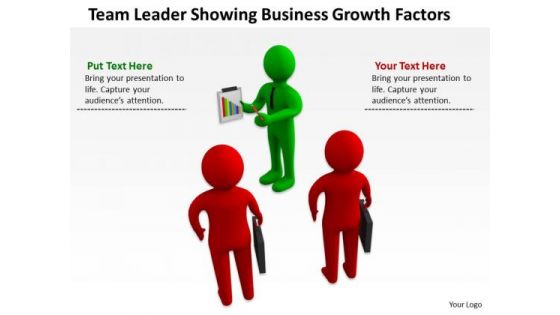
Successful Business Men Leader Showing PowerPoint Theme Growth Factors Slides
We present our successful business men leader showing powerpoint theme growth factors Slides.Use our People PowerPoint Templates because It can Bubble and burst with your ideas. Use our Business PowerPoint Templates because You can Be the puppeteer with our PowerPoint Templates and Slides as your strings. Lead your team through the steps of your script. Download and present our Finance PowerPoint Templates because Our PowerPoint Templates and Slides are effectively colour coded to prioritise your plans They automatically highlight the sequence of events you desire. Download and present our Marketing PowerPoint Templates because It can Bubble and burst with your ideas. Present our Signs PowerPoint Templates because Our PowerPoint Templates and Slides are topically designed to provide an attractive backdrop to any subject.Use these PowerPoint slides for presentations relating to chart, growth, market, binder, leader, isolated, human, sales, file, document, economy, white, corporate, business, sign, line, adult, success, growing, male, graphic, finance, pen, report, people, black, close-up, suit, graph, illustration, object, paperwork, holding, executive, professional, showing, paper, organization, progress, information, background, work, manager, office, man, financial, hand, businessman. The prominent colors used in the PowerPoint template are Red, Green, Black. Give a fillip to your plans with our Successful Business Men Leader Showing PowerPoint Theme Growth Factors Slides. They will get that extra attention you seek.
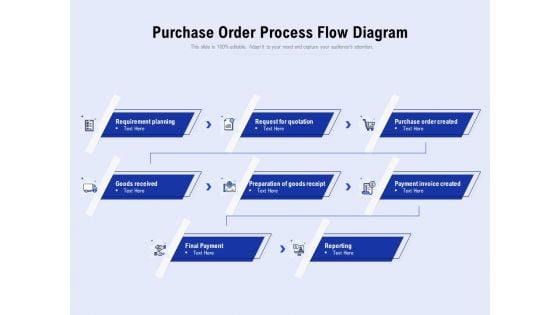
Purchase Order Process Flow Diagram Ppt PowerPoint Presentation Inspiration Influencers PDF
Presenting this set of slides with name purchase order process flow diagram ppt powerpoint presentation inspiration influencers pdf. This is a eight stage process. The stages in this process are requirement planning, request for quotation, purchase order created, preparation of goods receipt, payment invoice created, reporting, final payment, goods received. This is a completely editable PowerPoint presentation and is available for immediate download. Download now and impress your audience.

Global Data Security Industry Report Overview Of Cybersecurity Market Landscape IR SS V
The slide highlights a comprehensive overview of the cyber security industry. The purpose of the slide is to provide insights to stakeholders enabling them to make strategic decisions. The slide covers market sizing, and statistics related to cybersecurity spending, cybercrimes, and venture funding. This modern and well-arranged Global Data Security Industry Report Overview Of Cybersecurity Market Landscape IR SS V provides lots of creative possibilities. It is very simple to customize and edit with the Powerpoint Software. Just drag and drop your pictures into the shapes. All facets of this template can be edited with Powerpoint, no extra software is necessary. Add your own material, put your images in the places assigned for them, adjust the colors, and then you can show your slides to the world, with an animated slide included. The slide highlights a comprehensive overview of the cyber security industry. The purpose of the slide is to provide insights to stakeholders enabling them to make strategic decisions. The slide covers market sizing, and statistics related to cybersecurity spending, cybercrimes, and venture funding.
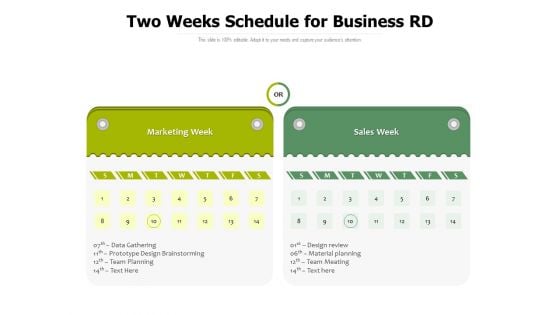
Two Weeks Schedule For Business RD Ppt PowerPoint Presentation Model Graphics Example PDF
Presenting this set of slides with name two weeks schedule for business rd ppt powerpoint presentation model graphics example pdf. This is a two stage process. The stages in this process are marketing week, sales week, data gathering, prototype design brainstorming, team planning, design review, material planning, team meeting. This is a completely editable PowerPoint presentation and is available for immediate download. Download now and impress your audience.
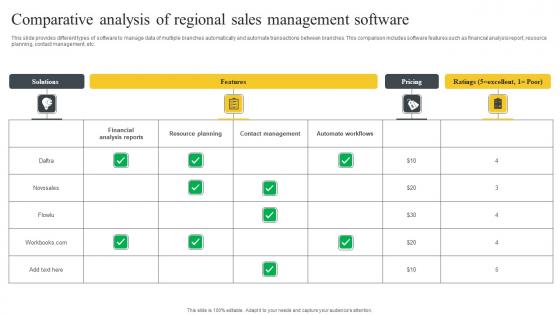
Comparative Analysis Of Regional Sales Management Software Background Pdf
This slide provides different types of software to manage data of multiple branches automatically and automate transactions between branches. This comparison includes software features such as financial analysis report, resource planning, contact management, etc. Pitch your topic with ease and precision using this Comparative Analysis Of Regional Sales Management Software Background Pdf. This layout presents information on Solutions, Features, Pricing. It is also available for immediate download and adjustment. So, changes can be made in the color, design, graphics or any other component to create a unique layout. This slide provides different types of software to manage data of multiple branches automatically and automate transactions between branches. This comparison includes software features such as financial analysis report, resource planning, contact management, etc.
Key Metrics To Measure Success Digital Marketing Strategies Improve Enterprise Sales Icons Pdf
The following slide showcases key performance indicators KPIs through which marketers can evaluate the effectiveness of marketing tactics. The KPIs covered in the slide are website traffic, brand impressions, annual contract value, new leads in pipeline, gross profit, net profit, market share, attrition rate, and monthly active users. Do you know about Slidesgeeks Key Metrics To Measure Success Digital Marketing Strategies Improve Enterprise Sales Icons Pdf These are perfect for delivering any kind od presentation. Using it, create PowerPoint presentations that communicate your ideas and engage audiences. Save time and effort by using our pre designed presentation templates that are perfect for a wide range of topic. Our vast selection of designs covers a range of styles, from creative to business, and are all highly customizable and easy to edit. Download as a PowerPoint template or use them as Google Slides themes. The following slide showcases key performance indicators KPIs through which marketers can evaluate the effectiveness of marketing tactics. The KPIs covered in the slide are website traffic, brand impressions, annual contract value, new leads in pipeline, gross profit, net profit, market share, attrition rate, and monthly active users.

Decrease In Real Estate Rates Concept Business PowerPoint Templates And PowerPoint Themes 1012
Decrease In Real Estate Rates Concept Business PowerPoint Templates And PowerPoint Themes 1012-Create visually stunning and define your PPT Presentations in a unique and inspiring manner using our above template which contains a graphic of 3d houses going downwards. This image represents the concept of finance and crisis. It imitates chart, currency, data, decrease, economy, estate, falling, finance, graph, investment, loss, market, money, progress, sales. Deliver amazing presentations to mesmerize your audience.-Decrease In Real Estate Rates Concept Business PowerPoint Templates And PowerPoint Themes 1012-This PowerPoint template can be used for presentations relating to-Decrease In Real Estate Rates, Finance, Symbol Arrows, Business, Metaphor Examine plans with our Decrease In Real Estate Rates Concept Business PowerPoint Templates And PowerPoint Themes 1012. Download without worries with our money back guaranteee.
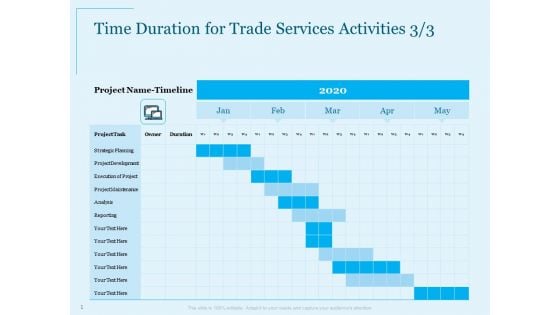
Trade Facilitation Services Time Duration For Trade Services Activities Project Ppt Professional Graphics Example PDF
Deliver an awe-inspiring pitch with this creative trade facilitation services time duration for trade services activities project ppt professional graphics example pdf bundle. Topics like strategic planning, project development, project execution, data maintenance, analysis can be discussed with this completely editable template. It is available for immediate download depending on the needs and requirements of the user.
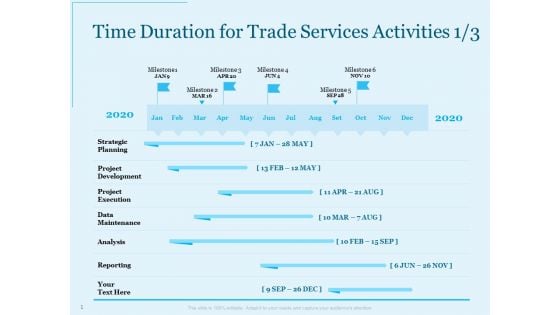
Trade Facilitation Services Time Duration For Trade Services Activities Ppt Summary Guidelines PDF
Deliver and pitch your topic in the best possible manner with this trade facilitation services time duration for trade services activities ppt summary guidelines pdf. Use them to share invaluable insights on strategic planning, project development, project execution, data maintenance, analysis and impress your audience. This template can be altered and modified as per your expectations. So, grab it now.
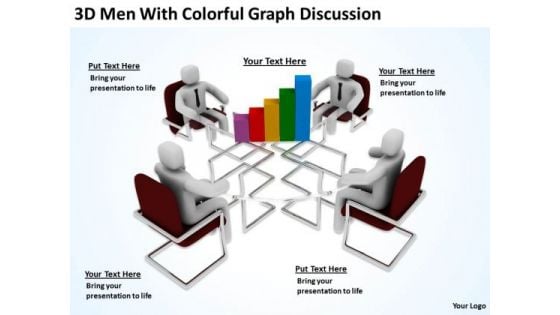
Men At Work Business As Usual Graph Discussion PowerPoint Templates Ppt Backgrounds For Slides
We present our men at work business as usual graph discussion PowerPoint templates PPT backgrounds for slides.Use our Business PowerPoint Templates because Watching this your Audience will Grab their eyeballs, they wont even blink. Download and present our People PowerPoint Templates because Our PowerPoint Templates and Slides are effectively colour coded to prioritise your plans They automatically highlight the sequence of events you desire. Present our Success PowerPoint Templates because You can Stir your ideas in the cauldron of our PowerPoint Templates and Slides. Cast a magic spell on your audience. Present our Finance PowerPoint Templates because Our PowerPoint Templates and Slides help you meet the demand of the Market. Just browse and pick the slides that appeal to your intuitive senses. Download and present our Success PowerPoint Templates because You canTake a leap off the starting blocks with our PowerPoint Templates and Slides. They will put you ahead of the competition in quick time.Use these PowerPoint slides for presentations relating to 3d, accounting, achievement, ascending, bar, briefcase, businessman,businessmen, clipboard, colleagues, colourful, corporate, data, decisions,diagram, discuss, figure, finance, financial, forecast, gains, graph, green, group,growth, illustration, improvement, increasing, information, leader, leadership, men,performance, planning, presentation, profit, progress, projection, red, rising,series, show, statistics, strategy, success, team, teamwork, tie, yellow. The prominent colors used in the PowerPoint template are Blue , White, Green. We assure you our men at work business as usual graph discussion PowerPoint templates PPT backgrounds for slides help you meet deadlines which are an element of today's workplace. Just browse and pick the slides that appeal to your intuitive senses. You can be sure our bar PowerPoint templates and PPT Slides are topically designed to provide an attractive backdrop to any subject. Use our men at work business as usual graph discussion PowerPoint templates PPT backgrounds for slides effectively help you save your valuable time. We assure you our bar PowerPoint templates and PPT Slides will help them to explain complicated concepts. Use our men at work business as usual graph discussion PowerPoint templates PPT backgrounds for slides provide great value for your money. Be assured of finding the best projection to highlight your words. Professionals tell us our clipboard PowerPoint templates and PPT Slides will generate and maintain the level of interest you desire. They will create the impression you want to imprint on your audience. Serve presentations with our Men At Work Business As Usual Graph Discussion PowerPoint Templates Ppt Backgrounds For Slides. Download without worries with our money back guaranteee.
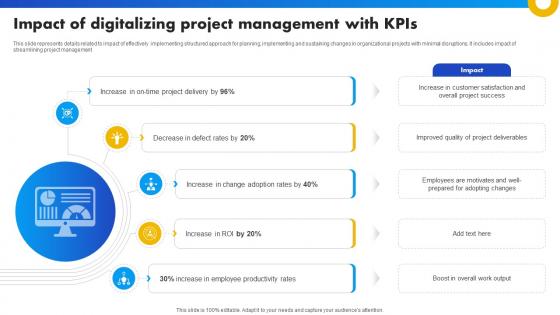
Impact Of Digitalizing Project Management With Kpis Strategies For Success In Digital
This slide represents details related to impact of effectively implementing structured approach for planning, implementing and sustaining changes in organizational projects with minimal disruptions. It includes impact of streamlining project management. Make sure to capture your audiences attention in your business displays with our gratis customizable Impact Of Digitalizing Project Management With Kpis Strategies For Success In Digital. These are great for business strategies, office conferences, capital raising or task suggestions. If you desire to acquire more customers for your tech business and ensure they stay satisfied, create your own sales presentation with these plain slides. This slide represents details related to impact of effectively implementing structured approach for planning, implementing and sustaining changes in organizational projects with minimal disruptions. It includes impact of streamlining project management.
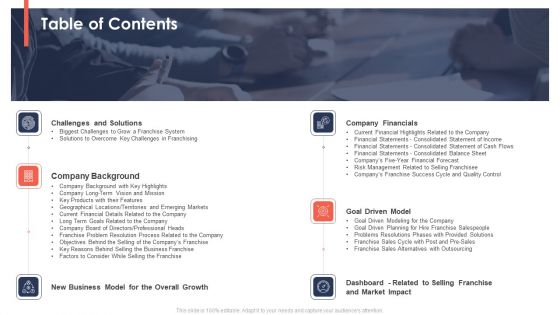
Trading Current Franchise Business Table Of Contents Ppt Model Ideas PDF
This is a trading current franchise business table of contents ppt model ideas pdf template with various stages. Focus and dispense information on six stages using this creative set, that comes with editable features. It contains large content boxes to add your information on topics like goal driven model, financials, market impact, dashboard, business model. You can also showcase facts, figures, and other relevant content using this PPT layout. Grab it now.
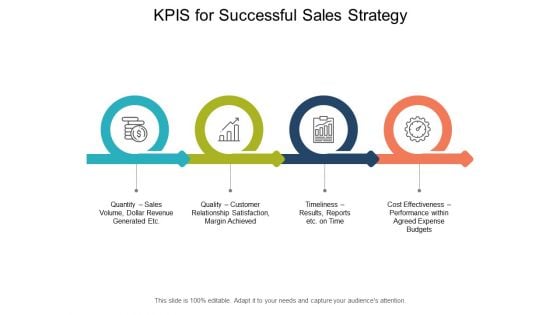
KPIS For Successful Sales Strategy Ppt PowerPoint Presentation File Sample
Presenting this set of slides with name kpis for successful sales strategy ppt powerpoint presentation file sample. This is a four stage process. The stages in this process are Marketing, Business, Management, Planning, Strategy. This is a completely editable PowerPoint presentation and is available for immediate download. Download now and impress your audience.
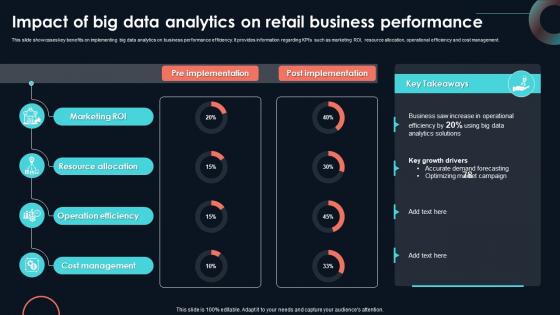
Impact Of Big Data Analytics On Retail Business Developing Strategic Insights Using Big Data Analytics SS V
This slide showcases key benefits on implementing big data analytics on business performance efficiency. It provides information regarding KPIs such as marketing ROI, resource allocation, operational efficiency and cost management. Do you know about Slidesgeeks Impact Of Big Data Analytics On Retail Business Developing Strategic Insights Using Big Data Analytics SS V These are perfect for delivering any kind od presentation. Using it, create PowerPoint presentations that communicate your ideas and engage audiences. Save time and effort by using our pre-designed presentation templates that are perfect for a wide range of topic. Our vast selection of designs covers a range of styles, from creative to business, and are all highly customizable and easy to edit. Download as a PowerPoint template or use them as Google Slides themes. This slide showcases key benefits on implementing big data analytics on business performance efficiency. It provides information regarding KPIs such as marketing ROI, resource allocation, operational efficiency and cost management.
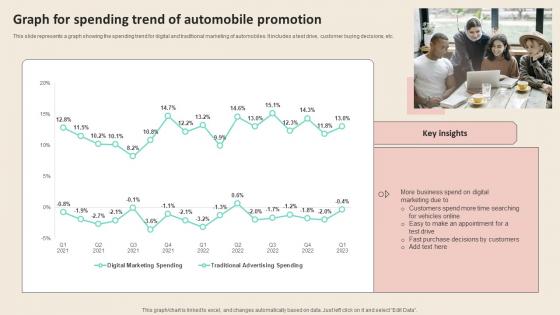
Graph For Spending Trend Of Automobile Promotional Strategies To Increase Download PDF
This slide represents a graph showing the spending trend for digital and traditional marketing of automobiles. It includes a test drive, customer buying decisions, etc. Whether you have daily or monthly meetings, a brilliant presentation is necessary. Graph For Spending Trend Of Automobile Promotional Strategies To Increase Download PDF can be your best option for delivering a presentation. Represent everything in detail using Graph For Spending Trend Of Automobile Promotional Strategies To Increase Download PDF and make yourself stand out in meetings. The template is versatile and follows a structure that will cater to your requirements. All the templates prepared by Slidegeeks are easy to download and edit. Our research experts have taken care of the corporate themes as well. So, give it a try and see the results. This slide represents a graph showing the spending trend for digital and traditional marketing of automobiles. It includes a test drive, customer buying decisions, etc.
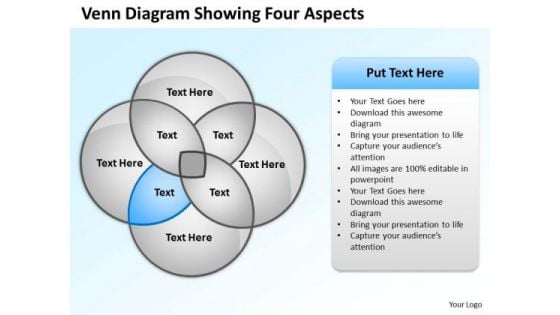
Business Organizational Chart Template Venn Diagram Showing Four Aspects PowerPoint Slides
We present our business organizational chart template venn diagram showing four aspects PowerPoint Slides.Use our Ring Charts PowerPoint Templates because Your audience will believe you are the cats whiskers. Download our Circle Charts PowerPoint Templates because You are well armed with penetrative ideas. Our PowerPoint Templates and Slides will provide the gunpowder you need. Download and present our Process and Flows PowerPoint Templates because They will Put your wonderful verbal artistry on display. Our PowerPoint Templates and Slides will provide you the necessary glam and glitter. Download and present our Flow Charts PowerPoint Templates because Our PowerPoint Templates and Slides help you meet the demand of the Market. Just browse and pick the slides that appeal to your intuitive senses. Download our Business PowerPoint Templates because Our PowerPoint Templates and Slides will let you Illuminate the road ahead to Pinpoint the important landmarks along the way.Use these PowerPoint slides for presentations relating to Business, button, catalog, chart, circle, company, cross, data, design, diagram, direction, document, financial, four, glossy, goals, graph, junction, management, market, marketing, model, multicolored, multiple, navigation, network, options, plan, presentation, process, purple, results, shiny, sphere, statistics. The prominent colors used in the PowerPoint template are Blue light, White, Gray. People tell us our business organizational chart template venn diagram showing four aspects PowerPoint Slides are effectively colour coded to prioritise your plans They automatically highlight the sequence of events you desire. PowerPoint presentation experts tell us our data PowerPoint templates and PPT Slides will impress their bosses and teams. Presenters tell us our business organizational chart template venn diagram showing four aspects PowerPoint Slides will generate and maintain the level of interest you desire. They will create the impression you want to imprint on your audience. Use our data PowerPoint templates and PPT Slides are effectively colour coded to prioritise your plans They automatically highlight the sequence of events you desire. Customers tell us our business organizational chart template venn diagram showing four aspects PowerPoint Slides are specially created by a professional team with vast experience. They diligently strive to come up with the right vehicle for your brilliant Ideas. People tell us our chart PowerPoint templates and PPT Slides are incredible easy to use. Make instructive presentations with our Business Organizational Chart Template Venn Diagram Showing Four Aspects PowerPoint Slides. Dont waste time struggling with PowerPoint. Let us do it for you.

Diagram With Diverging Arrows Ppt Relative Circular Flow Process PowerPoint Slide
We present our diagram with diverging arrows ppt Relative Circular Flow Process PowerPoint Slide.Use our Process and Flows PowerPoint Templates because you have the plans ready for them to absorb and understand. Download our Flow Charts PowerPoint Templates because so that you can Lead the way to spread good cheer to one and all. Download and present our Shapes PowerPoint Templates because it helps you to display your ideas and thoughts. Present our Business PowerPoint Templates because it will demonstrate the strength of character under severe stress. Shine the torch ahead and bring the light to shine on all. Download our Targets PowerPoint Templates because getting it done in time is the key to success.Use these PowerPoint slides for presentations relating to Arrow, background, ball, business, button, catalog,chart, circle, circular, clipart, company,concept, cross, cycle, development,diagram, edit, editable, element, goals, icon, leader, marketing, model, navigation,organization, parts, pie, plans, presentation, report, representation,retro, six, sphere, stakeholder, team. The prominent colors used in the PowerPoint template are Orange, Black, White. Use our diagram with diverging arrows ppt Relative Circular Flow Process PowerPoint Slide are Chic. Professionals tell us our button PowerPoint templates and PPT Slides are Liberated. Customers tell us our diagram with diverging arrows ppt Relative Circular Flow Process PowerPoint Slide are Swanky. Presenters tell us our ball PowerPoint templates and PPT Slides are Charming. You can be sure our diagram with diverging arrows ppt Relative Circular Flow Process PowerPoint Slide are Royal. PowerPoint presentation experts tell us our circular PowerPoint templates and PPT Slides are Colorful. In the market,customer is king. Anoint him with our Diagram With Diverging Arrows Ppt Relative Circular Flow Process PowerPoint Slide.
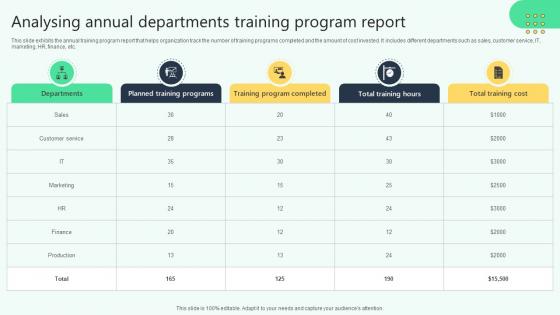
Analysing Annual Departments Training Program Report Analysing Hr Data For Effective Decision Making
This slide exhibits the annual training program report that helps organization track the number of training programs completed and the amount of cost invested. It includes different departments such as sales, customer service, IT, marketing, HR, finance, etc. Slidegeeks is one of the best resources for PowerPoint templates. You can download easily and regulate Analysing Annual Departments Training Program Report Analysing Hr Data For Effective Decision Making for your personal presentations from our wonderful collection. A few clicks is all it takes to discover and get the most relevant and appropriate templates. Use our Templates to add a unique zing and appeal to your presentation and meetings. All the slides are easy to edit and you can use them even for advertisement purposes. This slide exhibits the annual training program report that helps organization track the number of training programs completed and the amount of cost invested. It includes different departments such as sales, customer service, IT, marketing, HR, finance, etc.

Diagram With Diverging Arrows Ppt Relative Circular Flow Process PowerPoint Slides
We present our diagram with diverging arrows ppt Relative Circular Flow Process PowerPoint Slides.Present our Process and Flows PowerPoint Templates because with the help of our Slides you can Illustrate your plans on using the many social media modes available to inform soceity at large of the benefits of your product. Present our Flow Charts PowerPoint Templates because Our PowerPoint Templates and Slides will let you Illuminate the road ahead to Pinpoint the important landmarks along the way. Present our Shapes PowerPoint Templates because Our PowerPoint Templates and Slides will generate and maintain the level of interest you desire. They will create the impression you want to imprint on your audience. Use our Business PowerPoint Templates because watch the excitement levels rise as they realise their worth. Download our Targets PowerPoint Templates because it is a step by step process with levels rising at every stage.Use these PowerPoint slides for presentations relating to Arrow, background, ball, business, button, catalog,chart, circle, circular, clipart, company,concept, cross, cycle, development,diagram, edit, editable, element, goals, icon, leader, marketing, model, navigation,organization, parts, pie, plans, presentation, report, representation,retro, six, sphere, stakeholder, team. The prominent colors used in the PowerPoint template are Yellow, Gray, Black. Use our diagram with diverging arrows ppt Relative Circular Flow Process PowerPoint Slides will impress their bosses and teams. Professionals tell us our button PowerPoint templates and PPT Slides are Bright. Customers tell us our diagram with diverging arrows ppt Relative Circular Flow Process PowerPoint Slides are Vintage. Presenters tell us our catalog PowerPoint templates and PPT Slides are Quaint. You can be sure our diagram with diverging arrows ppt Relative Circular Flow Process PowerPoint Slides will generate and maintain the level of interest you desire. They will create the impression you want to imprint on your audience. PowerPoint presentation experts tell us our chart PowerPoint templates and PPT Slides are Upbeat. Attach importance to your views with our Diagram With Diverging Arrows Ppt Relative Circular Flow Process PowerPoint Slides. You will come out on top.
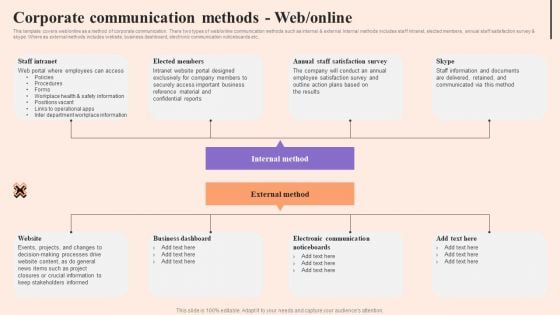
Corporate Communication Strategy Corporate Communication Methods Web Online Portrait PDF
This template covers web online as a method of corporate communication. There two types of web online communication methods such as internal and external. Internal methods includes staff intranet, elected members, annual staff satisfaction survey and skype. Where as external methods includes website, business dashboard, electronic communication noticeboards etc. Make sure to capture your audiences attention in your business displays with our gratis customizable Corporate Communication Strategy Corporate Communication Methods Web Online Portrait PDF. These are great for business strategies, office conferences, capital raising or task suggestions. If you desire to acquire more customers for your tech business and ensure they stay satisfied, create your own sales presentation with these plain slides.
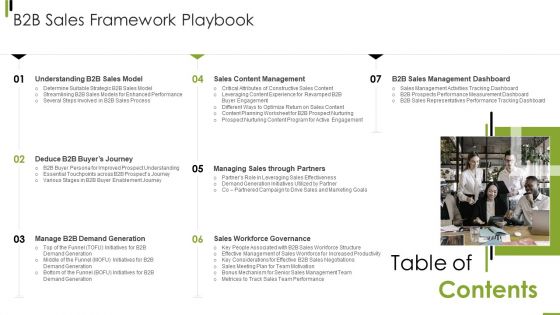
Table Of Contents B2B Sales Framework Playbook Clipart PDF
This is a Table Of Contents B2B Sales Framework Playbook Clipart PDF template with various stages. Focus and dispense information on seven stages using this creative set, that comes with editable features. It contains large content boxes to add your information on topics like Demand Generation, Sales Workforce Governance, Sales Management Dashboard. You can also showcase facts, figures, and other relevant content using this PPT layout. Grab it now.
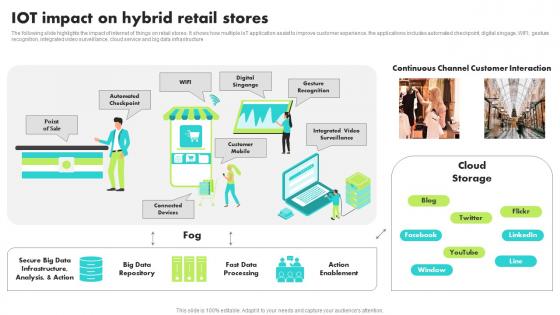
IoT Impact On Hybrid Retail Stores Guide For Retail IoT Solutions Analysis Ideas Pdf
The following slide highlights the impact of internet of things on retail stores. It shows how multiple IoT application assist to improve customer experience, the applications includes automated checkpoint, digital singage, WIFI, gesture recognition, integrated video surveillance, cloud service and big data infrastructure Whether you have daily or monthly meetings, a brilliant presentation is necessary. IoT Impact On Hybrid Retail Stores Guide For Retail IoT Solutions Analysis Ideas Pdf can be your best option for delivering a presentation. Represent everything in detail using IoT Impact On Hybrid Retail Stores Guide For Retail IoT Solutions Analysis Ideas Pdf and make yourself stand out in meetings. The template is versatile and follows a structure that will cater to your requirements. All the templates prepared by Slidegeeks are easy to download and edit. Our research experts have taken care of the corporate themes as well. So, give it a try and see the results. The following slide highlights the impact of internet of things on retail stores. It shows how multiple IoT application assist to improve customer experience, the applications includes automated checkpoint, digital singage, WIFI, gesture recognition, integrated video surveillance, cloud service and big data infrastructure
Usa Ppt Linear Process 7 Phase Diagram Project Management PowerPoint 4 Graphic
USA PPT linear process 7 phase diagram project management powerpoint 4 Graphic-Outline the path you have in mind in order to boost sales and stay ahead of the competition enhancing your corporate reputation as you go along the road to success. Now use this slide to transmit this clarity of purpose onto the eager minds of your team.-USA PPT linear process 7 phase diagram project management powerpoint 4 Graphic-Abstract, Achievement, Adding, Analyzing, Arrow, Art, Background, Blank, Blue, Business, Chart, Color, Colorful, Cycle, Data, Design, Diagram, Element, Flow, Graph, Graphic, Gray, Green, Icon, Linear, Management, Market, Numbers, Percent, Process, Project, Round, Stock, Success Making plans with our Usa Ppt Linear Process 7 Phase Diagram Project Management PowerPoint 4 Graphic entails success. They ensure automatic returns.
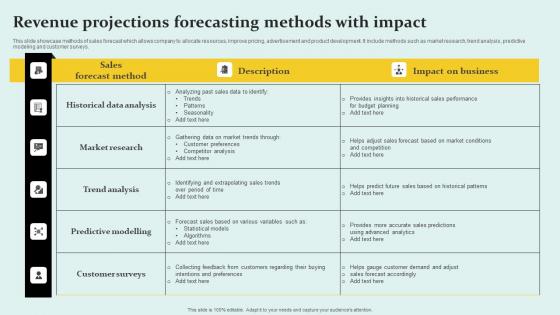
Revenue Projections Forecasting Methods With Impact Background Pdf
This slide showcase methods of sales forecast which allows company to allocate resources, improve pricing, advertisement and product development. It include methods such as market research, trend analysis, predictive modeling and customer surveys. Pitch your topic with ease and precision using this Revenue Projections Forecasting Methods With Impact Background Pdf This layout presents information on Historical Data Analysis, Market Research, Trend Analysis It is also available for immediate download and adjustment. So, changes can be made in the color, design, graphics or any other component to create a unique layout. This slide showcase methods of sales forecast which allows company to allocate resources, improve pricing, advertisement and product development. It include methods such as market research, trend analysis, predictive modeling and customer surveys.


 Continue with Email

 Home
Home


