Product Diagram
Smoke World Pollution Industrial PowerPoint Themes And PowerPoint Slides 0311
Microsoft PowerPoint Theme and Slide with world map shaped smoke rise form factory chimney Get the correct coordination with our Smoke World Pollution Industrial PowerPoint Themes And PowerPoint Slides 0311. They blend beautifully with your thoughts.
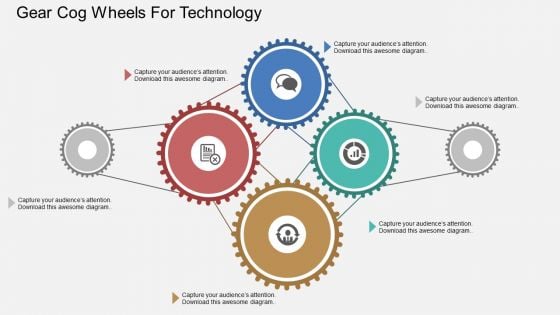
Gear Cog Wheels For Technology Powerpoint Templates
Concept of technology and process control can be defined with this business diagram. This PPT slide contains graphics of gear cog wheels. Present your views using this innovative slide and be assured of leaving a lasting impression
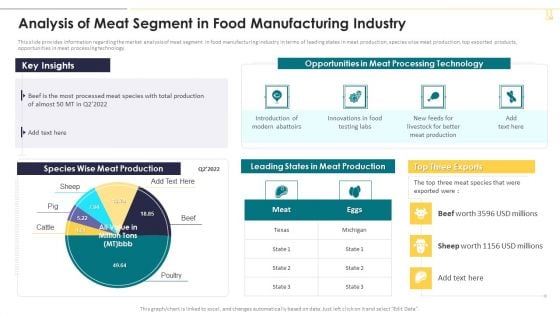
Analysis Of Meat Segment In Food Manufacturing Industry Inspiration PDF
This slide provides information regarding the market analysis of meat segment in food manufacturing industry in terms of leading states in meat production, species wise meat production, top exported products, opportunities in meat processing technology. Deliver an awe inspiring pitch with this creative Analysis Of Meat Segment In Food Manufacturing Industry Inspiration PDF bundle. Topics like Meat Production, Processing Technology can be discussed with this completely editable template. It is available for immediate download depending on the needs and requirements of the user.
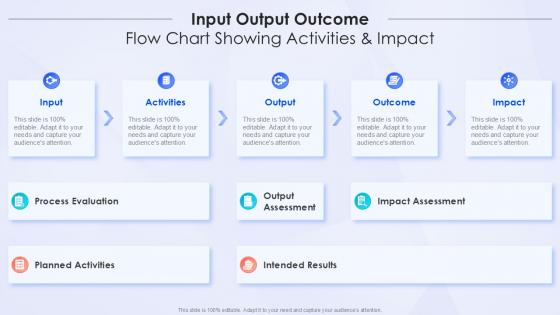
Input Output Outcome Flow Chart Showing Activities And Impact
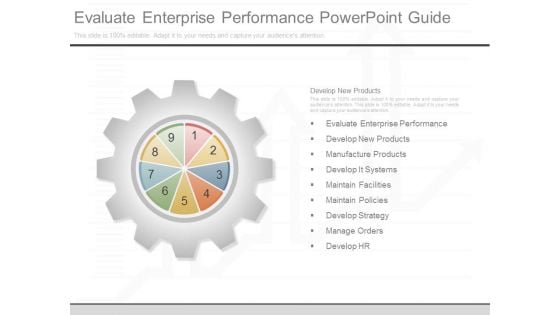
Evaluate Enterprise Performance Powerpoint Guide
This is a evaluate enterprise performance powerpoint guide. This is a nine stage process. The stages in this process are evaluate enterprise performance, develop new products, manufacture products, develop it systems, maintain facilities, maintain policies, develop strategy.
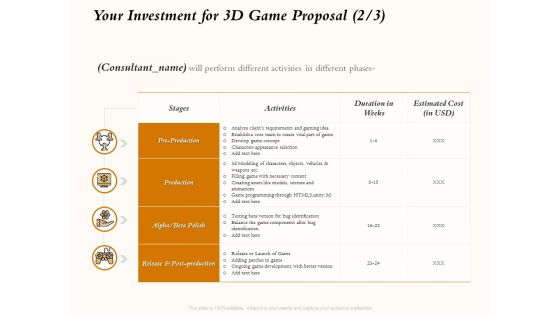
Three Dimensional Games Proposal Your Investment For 3D Game Proposal Cost Ppt Inspiration Themes PDF
Presenting this set of slides with name three dimensional games proposal your investment for 3d game proposal cost ppt inspiration themes pdf. The topics discussed in these slides are pre production, production, release and post production, alpha or beta polish. This is a completely editable PowerPoint presentation and is available for immediate download. Download now and impress your audience.
Laboratory Information Management Transforming Medicare Services Using Health Icons Pdf
This slide covers integration of laboratory information management system LIMS to track medical data. It involves electronic data management system, instrument management and SOP compliance. Welcome to our selection of the Laboratory Information Management Transforming Medicare Services Using Health Icons Pdf. These are designed to help you showcase your creativity and bring your sphere to life. Planning and Innovation are essential for any business that is just starting out. This collection contains the designs that you need for your everyday presentations. All of our PowerPoints are 100 percent editable, so you can customize them to suit your needs. This multi purpose template can be used in various situations. Grab these presentation templates today This slide covers integration of laboratory information management system LIMS to track medical data. It involves electronic data management system, instrument management and SOP compliance.
Column Chart Ppt PowerPoint Presentation Icon Graphics Pictures
This is a column chart ppt powerpoint presentation icon graphics pictures. This is a nine stage process. The stages in this process are product, growth, year, chart, management.

Four Steps For Business Goal Achievement Powerpoint Slides
This PPT slide contains graphics of target diagram. You may download this PowerPoint template to keep focus your team towards business goals. Impress your audiences by using this PPT slide.
Scatter Bubble Chart Ppt PowerPoint Presentation Gallery Icons
This is a scatter bubble chart ppt powerpoint presentation gallery icons. This is a three stage process. The stages in this process are product, finance, business, marketing.
Pie Chart Ppt PowerPoint Presentation Icon Infographic Template
This is a pie chart ppt powerpoint presentation icon infographic template. This is a three stage process. The stages in this process are percentage, product, management, business.
Icons Slide Furniture Manufacturing Firm Investor Funding Ppt Slide
Introducing our well designed Icons Slide Furniture Manufacturing Firm Investor Funding Ppt Slide set of slides. The slide displays editable icons to enhance your visual presentation. The icons can be edited easily. So customize according to your business to achieve a creative edge. Download and share it with your audience. Our Icons Slide Furniture Manufacturing Firm Investor Funding Ppt Slide are topically designed to provide an attractive backdrop to any subject. Use them to look like a presentation pro.
Bar Chart Ppt PowerPoint Presentation Icon Infographic Template
This is a bar chart ppt powerpoint presentation icon infographic template. This is a nine stage process. The stages in this process are product, marketing, management, business, success.
Scatter Chart Ppt PowerPoint Presentation Icon Background Images
This is a scatter chart ppt powerpoint presentation icon background images. This is a one stage process. The stages in this process are percentage, product, business, marketing, management.
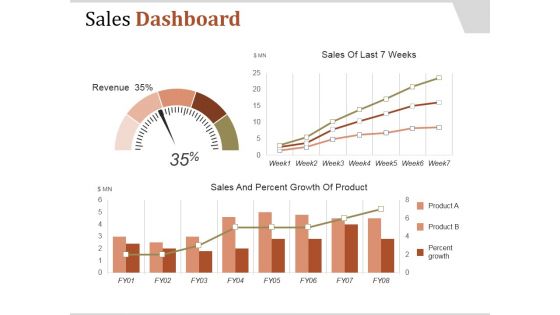
Sales Dashboard Template 1 Ppt PowerPoint Presentation Samples
This is a sales dashboard template 1 ppt powerpoint presentation samples. This is a one stage process. The stages in this process are sales and percent growth of product, revenue, product, percent growth.
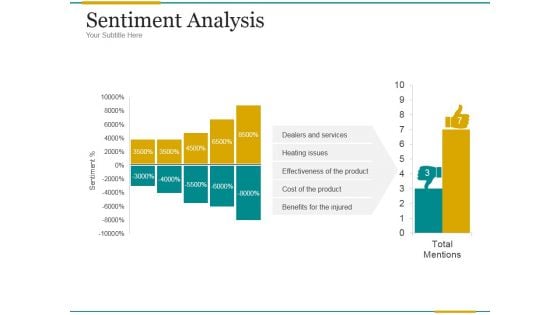
Sentiment Analysis Ppt PowerPoint Presentation Example File
This is a sentiment analysis ppt powerpoint presentation example file. This is a two stage process. The stages in this process are dealers and services, heating issues, effectiveness of the product, cost of the product, benefits for the injured.
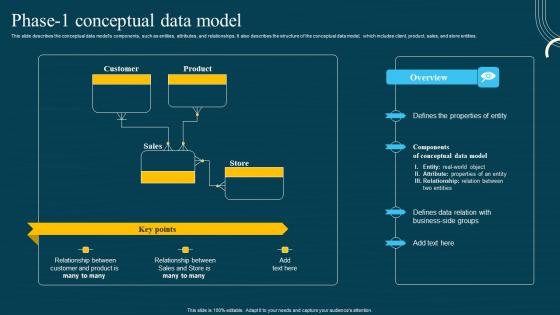
Database Modeling Structures Phase 1 Conceptual Data Model Information Pdf
This slide describes the conceptual data models components, such as entities, attributes, and relationships. It also describes the structure of the conceptual data model, which includes client, product, sales, and store entities. Find a pre-designed and impeccable Database Modeling Structures Phase 1 Conceptual Data Model Information Pdf. The templates can ace your presentation without additional effort. You can download these easy-to-edit presentation templates to make your presentation stand out from others. So, what are you waiting for Download the template from Slidegeeks today and give a unique touch to your presentation. This slide describes the conceptual data models components, such as entities, attributes, and relationships. It also describes the structure of the conceptual data model, which includes client, product, sales, and store entities.
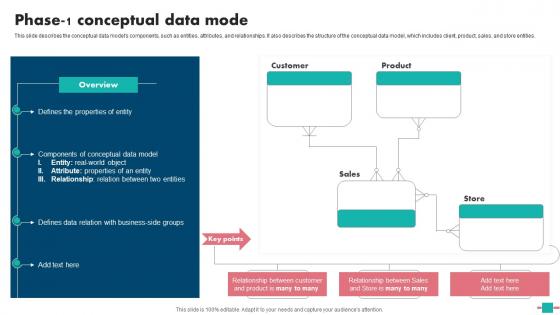
Database Modeling Phase 1 Conceptual Data Mode Formats Pdf
This slide describes the conceptual data models components, such as entities, attributes, and relationships. It also describes the structure of the conceptual data model, which includes client, product, sales, and store entities. Are you in need of a template that can accommodate all of your creative concepts This one is crafted professionally and can be altered to fit any style. Use it with Google Slides or PowerPoint. Include striking photographs, symbols, depictions, and other visuals. Fill, move around, or remove text boxes as desired. Test out color palettes and font mixtures. Edit and save your work, or work with colleagues. Download Database Modeling Phase 1 Conceptual Data Mode Formats Pdf and observe how to make your presentation outstanding. Give an impeccable presentation to your group and make your presentation unforgettable. This slide describes the conceptual data models components, such as entities, attributes, and relationships. It also describes the structure of the conceptual data model, which includes client, product, sales, and store entities.
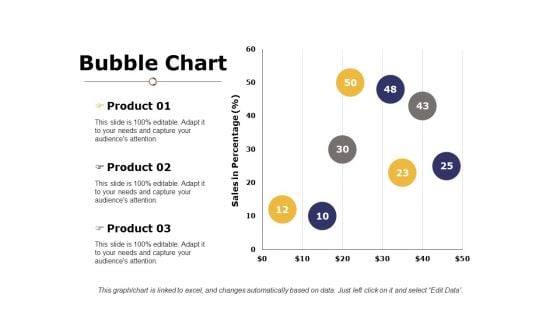
Bubble Chart Ppt PowerPoint Presentation Layouts Demonstration
This is a bubble chart ppt powerpoint presentation icon structure. This is a three stage process. The stages in this process are product, sales in percentage, bubble chart.
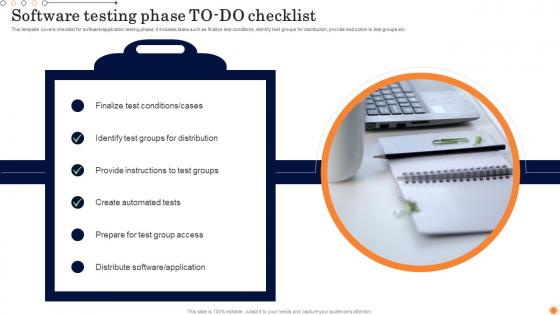
Design Develop Customized Software Guides Software Testing Phase To Do Checklist Infographics Pdf
This template covers checklist for software application testing phase. It includes tasks such as finalize test conditions, identify test groups for distribution, provide instruction to test groups etc. Whether you have daily or monthly meetings, a brilliant presentation is necessary. Design Develop Customized Software Guides Software Testing Phase To Do Checklist Infographics Pdf can be your best option for delivering a presentation. Represent everything in detail using Design Develop Customized Software Guides Software Testing Phase To Do Checklist Infographics Pdf and make yourself stand out in meetings. The template is versatile and follows a structure that will cater to your requirements. All the templates prepared by Slidegeeks are easy to download and edit. Our research experts have taken care of the corporate themes as well. So, give it a try and see the results. This template covers checklist for software application testing phase. It includes tasks such as finalize test conditions, identify test groups for distribution, provide instruction to test groups etc.
Three Dimensional Games Proposal Our Process For 3D Game Proposal Icons PDF
Presenting this set of slides with name three dimensional games proposal our process for 3d game proposal icons pdf. The topics discussed in these slides are pre production, production, release and post production, alpha or beta polish. This is a completely editable PowerPoint presentation and is available for immediate download. Download now and impress your audience.
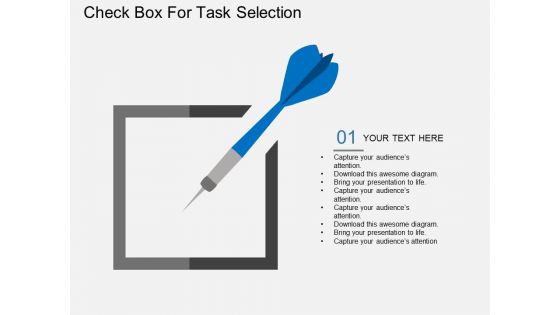
Check Box For Task Selection Powerpoint Template
This PowerPoint template has been designed with check box diagram. You may download this business slide to display task selection criteria. This PPT slide will help you to sequence your thoughts.
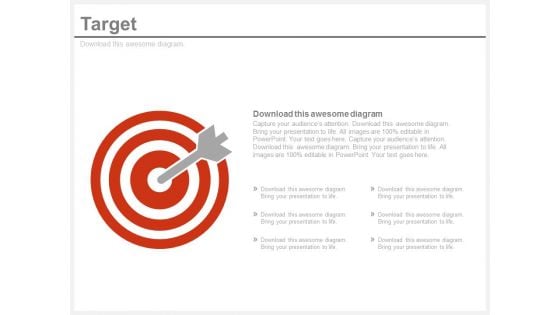
Arrow Hits On Red Target Board Powerpoint Slides
This PowerPoint template has been designed with red target board diagram. You may use this PPT slide to display target strategy and planning. Impress your audiences by using this PPT slide.
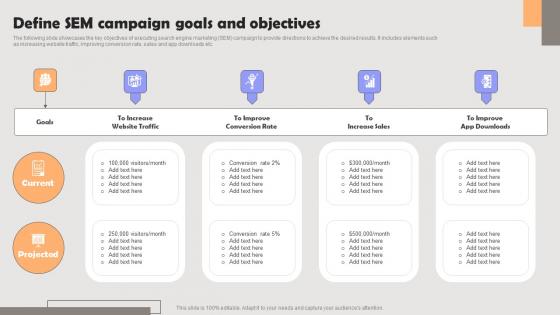
Improving PPC Campaign Results Define Sem Campaign Goals And Objectives Template Pdf
The following slide showcases the key objectives of executing search engine marketing SEM campaign to provide directions to achieve the desired results. It includes elements such as increasing website traffic, improving conversion rate, sales and app downloads etc. Whether you have daily or monthly meetings, a brilliant presentation is necessary. Improving PPC Campaign Results Define Sem Campaign Goals And Objectives Template Pdf can be your best option for delivering a presentation. Represent everything in detail using Improving PPC Campaign Results Define Sem Campaign Goals And Objectives Template Pdf and make yourself stand out in meetings. The template is versatile and follows a structure that will cater to your requirements. All the templates prepared by Slidegeeks are easy to download and edit. Our research experts have taken care of the corporate themes as well. So, give it a try and see the results. The following slide showcases the key objectives of executing search engine marketing SEM campaign to provide directions to achieve the desired results. It includes elements such as increasing website traffic, improving conversion rate, sales and app downloads etc.
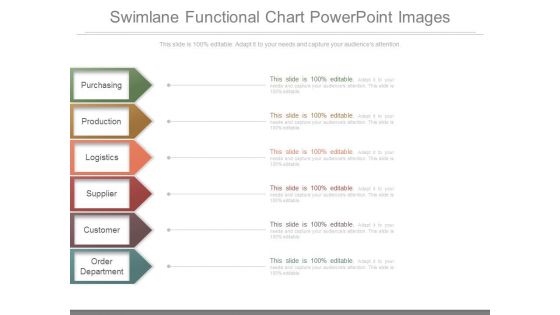
Swimlane Functional Chart Powerpoint Images
This is a swimlane functional chart powerpoint images. This is a six stage process. The stages in this process are purchasing, production, logistics, supplier, customer, order department.

Three Steps To Achieve Business Goals Ppt PowerPoint Presentation Infographic Template Graphic Tips
Presenting this set of slides with name three steps to achieve business goals ppt powerpoint presentation infographic template graphic tips. This is a three stage process. The stages in this process are 3 step circle diagram, process infographic, business goals. This is a completely editable PowerPoint presentation and is available for immediate download. Download now and impress your audience.
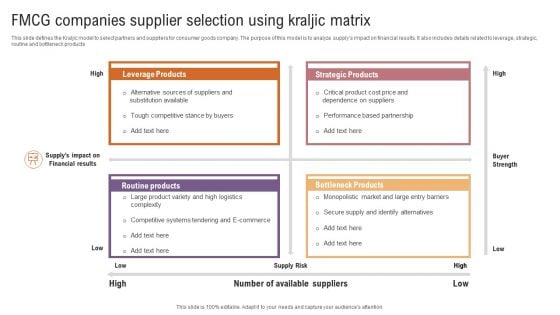
FMCG Companies Supplier Selection Using Kraljic Matrix Guidelines PDF
This slide defines the Kraljic model to select partners and suppliers for consumer goods company. The purpose of this model is to analyze supplys impact on financial results. It also includes details related to leverage, strategic, routine and bottleneck products. Persuade your audience using this FMCG Companies Supplier Selection Using Kraljic Matrix Guidelines PDF. This PPT design covers Four stages, thus making it a great tool to use. It also caters to a variety of topics including Leverage Products, Strategic Products, Routine Products, Bottleneck Products. Download this PPT design now to present a convincing pitch that not only emphasizes the topic but also showcases your presentation skills.
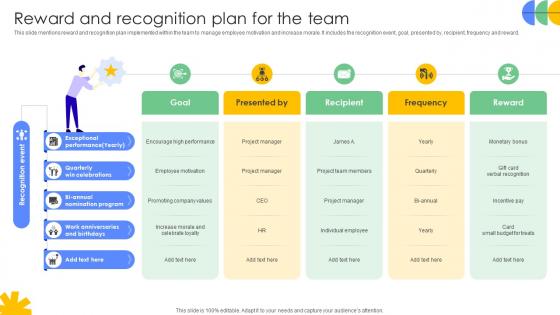
Driving Results Designing A Team Reward And Recognition Plan For The Team
This slide mentions reward and recognition plan implemented within the team to manage employee motivation and increase morale. It includes the recognition event, goal, presented by, recipient, frequency and reward. Are you searching for a Driving Results Designing A Team Reward And Recognition Plan For The Team that is uncluttered, straightforward, and original Its easy to edit, and you can change the colors to suit your personal or business branding. For a presentation that expresses how much effort you have put in, this template is ideal With all of its features, including tables, diagrams, statistics, and lists, its perfect for a business plan presentation. Make your ideas more appealing with these professional slides. Download Driving Results Designing A Team Reward And Recognition Plan For The Team from Slidegeeks today. This slide mentions reward and recognition plan implemented within the team to manage employee motivation and increase morale. It includes the recognition event, goal, presented by, recipient, frequency and reward.

Line Chart Ppt PowerPoint Presentation Visual Aids
This is a line chart ppt powerpoint presentation visual aids. This is a two stage process. The stages in this process are product, line chart, growth, strategy, business.
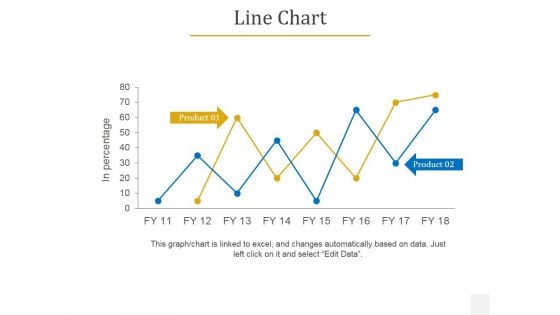
Line Chart Ppt PowerPoint Presentation Summary Picture
This is a line chart ppt powerpoint presentation summary picture. This is a two stage process. The stages in this process are business, marketing, line chart, management, product.
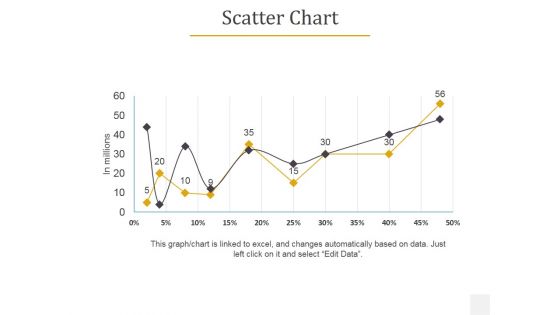
Scatter Chart Ppt PowerPoint Presentation Inspiration Styles
This is a scatter chart ppt powerpoint presentation inspiration styles. This is a two stage process. The stages in this process are business, chart, marketing, product, management.
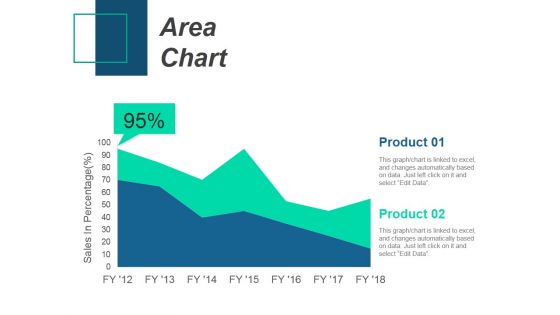
Area Chart Ppt PowerPoint Presentation Inspiration Images
This is a area chart ppt powerpoint presentation inspiration images. This is a two stage process. The stages in this process are area chart, product, sales in percentage.
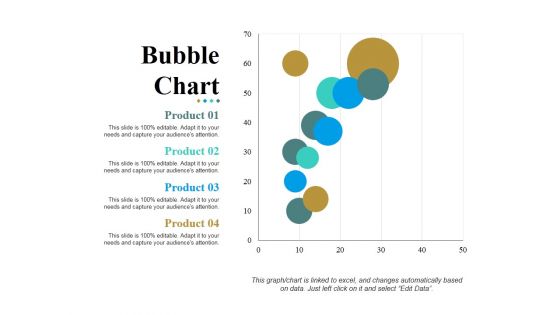
Bubble Chart Ppt PowerPoint Presentation Ideas Slideshow
This is a bubble chart ppt powerpoint presentation ideas slideshow. This is a four stage process. The stages in this process are product, business, marketing, chart.
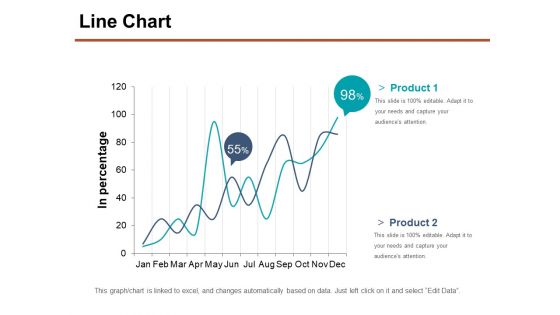
Line Chart Ppt PowerPoint Presentation Styles Introduction
This is a line chart ppt powerpoint presentation styles introduction. This is a two stage process. The stages in this process are in percentage, product, chart, business, marketing.
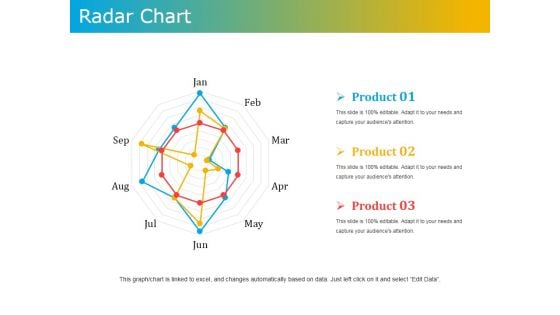
Radar Chart Ppt PowerPoint Presentation Outline Model
This is a radar chart ppt powerpoint presentation outline model. This is a three stage process. The stages in this process are radar chart, product, business, marketing, management.
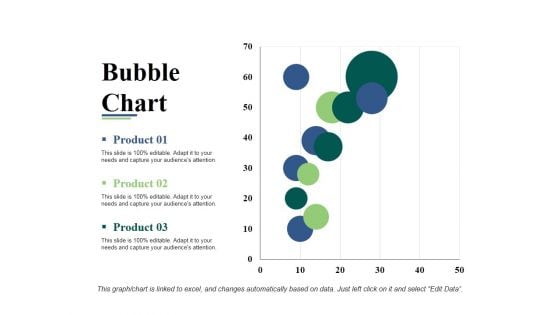
Bubble Chart Ppt PowerPoint Presentation Model Gallery
This is a bubble chart ppt powerpoint presentation model gallery. This is a three stage process. The stages in this process are product, bubble chart, business, marketing, graph.
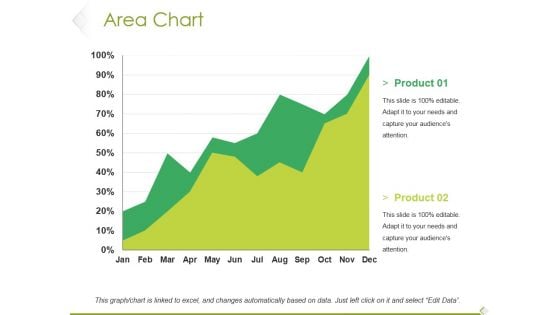
Area Chart Ppt PowerPoint Presentation Background Image
This is a area chart ppt powerpoint presentation background image. This is a two stage process. The stages in this process are product, area chart, business, growth, success.
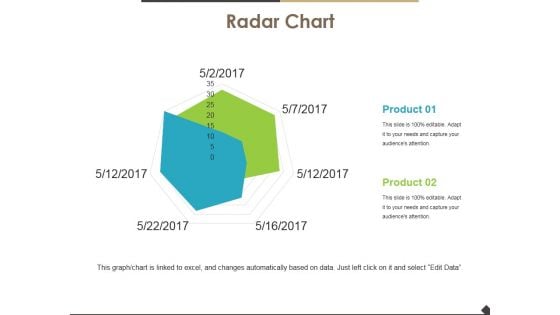
Radar Chart Ppt PowerPoint Presentation Inspiration Layouts
This is a radar chart ppt powerpoint presentation inspiration layouts. This is a two stage process. The stages in this process are radar chart, product, marketing, strategy, analysis.
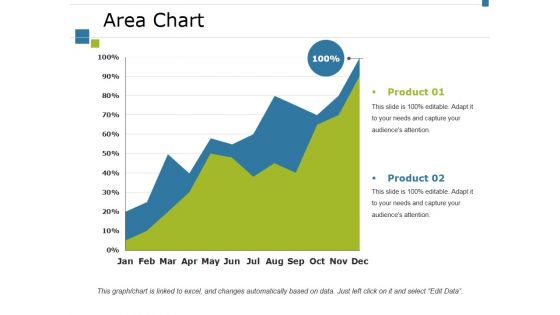
Area Chart Ppt PowerPoint Presentation Ideas Deck
This is a area chart ppt powerpoint presentation ideas deck. This is a two stage process. The stages in this process are product, area chart, success, growth, business.
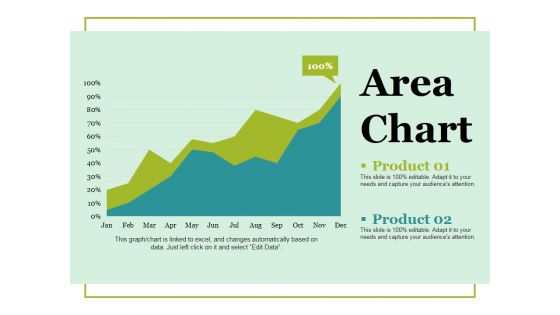
Area Chart Ppt PowerPoint Presentation Layouts Visuals
This is a area chart ppt powerpoint presentation layouts visuals. This is a two stage process. The stages in this process are product, area chart, growth, success, business.
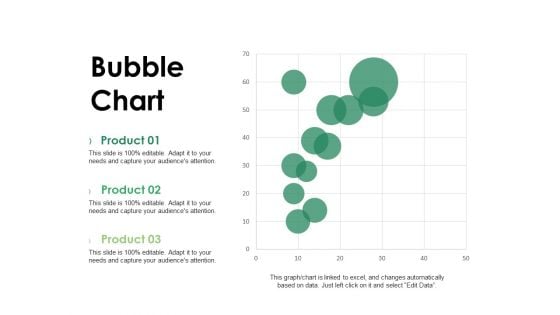
Bubble Chart Ppt PowerPoint Presentation Model Influencers
This is a bubble chart ppt powerpoint presentation model influencers. This is a three stage process. The stages in this process are product, bubble chart, business, marketing, management.
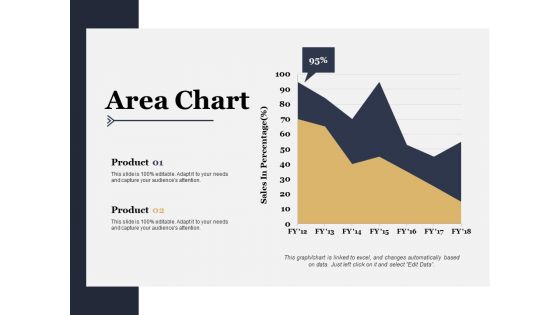
Area Chart Ppt PowerPoint Presentation Styles Professional
This is a area chart ppt powerpoint presentation styles professional. This is a two stage process. The stages in this process are sales in percentage, product, area chart.
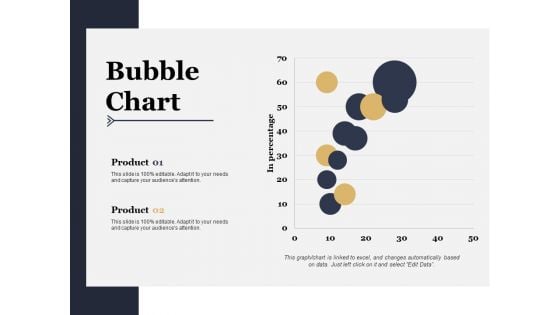
Bubble Chart Ppt PowerPoint Presentation Outline Demonstration
This is a bubble chart ppt powerpoint presentation outline demonstration. This is a two stage process. The stages in this process are bubble chart, product, in percentage.
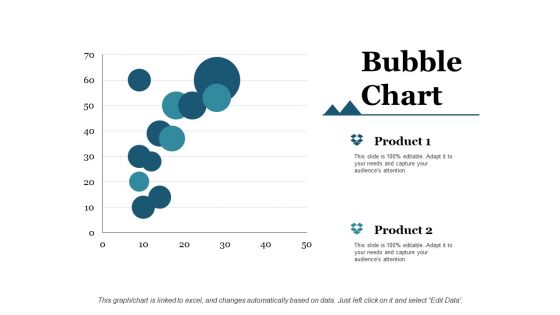
Bubble Chart Ppt PowerPoint Presentation Outline Example
This is a bubble chart ppt powerpoint presentation outline example. This is a two stage process. The stages in this process are bubble chart, product, growth.
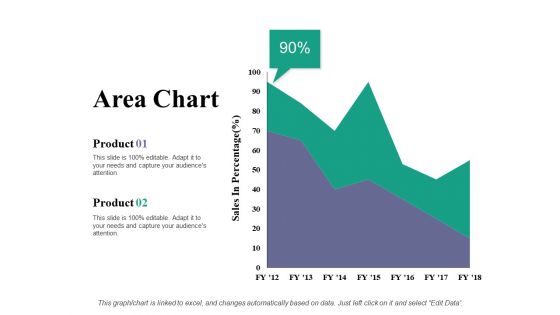
Area Chart Ppt PowerPoint Presentation Portfolio Examples
This is a area chart ppt powerpoint presentation portfolio examples. This is a two stage process. The stages in this process are product, area chart, sales in percentage.
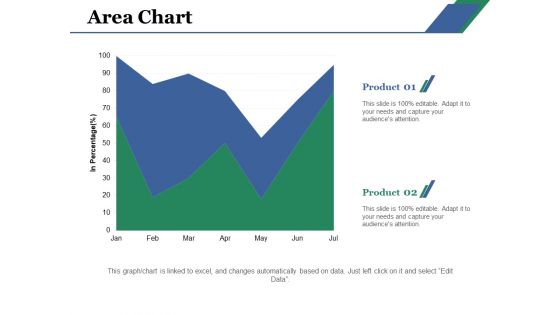
Area Chart Ppt PowerPoint Presentation Layouts Gridlines
This is a area chart ppt powerpoint presentation layouts gridlines. This is a two stage process. The stages in this process are area chart, product, percentage, analysis, capture.
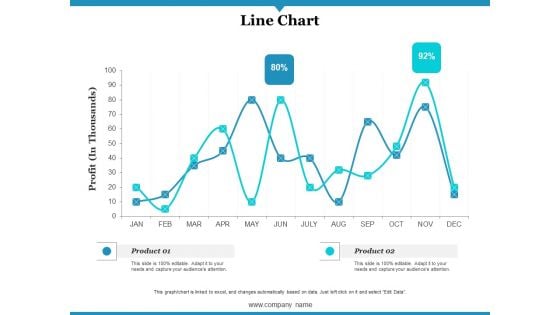
Line Chart Ppt PowerPoint Presentation Gallery Infographics
This is a line chart ppt powerpoint presentation gallery infographics. This is a two stage process. The stages in this process are profit, product, line chart.
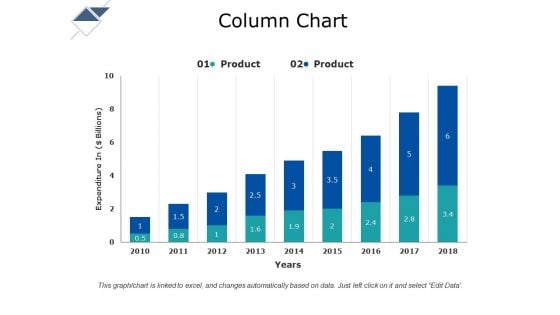
Column Chart Ppt PowerPoint Presentation Gallery Show
This is a column chart ppt powerpoint presentation gallery show. This is a two stage process. The stages in this process are column chart, product, year, expenditure, growth.
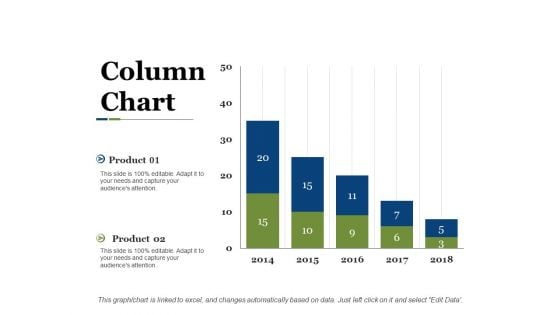
Column Chart Ppt PowerPoint Presentation Layouts Images
This is a column chart ppt powerpoint presentation layouts images. This is a two stage process. The stages in this process are product, column chart, bar graph, marketing.
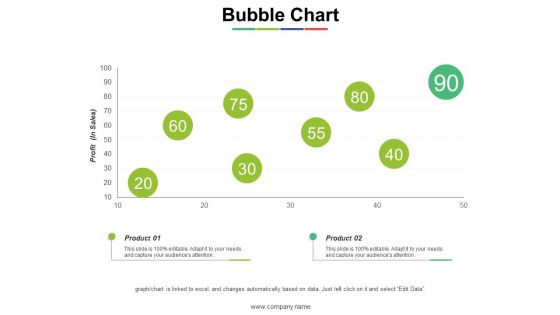
Bubble Chart Ppt PowerPoint Presentation Summary Background
This is a bubble chart ppt powerpoint presentation summary background. This is a two stage process. The stages in this process are bubble chart, profit, product, finance, business.
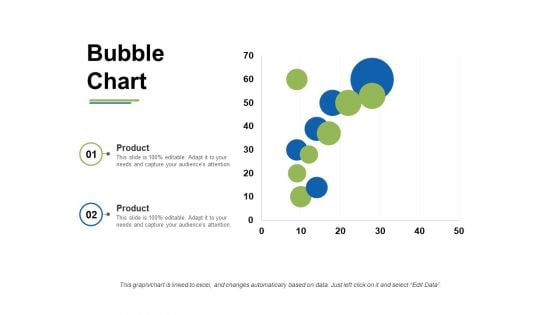
Bubble Chart Ppt PowerPoint Presentation Slides Portrait
This is a bubble chart ppt powerpoint presentation slides portrait. This is a two stage process. The stages in this process are bubble chart, product, finance, business, marketing.
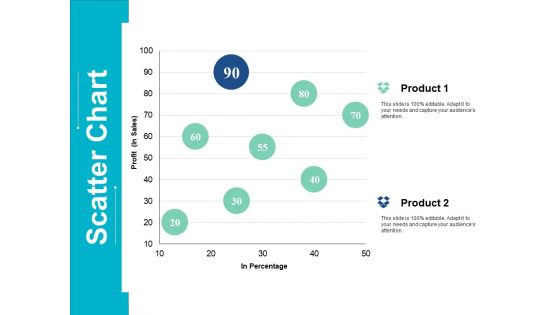
Scatter Chart Ppt PowerPoint Presentation Styles Guidelines
This is a scatter chart ppt powerpoint presentation styles guidelines. This is a two stage process. The stages in this process are scatter chart, percentage, product.
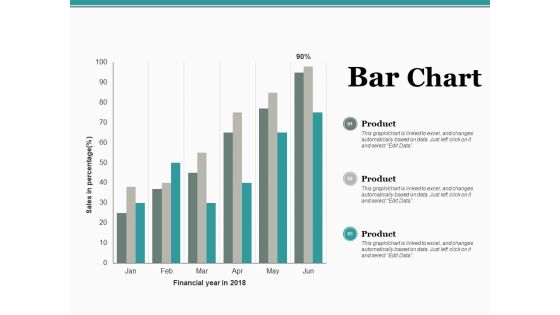
Bar Chart Ppt PowerPoint Presentation Inspiration Outfit
This is a bar chart ppt powerpoint presentation inspiration outfit. This is a three stage process. The stages in this process are percentage, product, bar chart, marketing.
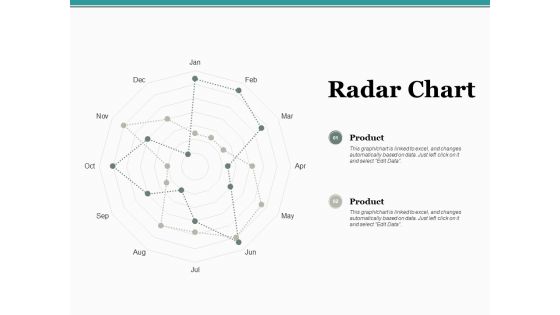
Radar Chart Ppt PowerPoint Presentation Professional Ideas
This is a radar chart ppt powerpoint presentation professional ideas. This is a two stage process. The stages in this process are product, percentage, management, marketing, chart.
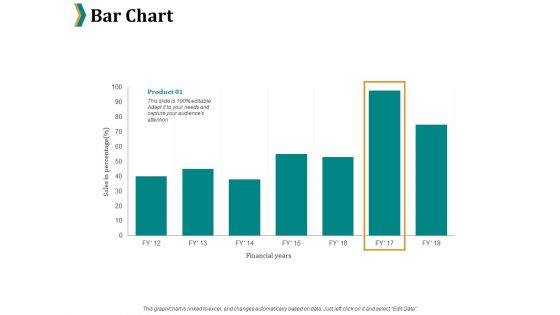
Bar Chart Ppt PowerPoint Presentation Portfolio Slides
This is a bar chart ppt powerpoint presentation portfolio slides. This is a one stage process. The stages in this process are product, percentage, marketing, business, bar chart.
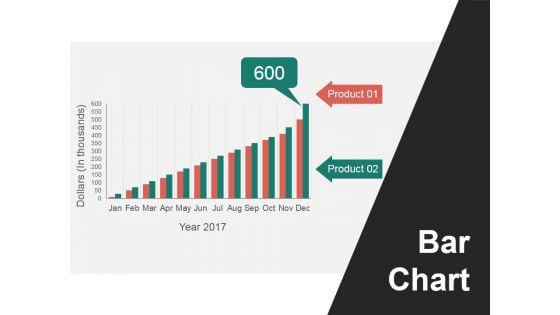
Bar Chart Ppt PowerPoint Presentation Pictures Mockup
This is a bar chart ppt powerpoint presentation pictures mockup. This is a twelve stage process. The stages in this process are dollars, product, bar chart.
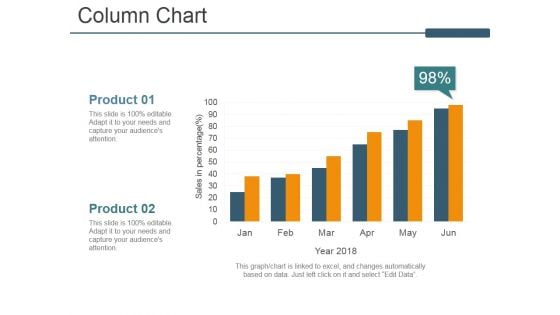
Column Chart Ppt PowerPoint Presentation Ideas Guidelines
This is a column chart ppt powerpoint presentation ideas guidelines. This is a two stage process. The stages in this process are column chart, product, year, business, marketing.
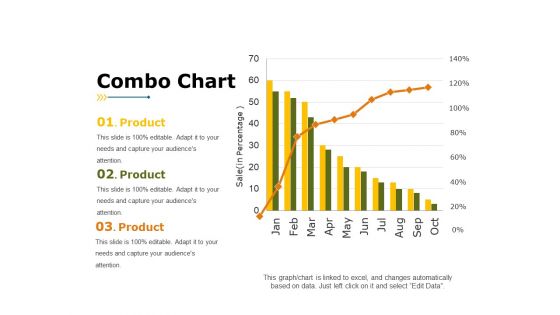
Combo Chart Ppt PowerPoint Presentation Portfolio Template
This is a combo chart ppt powerpoint presentation portfolio template. This is a three stage process. The stages in this process are product, business, marketing, combo chart, percentage.
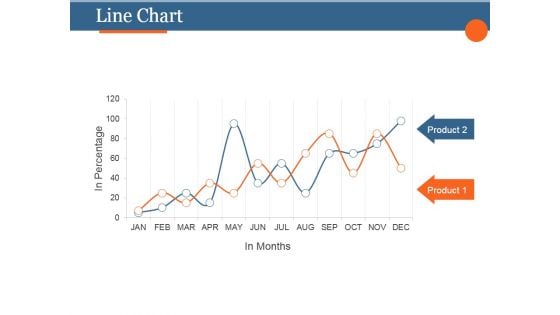
Line Chart Ppt PowerPoint Presentation Background Image
This is a line chart ppt powerpoint presentation background image. This is a two stage process. The stages in this process are product, planning, strategy, marketing, management.
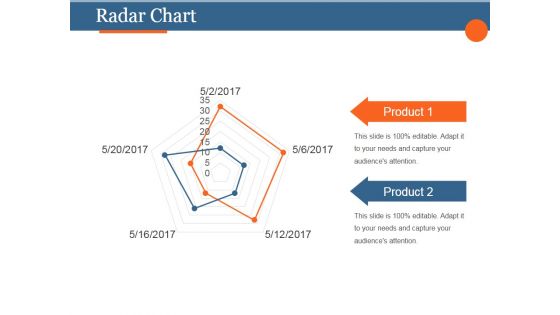
Radar Chart Ppt PowerPoint Presentation Slide
This is a radar chart ppt powerpoint presentation slide. This is a two stage process. The stages in this process are product, strategy, marketing, management, business.


 Continue with Email

 Home
Home


