Product Diagram
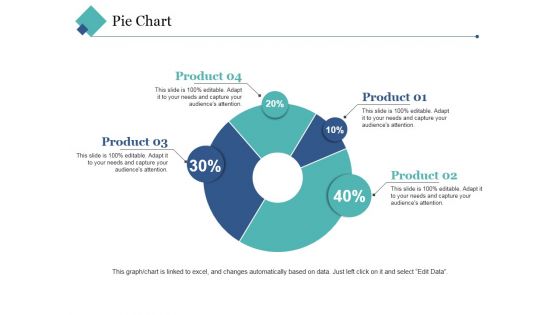
Pie Chart Ppt PowerPoint Presentation Layouts Elements
This is a pie chart ppt powerpoint presentation layouts elements. This is a four stage process. The stages in this process are product, business, marketing, percentage, growth.
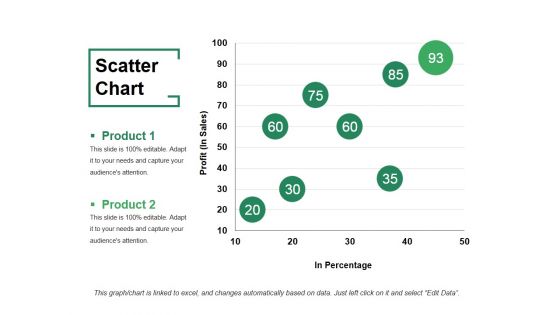
Scatter Chart Ppt PowerPoint Presentation File Visuals
This is a scatter chart ppt powerpoint presentation file visuals. This is a two stage process. The stages in this process are product, profit, in percentage, growth, success.
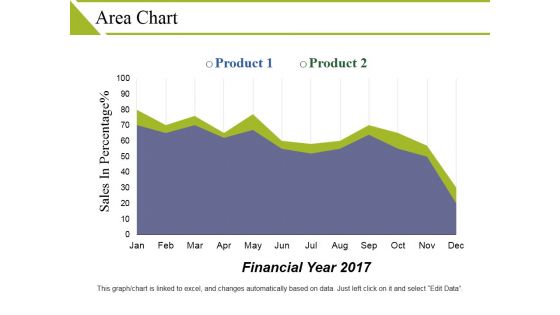
Area Chart Ppt PowerPoint Presentation Outline Objects
This is a area chart ppt powerpoint presentation outline objects. This is a two stage process. The stages in this process are product, sales in percentage, financial year.
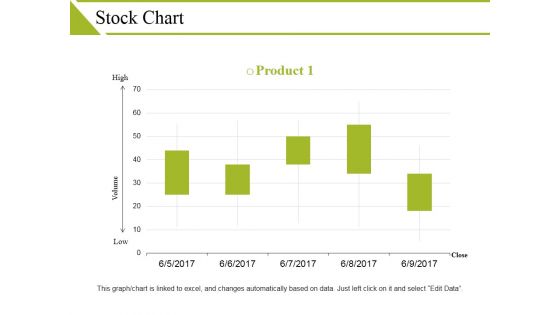
Stock Chart Ppt PowerPoint Presentation Show Guidelines
This is a stock chart ppt powerpoint presentation show guidelines. This is a one stage process. The stages in this process are high, volume, low, product, close.
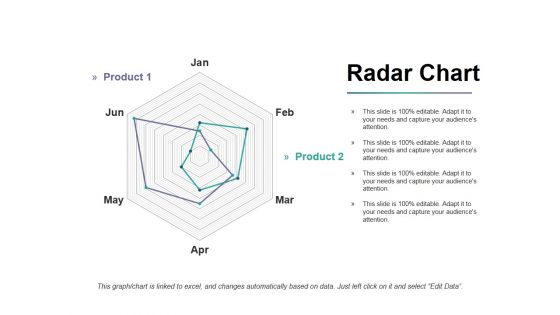
Radar Chart Ppt PowerPoint Presentation Infographics Portfolio
This is a radar chart ppt powerpoint presentation infographics portfolio. This is a two stage process. The stages in this process are product, finance, shapes, business, marketing.
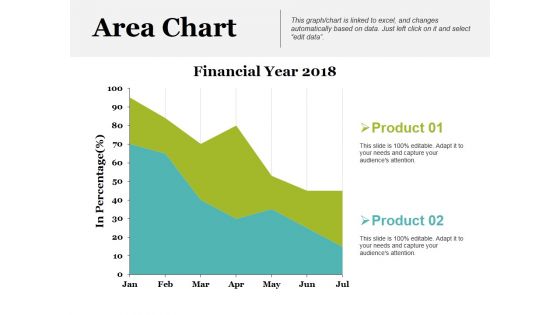
Area Chart Ppt PowerPoint Presentation Show Backgrounds
This is a area chart ppt powerpoint presentation show backgrounds. This is a two stage process. The stages in this process are financial year, product, in percentage.
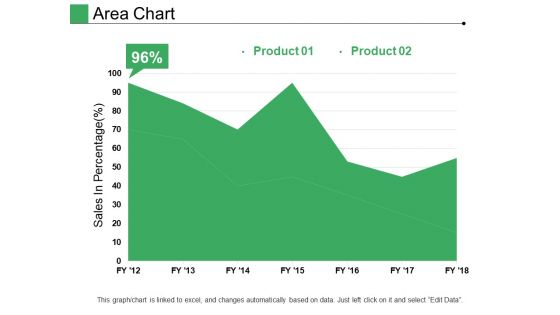
Area Chart Ppt PowerPoint Presentation Pictures Designs
This is a area chart ppt powerpoint presentation pictures designs. This is a two stage process. The stages in this process are product, sales in percentage, growth, success.
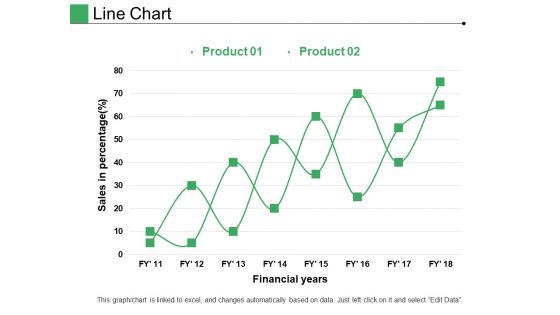
Line Chart Ppt PowerPoint Presentation Pictures Layout
This is a line chart ppt powerpoint presentation pictures layout. This is a two stage process. The stages in this process are product, financial years, sales in percentage.
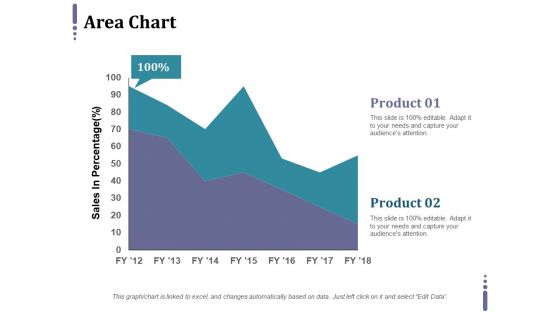
Area Chart Ppt PowerPoint Presentation Professional Grid
This is a area chart ppt powerpoint presentation professional grid. This is a two stage process. The stages in this process are product, sales in percentage, business.
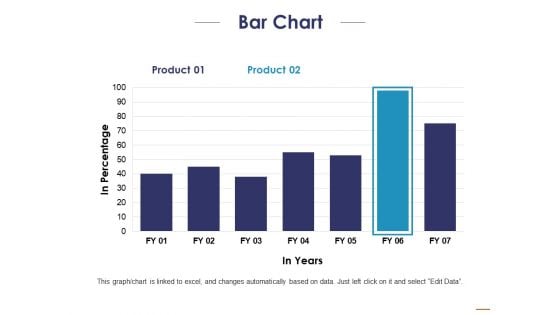
Bar Chart Ppt PowerPoint Presentation Portfolio Inspiration
This is a bar chart ppt powerpoint presentation portfolio inspiration. This is a two stage process. The stages in this process are product, in percentage, in years.
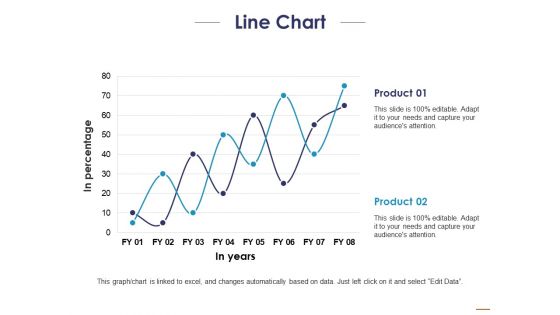
Line Chart Ppt PowerPoint Presentation Layouts Templates
This is a line chart ppt powerpoint presentation layouts templates. This is a two stage process. The stages in this process are product, in percentage, in years.
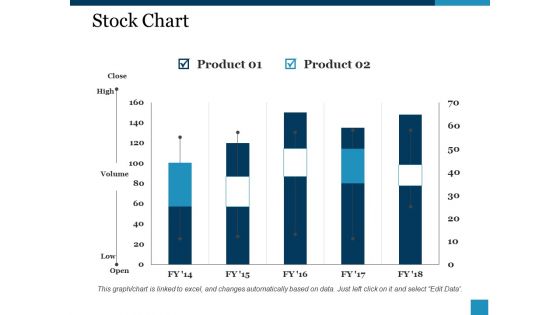
Stock Chart Ppt PowerPoint Presentation Guide
This is a stock chart ppt powerpoint presentation guide. This is a two stage process. The stages in this process are product, close, high, volume, low.
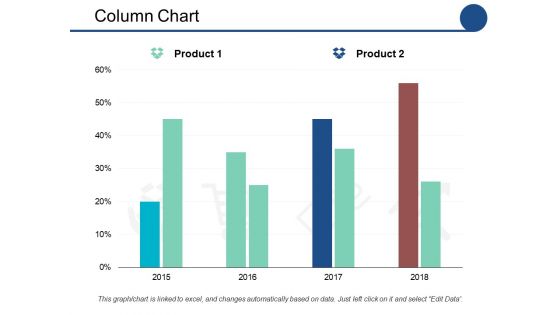
Column Chart Ppt PowerPoint Presentation Show Outfit
This is a column chart ppt powerpoint presentation show outfit. This is a two stage process. The stages in this process are product, percentage, marketing.
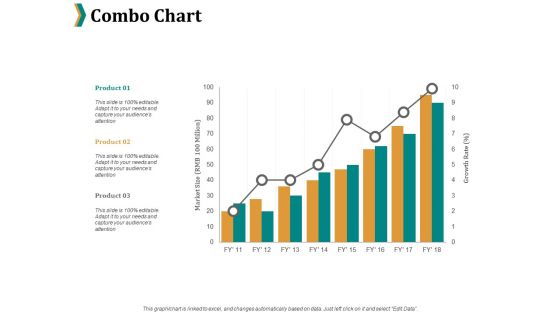
Combo Chart Ppt PowerPoint Presentation File Example
This is a combo chart ppt powerpoint presentation file example. This is a three stage process. The stages in this process are product, percentage, marketing, business, management.
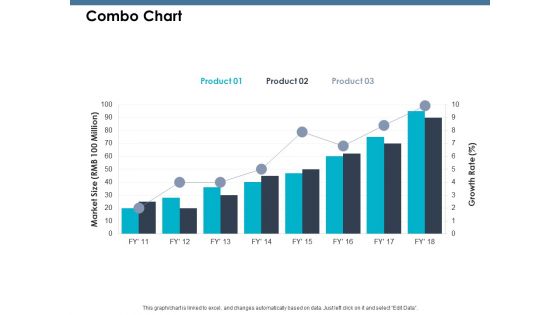
Combo Chart Ppt PowerPoint Presentation Model Grid
This is a combo chart ppt powerpoint presentation model grid. This is a three stage process. The stages in this process are growth, product, percentage, marketing.
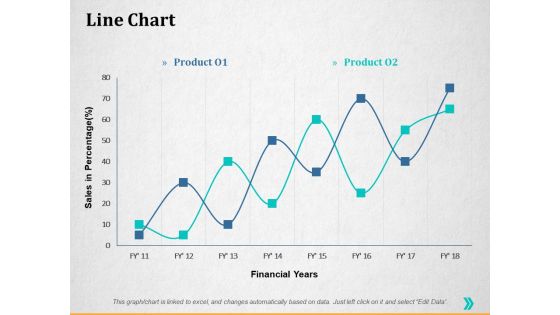
Line Chart Ppt PowerPoint Presentation Summary Guidelines
This is a line chart ppt powerpoint presentation summary guidelines. This is a two stage process. The stages in this process are percentage, product, business, management, marketing.
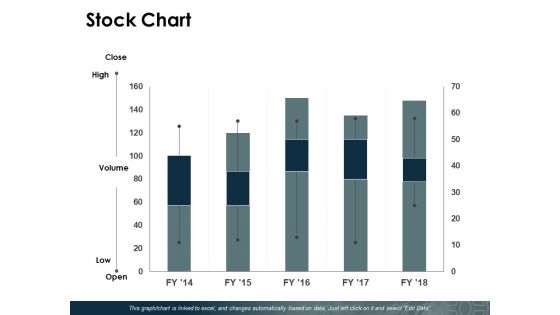
Stock Chart Ppt PowerPoint Presentation Show Pictures
This is a stock chart ppt powerpoint presentation show pictures. This is a five stage process. The stages in this process are product, percentage, management, marketing.

Pie Chart Ppt PowerPoint Presentation Model Smartart
This is a pie chart ppt powerpoint presentation model smartart. This is a five stage process. The stages in this process are management, marketing, business, percentage, product.
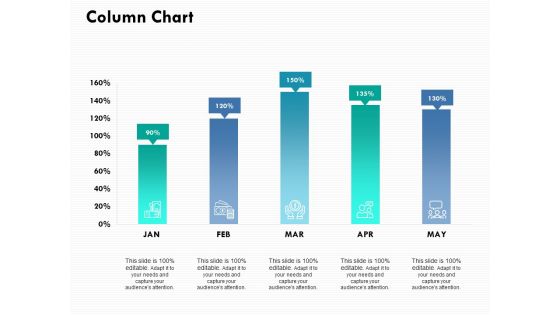
Column Chart Ppt PowerPoint Presentation Ideas Example
This is a column chart ppt powerpoint presentation ideas example. This is a five stage process. The stages in this process are percentage, product, management, marketing.
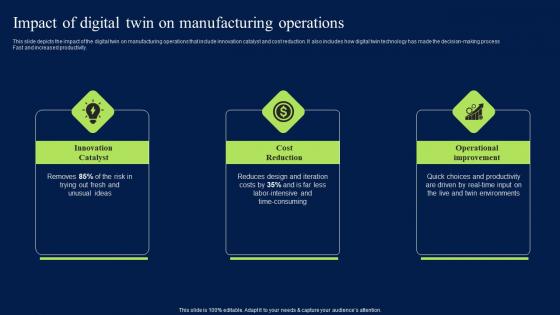
Impact Of Digital Twin On Manufacturing Operations Themes PDF
This slide depicts the impact of the digital twin on manufacturing operations that include innovation catalyst and cost reduction. It also includes how digital twin technology has made the decision-making process fast and increased productivity. Whether you have daily or monthly meetings, a brilliant presentation is necessary. Impact Of Digital Twin On Manufacturing Operations Themes PDF can be your best option for delivering a presentation. Represent everything in detail using Impact Of Digital Twin On Manufacturing Operations Themes PDF and make yourself stand out in meetings. The template is versatile and follows a structure that will cater to your requirements. All the templates prepared by Slidegeeks are easy to download and edit. Our research experts have taken care of the corporate themes as well. So, give it a try and see the results. This slide depicts the impact of the digital twin on manufacturing operations that include innovation catalyst and cost reduction. It also includes how digital twin technology has made the decision-making process Fast and increased productivity.
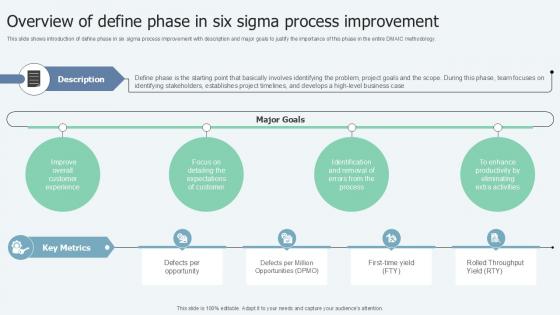
Overview Of Define Phase In Lean Six Sigma In Manufacturing Ppt Sample
This slide shows introduction of define phase in six sigma process improvement with description and major goals to justify the importance of this phase in the entire DMAIC methodology. Create an editable Overview Of Define Phase In Lean Six Sigma In Manufacturing Ppt Sample that communicates your idea and engages your audience. Whether you are presenting a business or an educational presentation, pre-designed presentation templates help save time. Overview Of Define Phase In Lean Six Sigma In Manufacturing Ppt Sample is highly customizable and very easy to edit, covering many different styles from creative to business presentations. Slidegeeks has creative team members who have crafted amazing templates. So, go and get them without any delay. This slide shows introduction of define phase in six sigma process improvement with description and major goals to justify the importance of this phase in the entire DMAIC methodology.

Our Performance Indicators Powerpoint Themes
This is a our performance indicators powerpoint themes. This is a five stage process. The stages in this process are cash flow, turnover, productivity, customer satisfaction, net income.
Fertility Human Science Icon Ppt Powerpoint Presentation Styles Vector
This is a fertility human science icon ppt powerpoint presentation styles vector. This is a three stage process. The stages in this process are fertility, productiveness, fecundity.
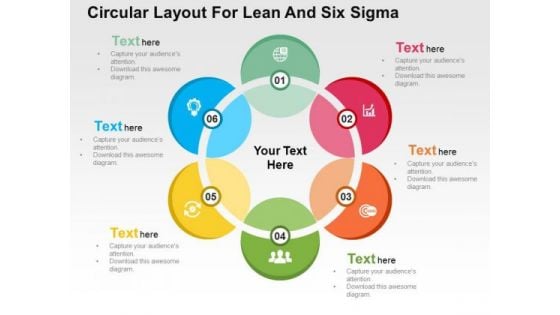
Circular Layout For Lean And Six Sigma PowerPoint Templates
Create visually amazing presentations with this circular diagram. Use this business slide to depict lean and Six Sigma. You may use this slide to share a plan to achieve the desired goals.
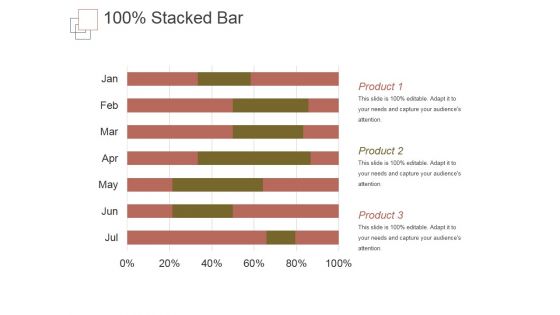
Stacked Bar Template 1 Ppt PowerPoint Presentation Themes
This is a stacked bar template 1 ppt powerpoint presentation themes. This is a six stage process. The stages in this process are product, business, marketing, success, management.
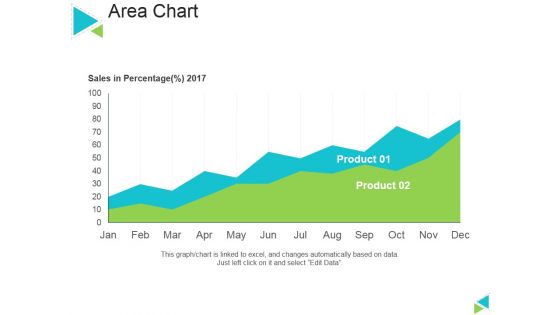
Area Chart Ppt PowerPoint Presentation Inspiration Themes
This is a area chart ppt powerpoint presentation inspiration themes. This is a two stage process. The stages in this process are sales in percentage, product, area chart, business, marketing.
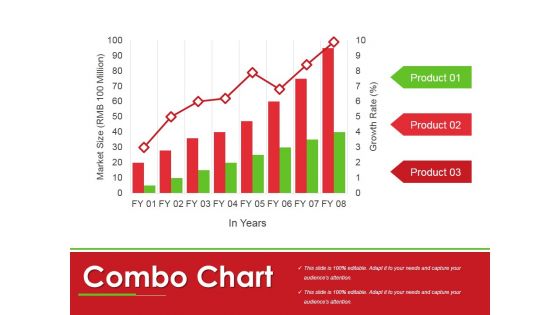
Combo Chart Ppt PowerPoint Presentation Portfolio Themes
This is a combo chart ppt powerpoint presentation portfolio themes. This is a three stage process. The stages in this process are market size, product, management, finance, chart, marketing.
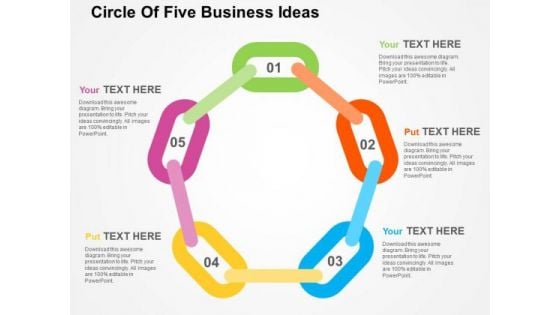
Circle Of Five Business Ideas PowerPoint Templates
Create visually amazing presentations with this circular diagram. Use this business slide to depict circular flow of activities. You may use this slide to share a plan to achieve the desired goals.
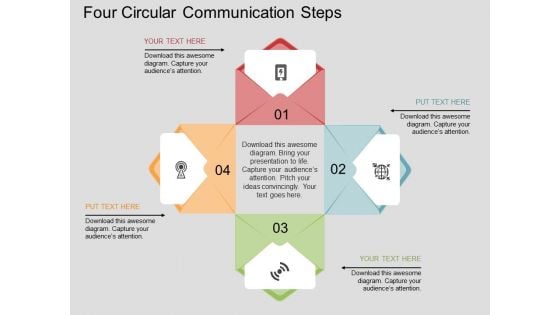
Four Circular Communication Steps Powerpoint Templates
Create visually amazing presentations with this circular diagram. This business slide contains graphics of communication steps in circular flow. You may use this slide to share a plan and to achieve the desired goals.
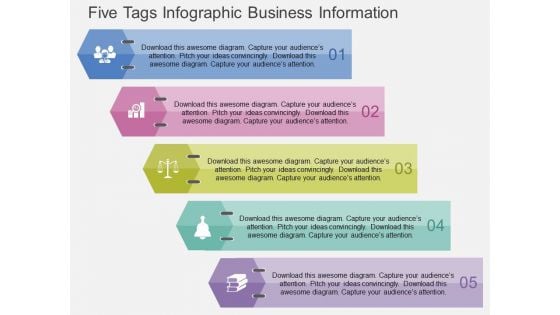
Five Tags Infographic Business Information Powerpoint Templates
This business slide has been designed with five tags infographic. Amplify your thoughts via this appropriate slide relating to target, success, goals etc. Make awesome presentations with this professionally designed diagram.

Man Moving On Stairs Towards Trophy Powerpoint Templates
Create visually amazing presentations with this business diagram. Use this business slide to depict concepts of progress, success, and winner. You may use this slide to share a plan to achieve the desired goals.
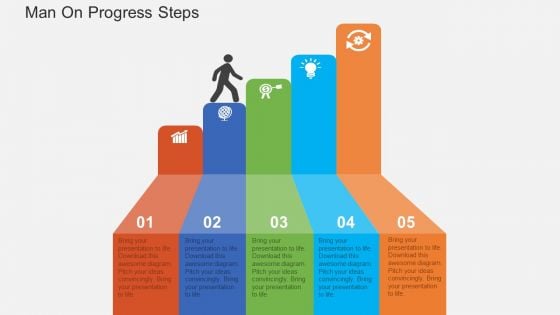
Man On Progress Steps Powerpoint Templates
Create visually amazing presentations with this business diagram. Use this business slide to depict concepts of progress, success, and winner. You may use this slide to share a plan to achieve the desired goals.
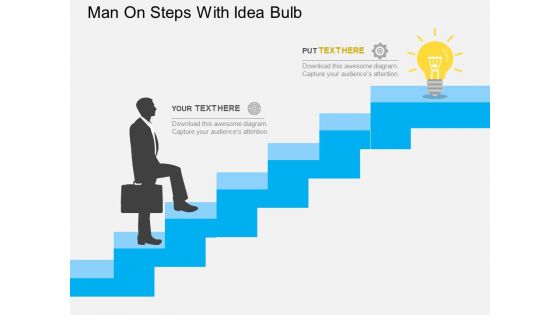
Man On Steps With Idea Bulb Powerpoint Templates
Create visually amazing presentations with this business diagram. Use this business slide to depict concepts of progress, success, and winner. You may use this slide to share a plan to achieve the desired goals.
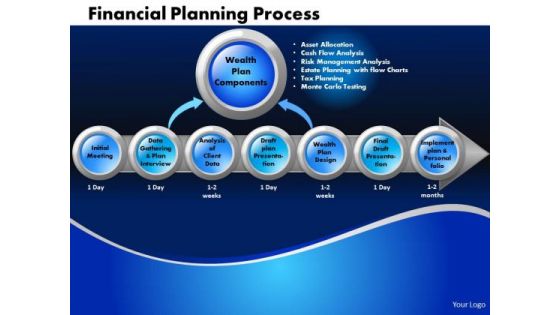
Business Circle Charts PowerPoint Templates Marketing Financial Planning Process Ppt Slides
Business Circle Charts PowerPoint Templates Marketing Financial Planning Process PPT Slides-This circle chart can be used in business, education and economic presentations to help the audience visualize the content better, or to find flaws in a financial planning process.-Business Circle Charts PowerPoint Templates Marketing Financial Planning Process PPT Slides-This template can be used for presentations relating to Abstract, Action, Business, Chart, Commerce, Competitor, Components, Concept, Conceptual, Design, Diagram, Executive, Financial, Goals, Guide, Guidelines, Hierarchy, Icon, Idea, Illustration, Manage, Management, Marketing, Mind, Mission, Model, Operations, Organization, Performance, Plan, Planning, Process Our Business Circle Charts PowerPoint Templates Marketing Financial Planning Process Ppt Slides team are good at their craft. They have chiselled out designer products.
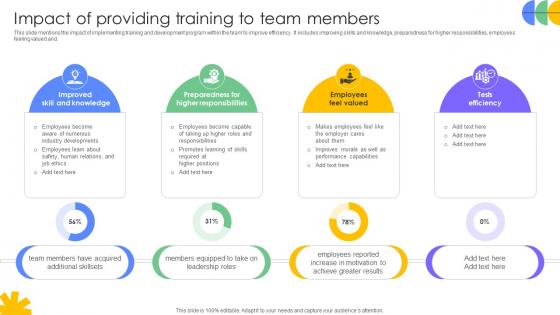
Driving Results Designing A Team Impact Of Providing Training To Team Members
This slide mentions the impact of implementing training and development program within the team to improve efficiency. It includes improving skills and knowledge, preparedness for higher responsibilities, employees feeling valued and. Are you in need of a template that can accommodate all of your creative concepts This one is crafted professionally and can be altered to fit any style. Use it with Google Slides or PowerPoint. Include striking photographs, symbols, depictions, and other visuals. Fill, move around, or remove text boxes as desired. Test out color palettes and font mixtures. Edit and save your work, or work with colleagues. Download Driving Results Designing A Team Impact Of Providing Training To Team Members and observe how to make your presentation outstanding. Give an impeccable presentation to your group and make your presentation unforgettable. This slide mentions the impact of implementing training and development program within the team to improve efficiency. It includes improving skills and knowledge, preparedness for higher responsibilities, employees feeling valued and.
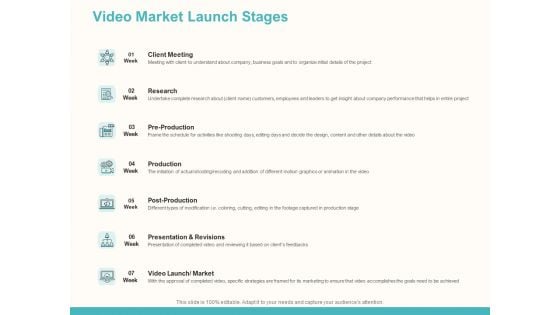
Launching Video Marketing Campaign Video Market Launch Stages Ppt Infographic Template Background Designs PDF
Deliver and pitch your topic in the best possible manner with this launching video marketing campaign video market launch stages ppt infographic template background designs pdf. Use them to share invaluable insights on client meeting, research, pre production, production, post production, presentation and revisions, video launch, market and impress your audience. This template can be altered and modified as per your expectations. So, grab it now.
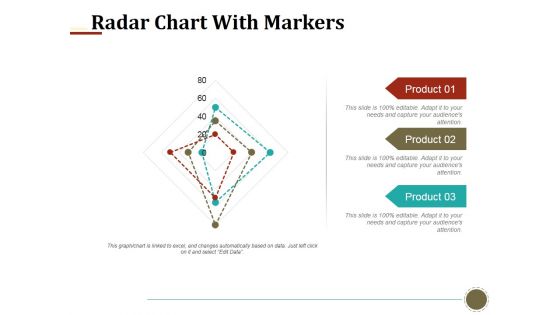
Radar Chart With Markers Ppt PowerPoint Presentation Portfolio Slides
This is a radar chart with markers ppt powerpoint presentation portfolio slides. This is a three stage process. The stages in this process are radar chart, markers, product.

Line Chart Ppt PowerPoint Presentation Gallery Example Introduction
This is a line chart ppt powerpoint presentation portfolio shapes. This is a two stage process. The stages in this process are product, financial years, line chart.
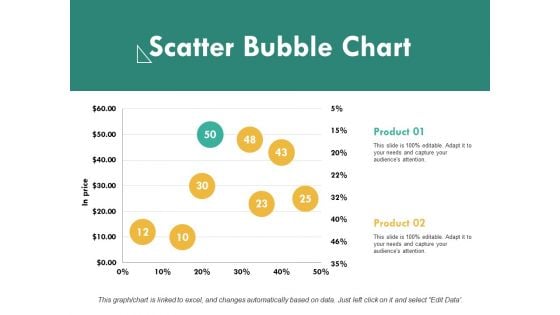
Scatter Bubble Chart Ppt PowerPoint Presentation File Samples
This is a scatter bubble chart ppt powerpoint presentation file samples. This is a two stage process. The stages in this process are product, in price, scatter chart.
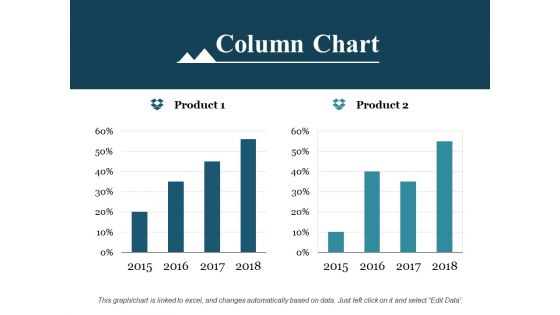
Column Chart Ppt PowerPoint Presentation Outline Background Image
This is a column chart ppt powerpoint presentation outline background image. This is a two stage process. The stages in this process are product, column chart, growth.
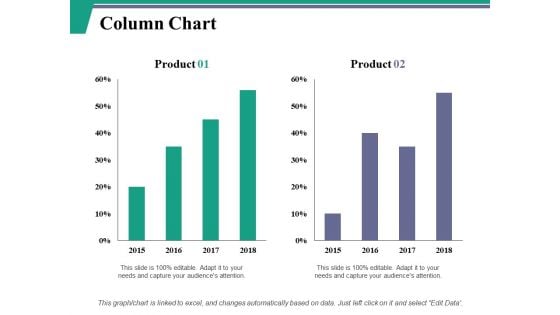
Column Chart Ppt PowerPoint Presentation Model Layout Ideas
This is a column chart ppt powerpoint presentation model layout ideas. This is a two stage process. The stages in this process are product, column chart, bar graph.

Line Chart Ppt PowerPoint Presentation Portfolio File Formats
This is a line chart ppt powerpoint presentation portfolio file formats. This is a two stage process. The stages in this process are product, profit, line chart.
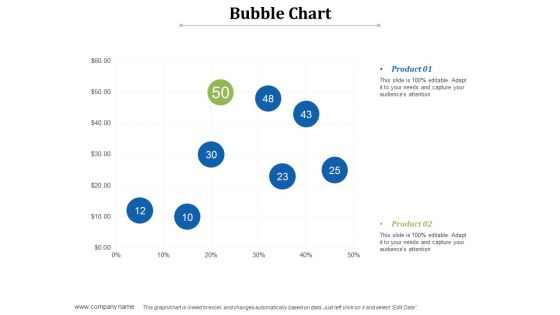
Bubble Chart Ppt PowerPoint Presentation Infographic Template Example Introduction
This is a bubble chart ppt powerpoint presentation infographic template example introduction. This is a two stage process. The stages in this process are product, bubble chart, business.
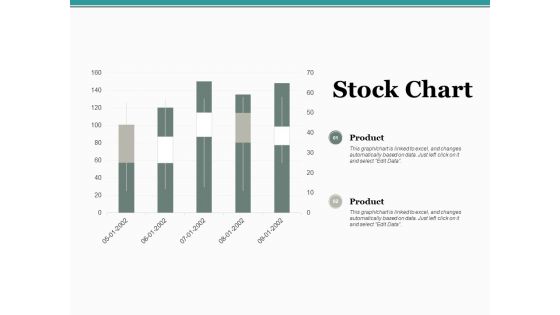
Stock Chart Ppt PowerPoint Presentation Professional Slide Download
This is a stock chart ppt powerpoint presentation professional slide download. This is a two stage process. The stages in this process are product, percentage, management, marketing, chart.
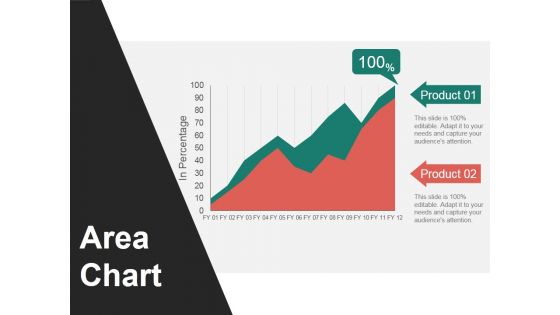
Area Chart Ppt PowerPoint Presentation Slides Graphics Design
This is a area chart ppt powerpoint presentation slides graphics design. This is a two stage process. The stages in this process are area chart, in percentage, product.
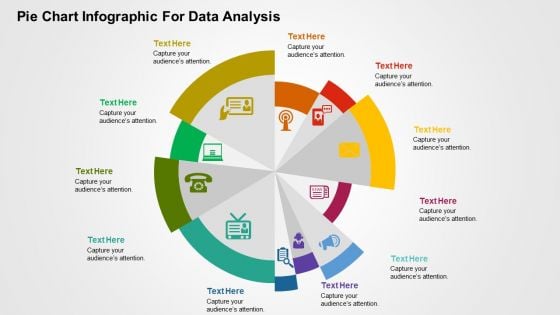
Pie Chart Infographic For Data Analysis PowerPoint Templates
This is one of the most downloaded PowerPoint template. This slide can be used for various purposes and to explain a number of processes. This can be included in your presentation to explain each step of a process and even include its relevance and importance in a single diagram. Using the uneven circular structure of the pie chart, the presenter can also explain random steps or highlight particular steps of process or parts of an organization or business that need special attention of any kind to the audience. Additionally, you can use this slide to show a transformation process or highlight key features of a product.

Combo Chart Template 1 Ppt PowerPoint Presentation Inspiration
This is a combo chart template 1 ppt powerpoint presentation inspiration. This is a four stage process. The stages in this process are business, marketing, growth, product, finance.
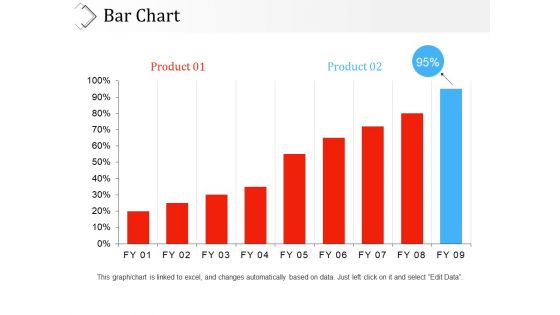
Bar Chart Ppt PowerPoint Presentation Show Example File
This is a bar chart ppt powerpoint presentation show example file. This is a two stage process. The stages in this process are product, business, marketing, graph, percentage.
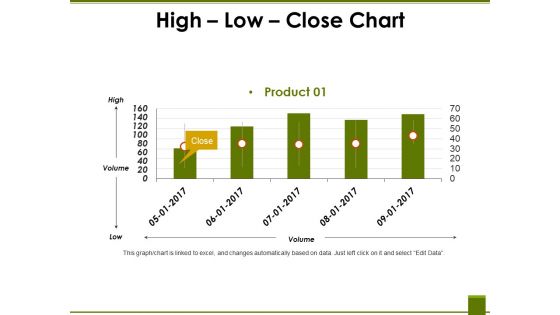
High Low Close Chart Ppt PowerPoint Presentation Portfolio Gridlines
This is a high low close chart ppt powerpoint presentation portfolio gridlines. This is a one stage process. The stages in this process are high, product, volume, low.
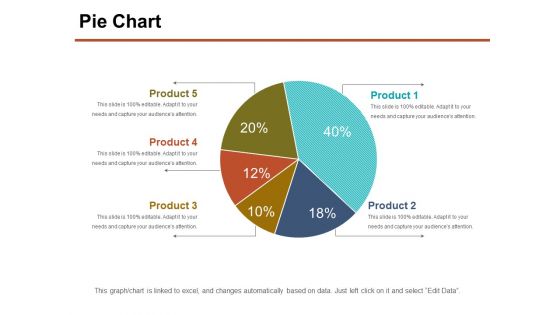
Pie Chart Ppt PowerPoint Presentation Outline Infographic Template
This is a pie chart ppt powerpoint presentation outline infographic template. This is a five stage process. The stages in this process are product, percentage, business, process.
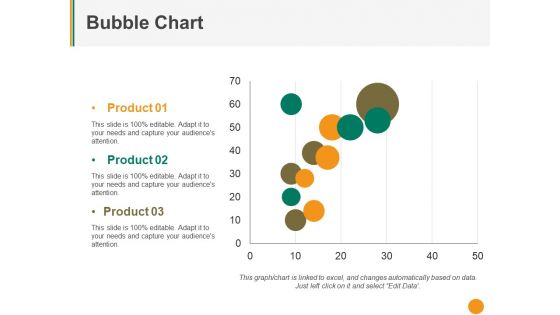
Bubble Chart Ppt PowerPoint Presentation Pictures Slide Download
This is a bubble chart ppt powerpoint presentation pictures slide download. This is a three stage process. The stages in this process are product, business, graph, finance.
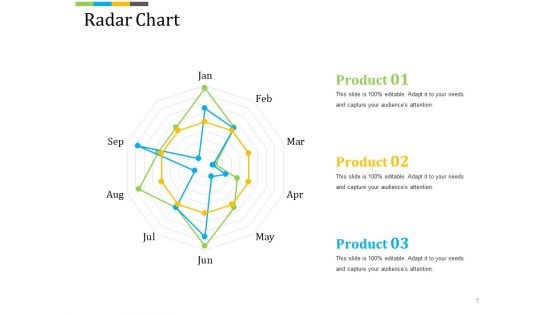
Radar Chart Ppt PowerPoint Presentation Summary Master Slide
This is a radar chart ppt powerpoint presentation summary master slide. This is a three stage process. The stages in this process are product, business, marketing, finance.
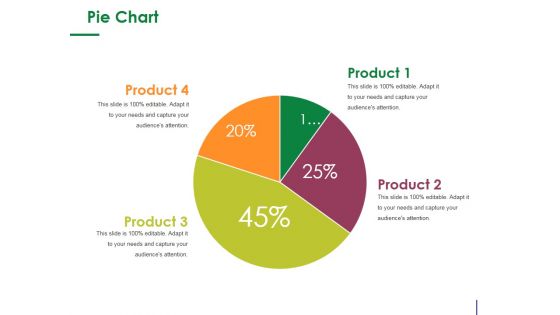
Pie Chart Ppt PowerPoint Presentation Professional Graphic Images
This is a pie chart ppt powerpoint presentation professional graphic images. This is a four stage process. The stages in this process are product, percentage, pie, finance, business.
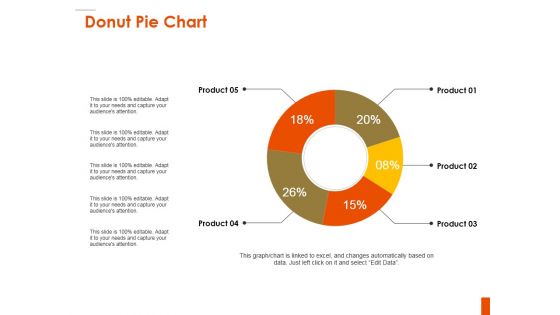
Donut Pie Chart Ppt PowerPoint Presentation Professional Influencers
This is a donut pie chart ppt powerpoint presentation professional influencers. This is a five stage process. The stages in this process are product, percentage, finance, donut, business.
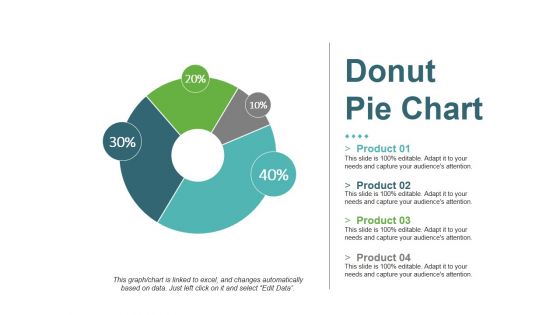
Donut Pie Chart Ppt PowerPoint Presentation Portfolio Sample
This is a donut pie chart ppt powerpoint presentation portfolio sample. This is a four stage process. The stages in this process are product, donut, percentage, finance, process.
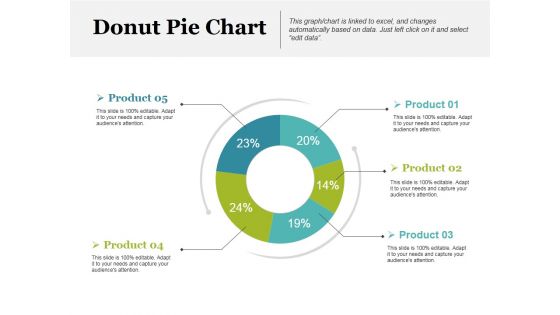
Donut Pie Chart Ppt PowerPoint Presentation Layouts Visuals
This is a donut pie chart ppt powerpoint presentation layouts visuals. This is a five stage process. The stages in this process are product, donut, percentage, finance, business.
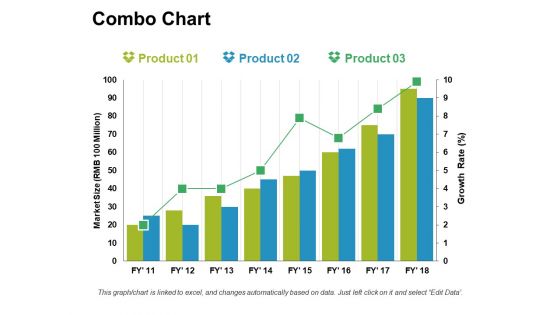
Combo Chart Ppt PowerPoint Presentation Summary Graphics Example
This is a combo chart ppt powerpoint presentation summary graphics example. This is a three stage process. The stages in this process are product, growth, marketing.
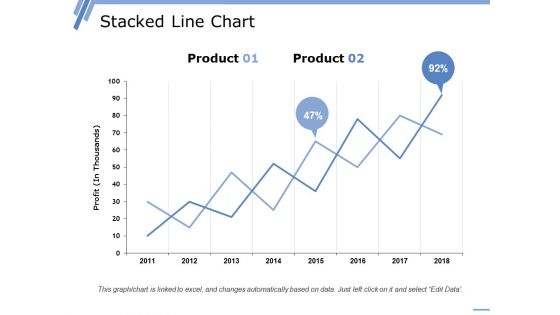
Stacked Line Chart Ppt PowerPoint Presentation Styles Graphics
This is a stacked line chart ppt powerpoint presentation styles graphics. This is a two stage process. The stages in this process are product, year, profit, percentage, growth.
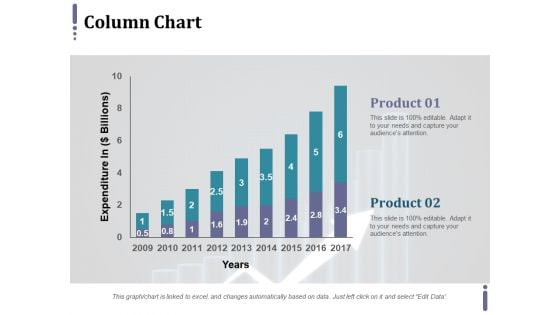
Column Chart Ppt PowerPoint Presentation Model Graphics Example
This is a column chart ppt powerpoint presentation model graphics example. This is a two stage process. The stages in this process are expenditure in, product, years.
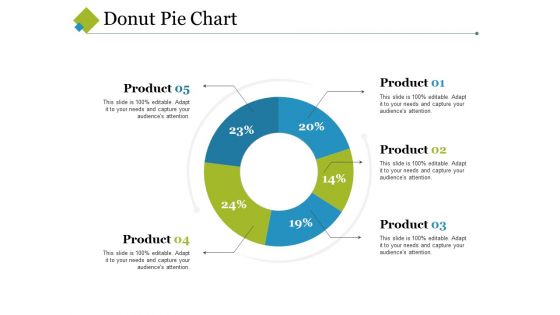
Donut Pie Chart Ppt PowerPoint Presentation Show Introduction
This is a donut pie chart ppt powerpoint presentation show introduction. This is a five stage process. The stages in this process are percentage, finance, donut, business, product.


 Continue with Email

 Home
Home


