Professional Development Plan
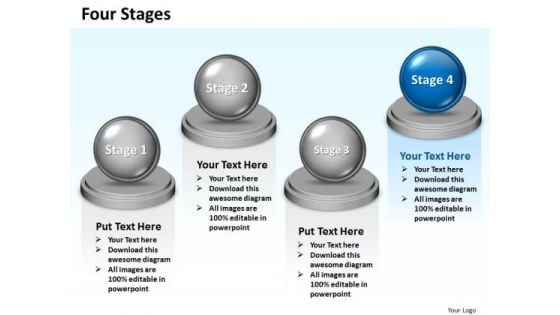
Ppt Comparison Swim Lane Diagram PowerPoint Template Of 4 State Templates
PPT comparison swim lane diagram powerpoint template of 4 state Templates-This image has been professionally designed to emphasize the concept of business strategy. Use this Swim Lane Diagram to map and improve the processes between departments and teams in your organization. This template is carefully considered and implemented with objectives of beauty, consistency, clarity, and most important, audience impact. Our template will make your presentation look impressive and stunning.-PPT comparison swim lane diagram powerpoint template of 4 state Templates-3d, Balance, Ball, Best, Board, Business, Clipart, Color, Compare, Comparison, Concept, Graphic, Heavy, Illustration, Isolated, Level, Nobody, Opposite, Orange, Parity, Render, Rendered, Reverse, Scale, Simple, Sphere Our Ppt Comparison Swim Lane Diagram PowerPoint Template Of 4 State Templates are cent per cent adaptable. They conform to all conditions.
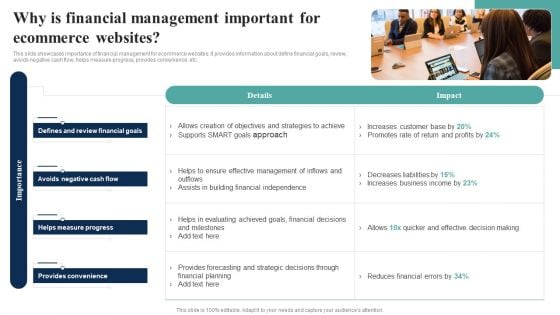
How Electronic Commerce Financial Procedure Can Be Enhanced Why Is Financial Management Introduction PDF
This slide showcases importance of financial management for ecommerce websites. It provides information about define financial goals, review, avoids negative cash flow, helps measure progress, provides convenience, etc.Retrieve professionally designed How Electronic Commerce Financial Procedure Can Be Enhanced Why Is Financial Management Introduction PDF to effectively convey your message and captivate your listeners. Save time by selecting pre-made slideshows that are appropriate for various topics, from business to educational purposes. These themes come in many different styles, from creative to corporate, and all of them are easily adjustable and can be edited quickly. Access them as PowerPoint templates or as Google Slides themes. You do not have to go on a hunt for the perfect presentation because Slidegeeks got you covered from everywhere.
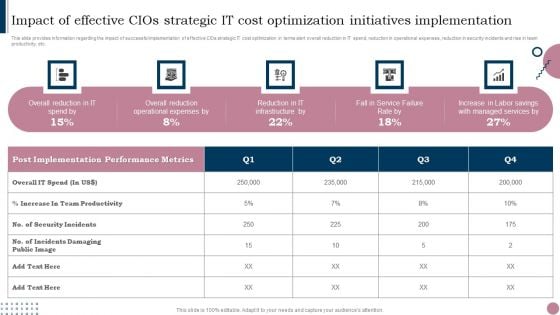
Cios Guide To Optimize Impact Of Effective Cios Strategic IT Cost Optimization Initiatives Diagrams PDF
This slide provides information regarding the impact of successful implementation of effective CIOs strategic IT cost optimization in terms alert overall reduction in IT spend, reduction in operational expenses, reduction in security incidents and rise in team productivity, etc. Explore a selection of the finest Cios Guide To Optimize Impact Of Effective Cios Strategic IT Cost Optimization Initiatives Diagrams PDF here. With a plethora of professionally designed and pre-made slide templates, you can quickly and easily find the right one for your upcoming presentation. You can use our Cios Guide To Optimize Impact Of Effective Cios Strategic IT Cost Optimization Initiatives Diagrams PDF to effectively convey your message to a wider audience. Slidegeeks has done a lot of research before preparing these presentation templates. The content can be personalized and the slides are highly editable. Grab templates today from Slidegeeks.
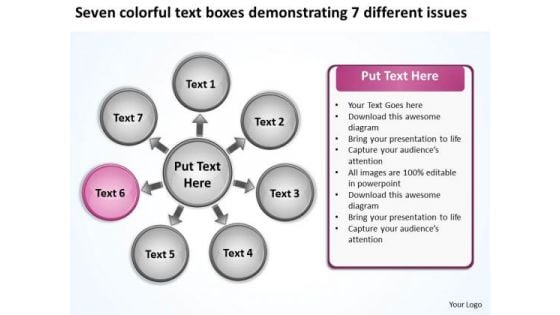
Text Boxes Demonstrating 7 Different Issues Ppt Circular Flow Diagram PowerPoint Templates
We present our text boxes demonstrating 7 different issues ppt Circular Flow Diagram PowerPoint templates.Use our Success PowerPoint Templates because your quest has taken you well onto the path of success. Present our Ring Charts PowerPoint Templates because the chart is designed to give you the flavour of the kind of tools you may need and the work that is performed in the lifecycle. Present our Business PowerPoint Templates because your thoughts are pointed and sharp as arrows. Present our Shapes PowerPoint Templates because this diagram provides range of options to garner your interest. Download and present our Process and Flows PowerPoint Templates because you have to coordinate and motivate your team.Use these PowerPoint slides for presentations relating to Account, Arrow, Blog, Business, Chart, Description, Diagram, Illustration, Marketing, Process, Profit, Resource, Strategy, Success, Template, Trend. The prominent colors used in the PowerPoint template are Pink, Gray, White. Professionals tell us our text boxes demonstrating 7 different issues ppt Circular Flow Diagram PowerPoint templates will get their audience's attention. Customers tell us our Business PowerPoint templates and PPT Slides are Reminiscent. Use our text boxes demonstrating 7 different issues ppt Circular Flow Diagram PowerPoint templates are Reminiscent. The feedback we get is that our Chart PowerPoint templates and PPT Slides are Splendid. Professionals tell us our text boxes demonstrating 7 different issues ppt Circular Flow Diagram PowerPoint templates are Efficient. Presenters tell us our Diagram PowerPoint templates and PPT Slides are Amazing. Dont miss a trick. Be in charge with our Text Boxes Demonstrating 7 Different Issues Ppt Circular Flow Diagram PowerPoint Templates. You will be at the top of your game.
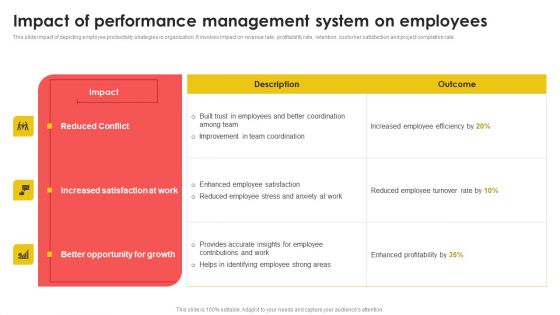
Impact Of Performance Management System On Employees Formats PDF
This slide impact of depicting employee productivity strategies in organization. It involves impact on revenue rate, profitability rate, retention, customer satisfaction and project completion rate. Explore a selection of the finest Impact Of Performance Management System On Employees Formats PDF here. With a plethora of professionally designed and pre made slide templates, you can quickly and easily find the right one for your upcoming presentation. You can use our Impact Of Performance Management System On Employees Formats PDF to effectively convey your message to a wider audience. Slidegeeks has done a lot of research before preparing these presentation templates. The content can be personalized and the slides are highly editable. Grab templates today from Slidegeeks.

Inventory Audit Challenges Survey Results Boosting Efficiency In Inventory Auditing
This slide showcases inventory audit challenges survey results such as data accuracy, timely extension, counting errors, inadequate training etc. Retrieve professionally designed Inventory Audit Challenges Survey Results Boosting Efficiency In Inventory Auditing to effectively convey your message and captivate your listeners. Save time by selecting pre-made slideshows that are appropriate for various topics, from business to educational purposes. These themes come in many different styles, from creative to corporate, and all of them are easily adjustable and can be edited quickly. Access them as PowerPoint templates or as Google Slides themes. You do not have to go on a hunt for the perfect presentation because Slidegeeks got you covered from everywhere. This slide showcases inventory audit challenges survey results such as data accuracy, timely extension, counting errors, inadequate training etc.
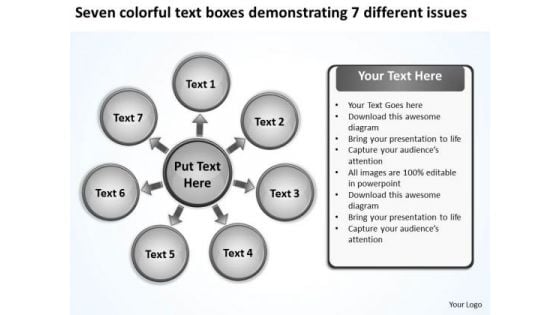
Text Boxes Demonstrating 7 Different Issues Circular Diagram PowerPoint Templates
We present our text boxes demonstrating 7 different issues Circular Diagram PowerPoint templates.Present our Success PowerPoint Templates because your quest has taken you well onto the path of success. Use our Ring Charts PowerPoint Templates because with the help of our Slides you can Illustrate these thoughts with this slide. Download and present our Business PowerPoint Templates because you can see clearly through to the bigger bowl ahead. Time your jump to perfection and hit the nail on the head. Download our Shapes PowerPoint Templates because it Saves your time as a prized possession, an ideal aid to give an ideal presentation. Download and present our Process and Flows PowerPoint Templates because your quicksilver ideas are the arrows in your quiver.Use these PowerPoint slides for presentations relating to Account, Arrow, Blog, Business, Chart, Description, Diagram, Illustration, Marketing, Process, Profit, Resource, Strategy, Success, Template, Trend. The prominent colors used in the PowerPoint template are White, Gray, Black. Professionals tell us our text boxes demonstrating 7 different issues Circular Diagram PowerPoint templates are Excellent. Customers tell us our Diagram PowerPoint templates and PPT Slides are Splendid. Use our text boxes demonstrating 7 different issues Circular Diagram PowerPoint templates are Vintage. The feedback we get is that our Illustration PowerPoint templates and PPT Slides are Luxuriant. Professionals tell us our text boxes demonstrating 7 different issues Circular Diagram PowerPoint templates are Clever. Presenters tell us our Business PowerPoint templates and PPT Slides are aesthetically designed to attract attention. We guarantee that they will grab all the eyeballs you need. Exult in the happiness of your performance. Convey your emotions through our Text Boxes Demonstrating 7 Different Issues Circular Diagram PowerPoint Templates.
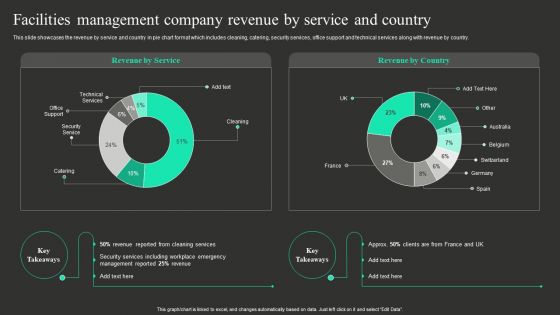
Facilities Management Company Revenue By Service And Country Information PDF
This slide showcases the revenue by service and country in pie chart format which includes cleaning, catering, security services, office support and technical services along with revenue by country. If you are looking for a format to display your unique thoughts, then the professionally designed Facilities Management Company Revenue By Service And Country Information PDF is the one for you. You can use it as a Google Slides template or a PowerPoint template. Incorporate impressive visuals, symbols, images, and other charts. Modify or reorganize the text boxes as you desire. Experiment with shade schemes and font pairings. Alter, share or cooperate with other people on your work. Download Facilities Management Company Revenue By Service And Country Information PDF and find out how to give a successful presentation. Present a perfect display to your team and make your presentation unforgettable.
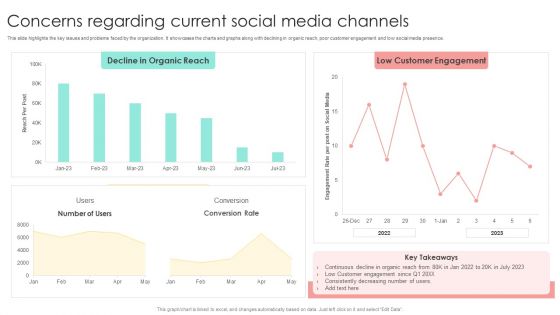
Media Advertising Concerns Regarding Current Social Media Channels Diagrams PDF
This slide highlights the key issues and problems faced by the organization. It showcases the charts and graphs along with declining in organic reach, poor customer engagement and low social media presence. If you are looking for a format to display your unique thoughts, then the professionally designed Media Advertising Concerns Regarding Current Social Media Channels Diagrams PDF is the one for you. You can use it as a Google Slides template or a PowerPoint template. Incorporate impressive visuals, symbols, images, and other charts. Modify or reorganize the text boxes as you desire. Experiment with shade schemes and font pairings. Alter, share or cooperate with other people on your work. Download Media Advertising Concerns Regarding Current Social Media Channels Diagrams PDF and find out how to give a successful presentation. Present a perfect display to your team and make your presentation unforgettable.
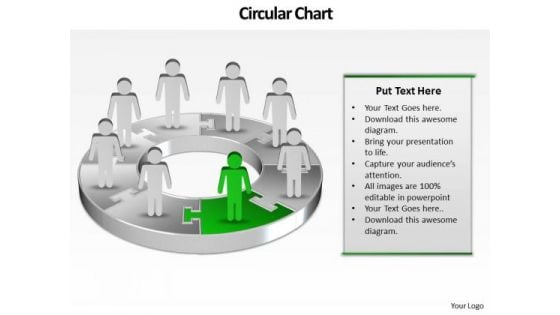
Ppt Pie Family Tree Chart PowerPoint 2003 Person Standing Green Piece Templates
PPT pie family tree chart PowerPoint 2003 person standing green piece Templates-The above Diagram displays a picture of eight circular text boxes placed in sequential manner. This image has been professionally designed to emphasize the concept of Operations performed in Circular process. Adjust the above image in your PPT presentations to visually support your content in your Business PPT slideshows.-PPT pie family tree chart PowerPoint 2003 person standing green piece Templates-arrow, bar, business, businessman, candidate, cartoon, character, chart, circle, circular, client, communication, company, concept, diagram, finance, financial, flow, growth, human, illustration, increase, information, iteration, man, market, marketing, process, processing, profit, sales, statistics, stats, success, target Embrace your dreams with our Ppt Pie Family Tree Chart PowerPoint 2003 Person Standing Green Piece Templates. They will come within your grasp.
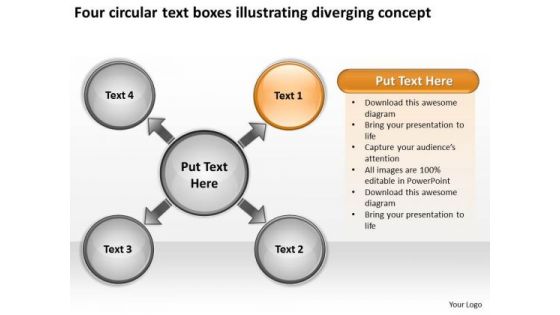
Text Boxes Illustrating Diverging Concept Circular Flow Spoke Diagram PowerPoint Slides
We present our text boxes illustrating diverging concept Circular Flow Spoke Diagram PowerPoint Slides.Download our Business PowerPoint Templates because it illustrates the city with a lasting tryst with resilience. You epitomise the qualities that give your city its fame. Download and present our Success PowerPoint Templates because your quest has taken you well onto the path of success. Use our Process and Flows PowerPoint Templates because it helps you to clearly delegate the different tasks along with their necessary resources and responsibilities. Present our Circle Charts PowerPoint Templates because you can Transmit this concern to your staff using our helpful slides. Download and present our Shapes PowerPoint Templates because they are the tools that helped most of us evolve.Use these PowerPoint slides for presentations relating to Access, Arrows, Bright, Business, Chart, Circle, Concept, Conceptual, Connection, Creative, Cycle, Different, Element, Empty, Graphic, Group, Illustration, Match, Process, Strategy, Template. The prominent colors used in the PowerPoint template are Orange, White, Black. Professionals tell us our text boxes illustrating diverging concept Circular Flow Spoke Diagram PowerPoint Slides are Classic. Customers tell us our Conceptual PowerPoint templates and PPT Slides are Romantic. Use our text boxes illustrating diverging concept Circular Flow Spoke Diagram PowerPoint Slides will impress their bosses and teams. The feedback we get is that our Circle PowerPoint templates and PPT Slides are No-nonsense. Professionals tell us our text boxes illustrating diverging concept Circular Flow Spoke Diagram PowerPoint Slides are Fun. Presenters tell us our Circle PowerPoint templates and PPT Slides are visually appealing. Don't leave your career to chance. Let our Text Boxes Illustrating Diverging Concept Circular Flow Spoke Diagram PowerPoint Slides help you take charge.
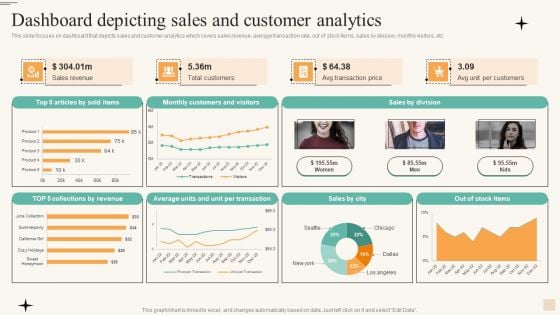
Dashboard Depicting Sales And Customer Analytics Infographics PDF
This slide focuses on dashboard that depicts sales and customer analytics which covers sales revenue, average transaction rate, out of stock items, sales by division, monthly visitors, etc. If you are looking for a format to display your unique thoughts, then the professionally designed Dashboard Depicting Sales And Customer Analytics Infographics PDF is the one for you. You can use it as a Google Slides template or a PowerPoint template. Incorporate impressive visuals, symbols, images, and other charts. Modify or reorganize the text boxes as you desire. Experiment with shade schemes and font pairings. Alter, share or cooperate with other people on your work. Download Dashboard Depicting Sales And Customer Analytics Infographics PDF and find out how to give a successful presentation. Present a perfect display to your team and make your presentation unforgettable.
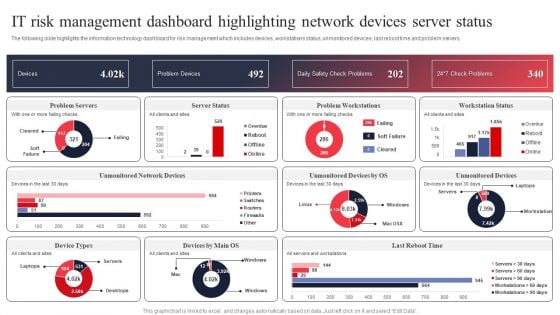
IT System Risk Management Guide IT Risk Management Dashboard Highlighting Network Devices Server Status Elements PDF
The following slide highlights the information technology dashboard for risk management which includes devices, workstations status, unmonitored devices, last reboot time and problem servers. If you are looking for a format to display your unique thoughts, then the professionally designed IT System Risk Management Guide IT Risk Management Dashboard Highlighting Network Devices Server Status Elements PDF is the one for you. You can use it as a Google Slides template or a PowerPoint template. Incorporate impressive visuals, symbols, images, and other charts. Modify or reorganize the text boxes as you desire. Experiment with shade schemes and font pairings. Alter, share or cooperate with other people on your work. Download IT System Risk Management Guide IT Risk Management Dashboard Highlighting Network Devices Server Status Elements PDF and find out how to give a successful presentation. Present a perfect display to your team and make your presentation unforgettable.
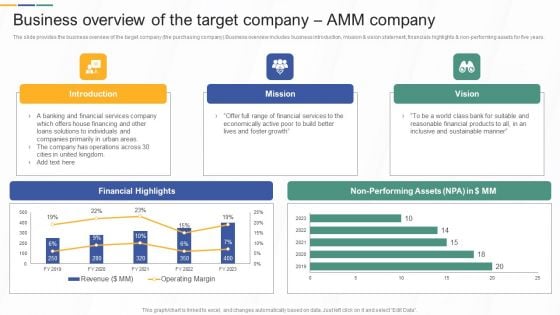
Business Overview Of The Target Company AMM Company Investment Banking And Deal Pitchbook Topics PDF
The slide provides the business overview of the target company the purchasing company.Business overview includes business introduction, mission and vision statement, financials highlights and non-performing assets for five years.If you are looking for a format to display your unique thoughts, then the professionally designed Business Overview Of The Target Company AMM Company Investment Banking And Deal Pitchbook Topics PDF is the one for you. You can use it as a Google Slides template or a PowerPoint template. Incorporate impressive visuals, symbols, images, and other charts. Modify or reorganize the text boxes as you desire. Experiment with shade schemes and font pairings. Alter, share or cooperate with other people on your work. Download Business Overview Of The Target Company AMM Company Investment Banking And Deal Pitchbook Topics PDF and find out how to give a successful presentation. Present a perfect display to your team and make your presentation unforgettable.
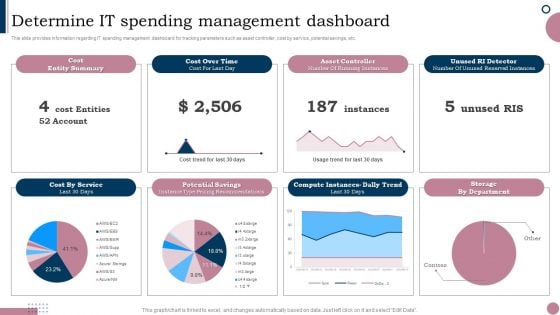
Cios Guide To Optimize Determine IT Spending Management Dashboard Portrait PDF
This slide provides information regarding IT spending management dashboard for tracking parameters such as asset controller, cost by service, potential savings, etc. If you are looking for a format to display your unique thoughts, then the professionally designed Cios Guide To Optimize Determine IT Spending Management Dashboard Portrait PDF is the one for you. You can use it as a Google Slides template or a PowerPoint template. Incorporate impressive visuals, symbols, images, and other charts. Modify or reorganize the text boxes as you desire. Experiment with shade schemes and font pairings. Alter, share or cooperate with other people on your work. Download Cios Guide To Optimize Determine IT Spending Management Dashboard Portrait PDF and find out how to give a successful presentation. Present a perfect display to your team and make your presentation unforgettable.
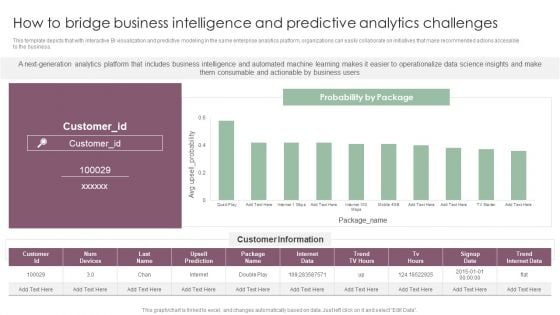
How To Bridge Business Intelligence And Predictive Analytics Challenges Mockup PDF
This template depicts that with interactive BI visualization and predictive modeling in the same enterprise analytics platform, organizations can easily collaborate on initiatives that make recommended actions accessible to the business. If you are looking for a format to display your unique thoughts, then the professionally designed How To Bridge Business Intelligence And Predictive Analytics Challenges Mockup PDF is the one for you. You can use it as a Google Slides template or a PowerPoint template. Incorporate impressive visuals, symbols, images, and other charts. Modify or reorganize the text boxes as you desire. Experiment with shade schemes and font pairings. Alter, share or cooperate with other people on your work. Download How To Bridge Business Intelligence And Predictive Analytics Challenges Mockup PDF and find out how to give a successful presentation. Present a perfect display to your team and make your presentation unforgettable.
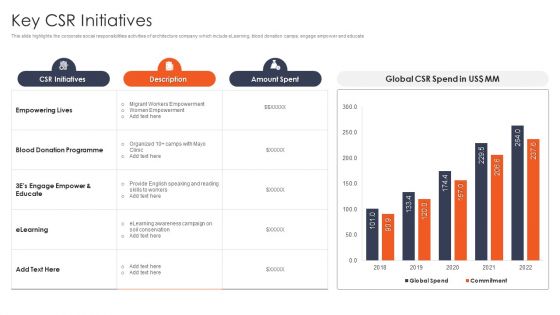
International Design And Architecture Firm Key CSR Initiatives Ppt Background Images PDF
This slide highlights the corporate social responsibilities activities of architecture company which include eLearning, blood donation camps, engage empower and educate If you are looking for a format to display your unique thoughts, then the professionally designed International Design And Architecture Firm Key CSR Initiatives Ppt Background Images PDF is the one for you. You can use it as a Google Slides template or a PowerPoint template. Incorporate impressive visuals, symbols, images, and other charts. Modify or reorganize the text boxes as you desire. Experiment with shade schemes and font pairings. Alter, share or cooperate with other people on your work. Download International Design And Architecture Firm Key CSR Initiatives Ppt Background Images PDF and find out how to give a successful presentation. Present a perfect display to your team and make your presentation unforgettable.
CRM Pipeline Administration Tracking Customer Sales Funnel Dashboard Brochure PDF
This slide covers information regarding the customer sales funnel tracking with sales volume and total market. If you are looking for a format to display your unique thoughts, then the professionally designed CRM Pipeline Administration Tracking Customer Sales Funnel Dashboard Brochure PDF is the one for you. You can use it as a Google Slides template or a PowerPoint template. Incorporate impressive visuals, symbols, images, and other charts. Modify or reorganize the text boxes as you desire. Experiment with shade schemes and font pairings. Alter, share or cooperate with other people on your work. Download CRM Pipeline Administration Tracking Customer Sales Funnel Dashboard Brochure PDF and find out how to give a successful presentation. Present a perfect display to your team and make your presentation unforgettable.
Business To Business Digital Implement Tracking And Reporting To Measure Summary PDF
This template covers dashboard to measure and analyze campaign performance. It also helps in tracking and reporting account based marketing channel and tactics. If you are looking for a format to display your unique thoughts, then the professionally designed Business To Business Digital Implement Tracking And Reporting To Measure Summary PDF is the one for you. You can use it as a Google Slides template or a PowerPoint template. Incorporate impressive visuals, symbols, images, and other charts. Modify or reorganize the text boxes as you desire. Experiment with shade schemes and font pairings. Alter, share or cooperate with other people on your work. Download Business To Business Digital Implement Tracking And Reporting To Measure Summary PDF and find out how to give a successful presentation. Present a perfect display to your team and make your presentation unforgettable.
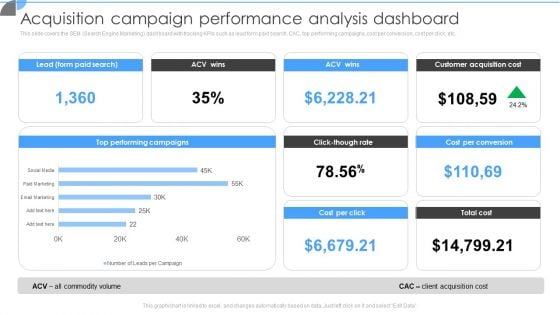
Customer Acquisition Approaches To Enhance Organization Growth Acquisition Campaign Performance Analysis Dashboard Information PDF
This slide covers the SEM Search Engine Marketing dashboard with tracking KPIs such as lead form paid search, CAC, top performing campaigns, cost per conversion, cost per click, etc. If you are looking for a format to display your unique thoughts, then the professionally designed Customer Acquisition Approaches To Enhance Organization Growth Acquisition Campaign Performance Analysis Dashboard Information PDF is the one for you. You can use it as a Google Slides template or a PowerPoint template. Incorporate impressive visuals, symbols, images, and other charts. Modify or reorganize the text boxes as you desire. Experiment with shade schemes and font pairings. Alter, share or cooperate with other people on your work. Download Customer Acquisition Approaches To Enhance Organization Growth Acquisition Campaign Performance Analysis Dashboard Information PDF and find out how to give a successful presentation. Present a perfect display to your team and make your presentation unforgettable.
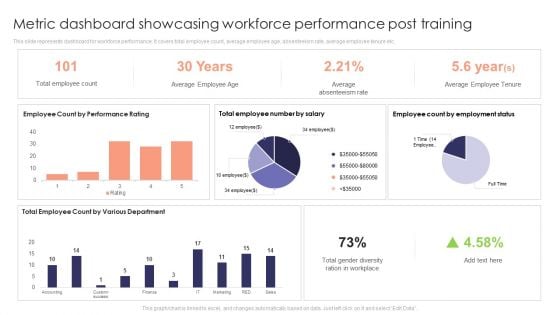
Metric Dashboard Showcasing Workforce Performance Post Training Ideas PDF
This slide represents dashboard for workforce performance. It covers total employee count, average employee age, absenteeism rate, average employee tenure etc. If you are looking for a format to display your unique thoughts, then the professionally designed Metric Dashboard Showcasing Workforce Performance Post Training Ideas PDF is the one for you. You can use it as a Google Slides template or a PowerPoint template. Incorporate impressive visuals, symbols, images, and other charts. Modify or reorganize the text boxes as you desire. Experiment with shade schemes and font pairings. Alter, share or cooperate with other people on your work. Download Metric Dashboard Showcasing Workforce Performance Post Training Ideas PDF and find out how to give a successful presentation. Present a perfect display to your team and make your presentation unforgettable.
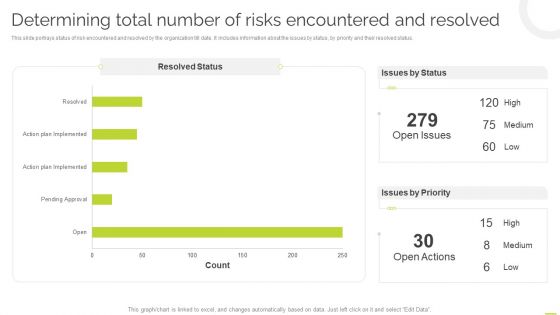
Effective BPM Tool For Business Process Management Determining Total Number Of Risks Encountered And Resolved Inspiration PDF
This slide portrays status of risk encountered and resolved by the organization till date. It includes information about the issues by status, by priority and their resolved status. If you are looking for a format to display your unique thoughts, then the professionally designed Effective BPM Tool For Business Process Management Determining Total Number Of Risks Encountered And Resolved Inspiration PDF is the one for you. You can use it as a Google Slides template or a PowerPoint template. Incorporate impressive visuals, symbols, images, and other charts. Modify or reorganize the text boxes as you desire. Experiment with shade schemes and font pairings. Alter, share or cooperate with other people on your work. Download Effective BPM Tool For Business Process Management Determining Total Number Of Risks Encountered And Resolved Inspiration PDF and find out how to give a successful presentation. Present a perfect display to your team and make your presentation unforgettable.
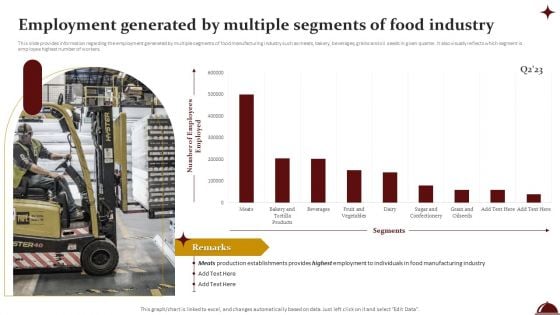
Employment Generated By Multiple Segments Of Food Industry Download PDF
This slide provides information regarding the employment generated by multiple segments of food manufacturing industry such as meats, bakery, beverages, grains and oil seeds in given quarter. It also visually reflects which segment is employee highest number of workers. If you are looking for a format to display your unique thoughts, then the professionally designed Employment Generated By Multiple Segments Of Food Industry Download PDF is the one for you. You can use it as a Google Slides template or a PowerPoint template. Incorporate impressive visuals, symbols, images, and other charts. Modify or reorganize the text boxes as you desire. Experiment with shade schemes and font pairings. Alter, share or cooperate with other people on your work. Download Employment Generated By Multiple Segments Of Food Industry Download PDF and find out how to give a successful presentation. Present a perfect display to your team and make your presentation unforgettable.
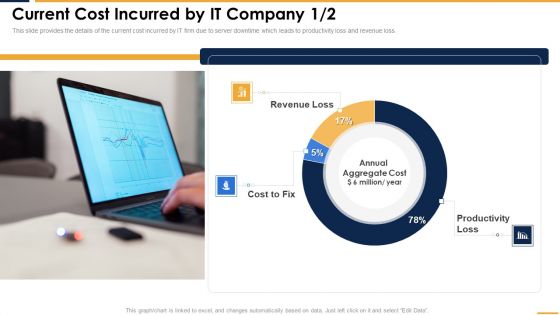
Current Cost Incurred By IT Company Microsoft PDF
This slide provides the details of the current cost incurred by IT firm due to server downtime which leads to productivity loss and revenue loss. If you are looking for a format to display your unique thoughts, then the professionally designed Current Cost Incurred By IT Company Microsoft PDF is the one for you. You can use it as a Google Slides template or a PowerPoint template. Incorporate impressive visuals, symbols, images, and other charts. Modify or reorganize the text boxes as you desire. Experiment with shade schemes and font pairings. Alter, share or cooperate with other people on your work. Download Current Cost Incurred By IT Company Microsoft PDF and find out how to give a successful presentation. Present a perfect display to your team and make your presentation unforgettable.
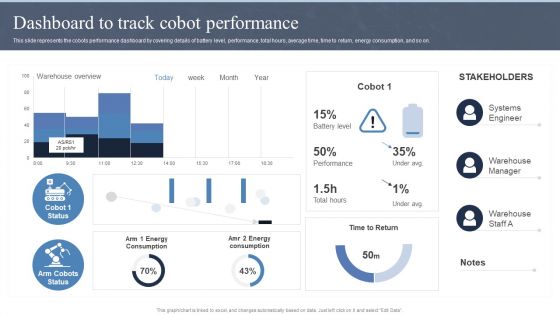
Collaborative Robots IT Dashboard To Track Cobot Performance Ppt Slides Guidelines PDF
This slide represents the cobots performance dashboard by covering details of battery level, performance, total hours, average time, time to return, energy consumption, and so on. If you are looking for a format to display your unique thoughts, then the professionally designed Collaborative Robots IT Dashboard To Track Cobot Performance Ppt Slides Guidelines PDF is the one for you. You can use it as a Google Slides template or a PowerPoint template. Incorporate impressive visuals, symbols, images, and other charts. Modify or reorganize the text boxes as you desire. Experiment with shade schemes and font pairings. Alter, share or cooperate with other people on your work. Download Collaborative Robots IT Dashboard To Track Cobot Performance Ppt Slides Guidelines PDF and find out how to give a successful presentation. Present a perfect display to your team and make your presentation unforgettable.
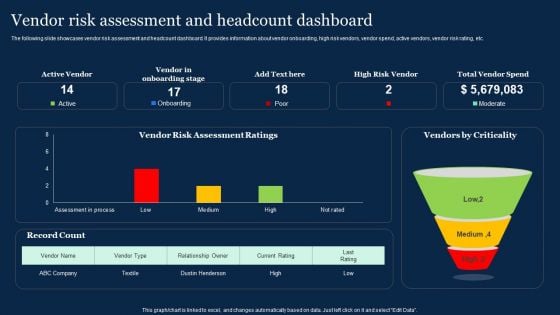
Vendor Risk Assessment And Headcount Dashboard Effective Vendor Management For Enhancing Elements PDF
The following slide showcases vendor risk assessment and headcount dashboard. It provides information about vendor onboarding, high risk vendors, vendor spend, active vendors, vendor risk rating, etc. If you are looking for a format to display your unique thoughts, then the professionally designed Vendor Risk Assessment And Headcount Dashboard Effective Vendor Management For Enhancing Elements PDF is the one for you. You can use it as a Google Slides template or a PowerPoint template. Incorporate impressive visuals, symbols, images, and other charts. Modify or reorganize the text boxes as you desire. Experiment with shade schemes and font pairings. Alter, share or cooperate with other people on your work. Download Vendor Risk Assessment And Headcount Dashboard Effective Vendor Management For Enhancing Elements PDF and find out how to give a successful presentation. Present a perfect display to your team and make your presentation unforgettable.
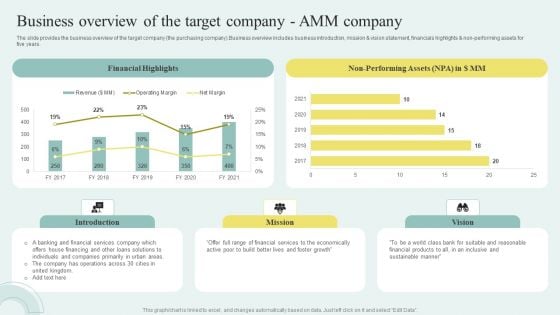
Sell Side M And A Pitchbook With Deal Overview Business Overview Of The Target Company AMM Company Graphics PDF
The slide provides the business overview of the target company the purchasing company.Business overview includes business introduction, mission and vision statement, financials highlights and non performing assets for five years. If you are looking for a format to display your unique thoughts, then the professionally designed Sell Side M And A Pitchbook With Deal Overview Business Overview Of The Target Company AMM Company Graphics PDF is the one for you. You can use it as a Google Slides template or a PowerPoint template. Incorporate impressive visuals, symbols, images, and other charts. Modify or reorganize the text boxes as you desire. Experiment with shade schemes and font pairings. Alter, share or cooperate with other people on your work. Download Sell Side M And A Pitchbook With Deal Overview Business Overview Of The Target Company AMM Company Graphics PDF and find out how to give a successful presentation. Present a perfect display to your team and make your presentation unforgettable.
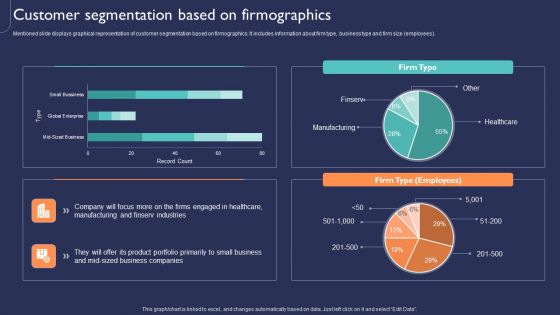
Introduction To New Product Portfolio Customer Segmentation Based On Firmographics Ppt Model Ideas PDF
Mentioned slide displays graphical representation of customer segmentation based on firmographics. It includes information about firm type, business type and firm size employees. If you are looking for a format to display your unique thoughts, then the professionally designed Introduction To New Product Portfolio Customer Segmentation Based On Firmographics Ppt Model Ideas PDF is the one for you. You can use it as a Google Slides template or a PowerPoint template. Incorporate impressive visuals, symbols, images, and other charts. Modify or reorganize the text boxes as you desire. Experiment with shade schemes and font pairings. Alter, share or cooperate with other people on your work. Download Introduction To New Product Portfolio Customer Segmentation Based On Firmographics Ppt Model Ideas PDF and find out how to give a successful presentation. Present a perfect display to your team and make your presentation unforgettable.
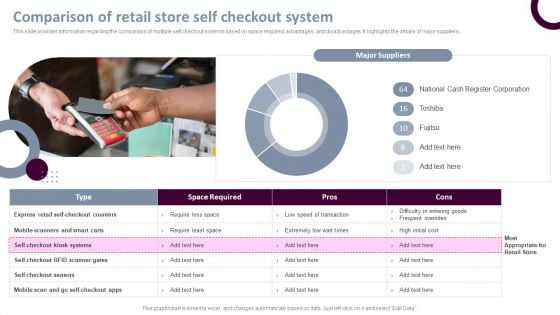
Retail Store Operations Comparison Of Retail Store Self Checkout System Template PDF
This slide provides information regarding the comparison of multiple self checkout systems based on space required, advantages, and disadvantages. It highlights the details of major suppliers. If you are looking for a format to display your unique thoughts, then the professionally designed Retail Store Operations Comparison Of Retail Store Self Checkout System Template PDF is the one for you. You can use it as a Google Slides template or a PowerPoint template. Incorporate impressive visuals, symbols, images, and other charts. Modify or reorganize the text boxes as you desire. Experiment with shade schemes and font pairings. Alter, share or cooperate with other people on your work. Download Retail Store Operations Comparison Of Retail Store Self Checkout System Template PDF and find out how to give a successful presentation. Present a perfect display to your team and make your presentation unforgettable.
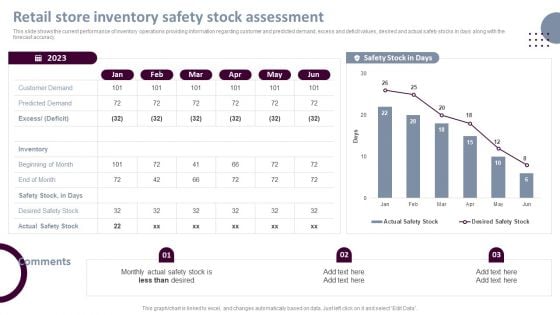
Retail Store Operations Retail Store Inventory Safety Stock Assessment Background PDF
This slide shows the current performance of inventory operations providing information regarding customer and predicted demand, excess and deficit values, desired and actual safety stocks in days along with the forecast accuracy. If you are looking for a format to display your unique thoughts, then the professionally designed Retail Store Operations Retail Store Inventory Safety Stock Assessment Background PDF is the one for you. You can use it as a Google Slides template or a PowerPoint template. Incorporate impressive visuals, symbols, images, and other charts. Modify or reorganize the text boxes as you desire. Experiment with shade schemes and font pairings. Alter, share or cooperate with other people on your work. Download Retail Store Operations Retail Store Inventory Safety Stock Assessment Background PDF and find out how to give a successful presentation. Present a perfect display to your team and make your presentation unforgettable.
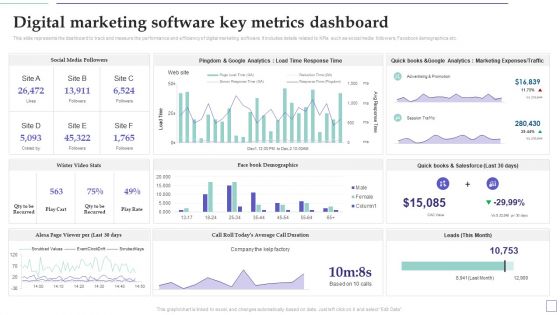
System Deployment Project Digital Marketing Software Key Metrics Dashboard Graphics PDF
This slide represents the dashboard to track and measure the performance and efficiency of digital marketing software. It includes details related to KPIs such as social media followers, Facebook demographics etc. If you are looking for a format to display your unique thoughts, then the professionally designed System Deployment Project Digital Marketing Software Key Metrics Dashboard Graphics PDF is the one for you. You can use it as a Google Slides template or a PowerPoint template. Incorporate impressive visuals, symbols, images, and other charts. Modify or reorganize the text boxes as you desire. Experiment with shade schemes and font pairings. Alter, share or cooperate with other people on your work. Download System Deployment Project Digital Marketing Software Key Metrics Dashboard Graphics PDF and find out how to give a successful presentation. Present a perfect display to your team and make your presentation unforgettable.
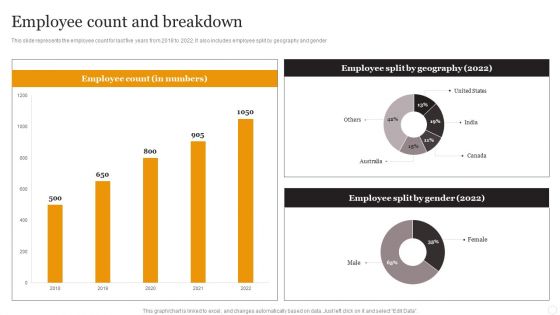
Website Designing Solutions Company Profile Employee Count And Breakdown Rules PDF
This slide represents the employee count for last five years from 2018 to 2022. It also includes employee split by geography and gender. If you are looking for a format to display your unique thoughts, then the professionally designed Website Designing Solutions Company Profile Employee Count And Breakdown Rules PDF is the one for you. You can use it as a Google Slides template or a PowerPoint template. Incorporate impressive visuals, symbols, images, and other charts. Modify or reorganize the text boxes as you desire. Experiment with shade schemes and font pairings. Alter, share or cooperate with other people on your work. Download Website Designing Solutions Company Profile Employee Count And Breakdown Rules PDF and find out how to give a successful presentation. Present a perfect display to your team and make your presentation unforgettable.
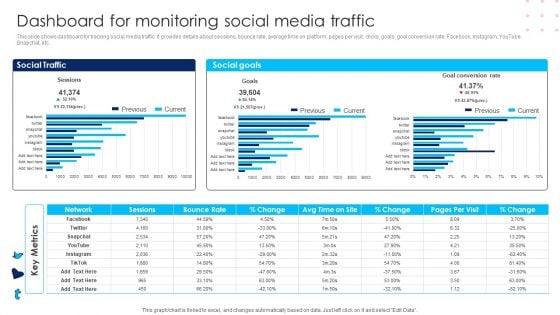
Using Social Media Platforms To Enhance Dashboard For Monitoring Social Media Traffic Structure PDF
This slide shows dashboard for tracking social media traffic. It provides details about sessions, bounce rate, average time on platform, pages per visit, clicks, goals, goal conversion rate, Facebook, Instagram, YouTube, Snapchat, etc. If you are looking for a format to display your unique thoughts, then the professionally designed Using Social Media Platforms To Enhance Dashboard For Monitoring Social Media Traffic Structure PDF is the one for you. You can use it as a Google Slides template or a PowerPoint template. Incorporate impressive visuals, symbols, images, and other charts. Modify or reorganize the text boxes as you desire. Experiment with shade schemes and font pairings. Alter, share or cooperate with other people on your work. Download Using Social Media Platforms To Enhance Dashboard For Monitoring Social Media Traffic Structure PDF and find out how to give a successful presentation. Present a perfect display to your team and make your presentation unforgettable.
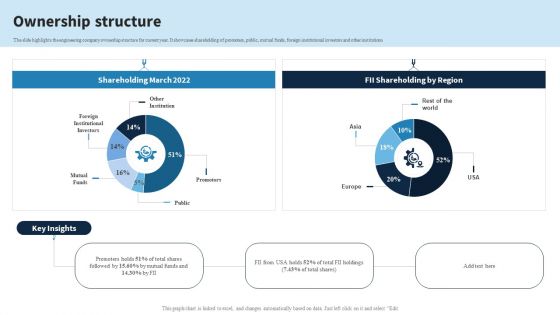
Engineering Services Company Report Ownership Structure Ppt PowerPoint Presentation File Model PDF
The slide highlights the engineering company ownership structure for current year. It showcases shareholding of promoters, public, mutual funds, foreign institutional investors and other institutions. If you are looking for a format to display your unique thoughts, then the professionally designed Engineering Services Company Report Ownership Structure Ppt PowerPoint Presentation File Model PDF is the one for you. You can use it as a Google Slides template or a PowerPoint template. Incorporate impressive visuals, symbols, images, and other charts. Modify or reorganize the text boxes as you desire. Experiment with shade schemes and font pairings. Alter, share or cooperate with other people on your work. Download Engineering Services Company Report Ownership Structure Ppt PowerPoint Presentation File Model PDF and find out how to give a successful presentation. Present a perfect display to your team and make your presentation unforgettable.
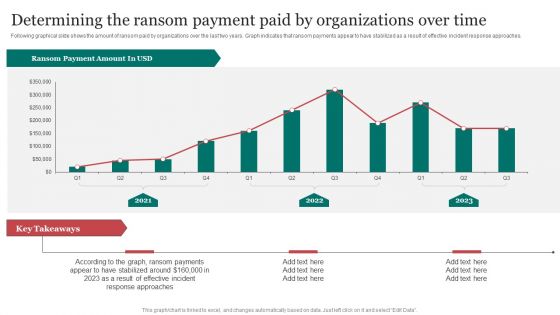
Determining The Ransom Payment Paid By Organizations Over Time Information PDF
Following graphical slide shows the amount of ransom paid by organizations over the last two years. Graph indicates that ransom payments appear to have stabilized as a result of effective incident response approaches.If you are looking for a format to display your unique thoughts, then the professionally designed Determining The Ransom Payment Paid By Organizations Over Time Information PDF is the one for you. You can use it as a Google Slides template or a PowerPoint template. Incorporate impressive visuals, symbols, images, and other charts. Modify or reorganize the text boxes as you desire. Experiment with shade schemes and font pairings. Alter, share or cooperate with other people on your work. Download Determining The Ransom Payment Paid By Organizations Over Time Information PDF and find out how to give a successful presentation. Present a perfect display to your team and make your presentation unforgettable.
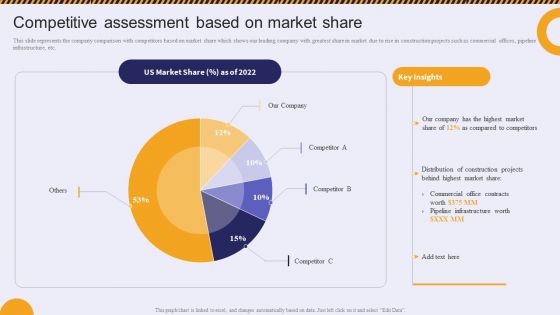
Competitive Assessment Based On Market Share Residential And Commercial Building Slides PDF
This slide represents the company comparison with competitors based on market share which shows our leading company with greatest share in market due to rise in construction projects such as commercial offices, pipeline infrastructure, etc.If you are looking for a format to display your unique thoughts, then the professionally designed Competitive Assessment Based On Market Share Residential And Commercial Building Slides PDF is the one for you. You can use it as a Google Slides template or a PowerPoint template. Incorporate impressive visuals, symbols, images, and other charts. Modify or reorganize the text boxes as you desire. Experiment with shade schemes and font pairings. Alter, share or cooperate with other people on your work. Download Competitive Assessment Based On Market Share Residential And Commercial Building Slides PDF and find out how to give a successful presentation. Present a perfect display to your team and make your presentation unforgettable.
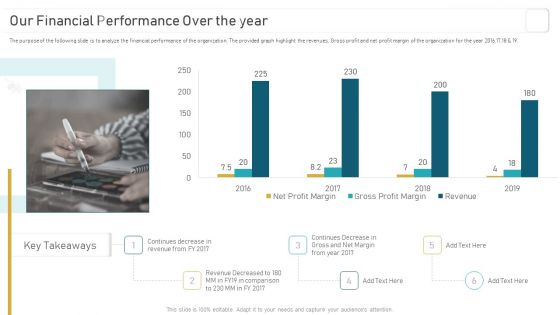
Deploying And Managing Recurring Our Financial Performance Over The Year Infographics PDF
The purpose of the following slide is to analyze the financial performance of the organization. The provided graph highlight the revenues, Gross profit and net profit margin of the organization for the year 2016,17,18 and 19. If you are looking for a format to display your unique thoughts, then the professionally designed Deploying And Managing Recurring Our Financial Performance Over The Year Infographics PDF is the one for you. You can use it as a Google Slides template or a PowerPoint template. Incorporate impressive visuals, symbols, images, and other charts. Modify or reorganize the text boxes as you desire. Experiment with shade schemes and font pairings. Alter, share or cooperate with other people on your work. Download Deploying And Managing Recurring Our Financial Performance Over The Year Infographics PDF and find out how to give a successful presentation. Present a perfect display to your team and make your presentation unforgettable.
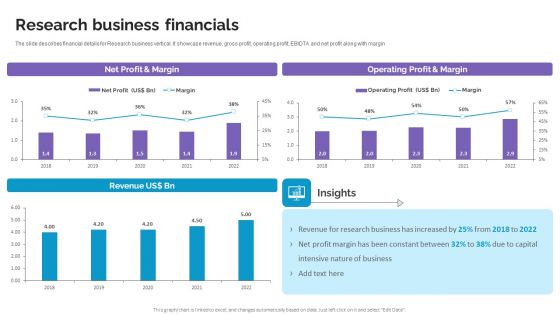
Research Business Financials Life Science And Healthcare Solutions Company Profile Information PDF
The slide describes financial details for Research business vertical. It showcase revenue, gross profit, operating profit, EBIDTA and net profit along with margin. If you are looking for a format to display your unique thoughts, then the professionally designed Research Business Financials Life Science And Healthcare Solutions Company Profile Information PDF is the one for you. You can use it as a Google Slides template or a PowerPoint template. Incorporate impressive visuals, symbols, images, and other charts. Modify or reorganize the text boxes as you desire. Experiment with shade schemes and font pairings. Alter, share or cooperate with other people on your work. Download Research Business Financials Life Science And Healthcare Solutions Company Profile Information PDF and find out how to give a successful presentation. Present a perfect display to your team and make your presentation unforgettable.
Dashboard For Cloud Storage Tracking Ppt PowerPoint Presentation File Layouts PDF
This slide represents the dashboard for cloud storage tracking by covering details of users, available workspaces, shared files, downloads, uploads, and moves. If you are looking for a format to display your unique thoughts, then the professionally designed Dashboard For Cloud Storage Tracking Ppt PowerPoint Presentation File Layouts PDF is the one for you. You can use it as a Google Slides template or a PowerPoint template. Incorporate impressive visuals, symbols, images, and other charts. Modify or reorganize the text boxes as you desire. Experiment with shade schemes and font pairings. Alter, share or cooperate with other people on your work. Download Dashboard For Cloud Storage Tracking Ppt PowerPoint Presentation File Layouts PDF and find out how to give a successful presentation. Present a perfect display to your team and make your presentation unforgettable.
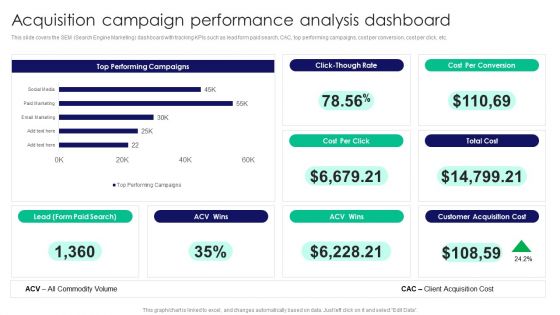
Guide To Business Customer Acquisition Acquisition Campaign Performance Analysis Dashboard Rules PDF
This slide covers the SEM Search Engine Marketing dashboard with tracking KPIs such as lead form paid search, CAC, top performing campaigns, cost per conversion, cost per click, etc. If you are looking for a format to display your unique thoughts, then the professionally designed Guide To Business Customer Acquisition Acquisition Campaign Performance Analysis Dashboard Rules PDF is the one for you. You can use it as a Google Slides template or a PowerPoint template. Incorporate impressive visuals, symbols, images, and other charts. Modify or reorganize the text boxes as you desire. Experiment with shade schemes and font pairings. Alter, share or cooperate with other people on your work. Download Guide To Business Customer Acquisition Acquisition Campaign Performance Analysis Dashboard Rules PDF and find out how to give a successful presentation. Present a perfect display to your team and make your presentation unforgettable.
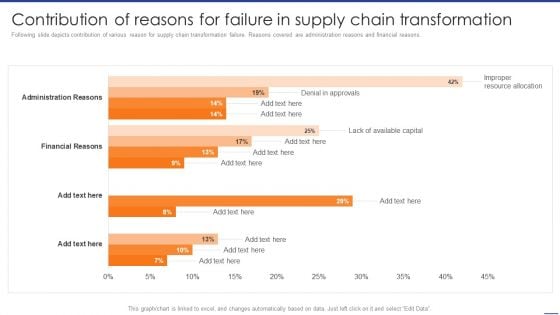
Digital Transformation Of Supply Contribution Of Reasons For Failure In Supply Chain Guidelines PDF
Following slide depicts contribution of various reason for supply chain transformation failure. Reasons covered are administration reasons and financial reasons. If you are looking for a format to display your unique thoughts, then the professionally designed Digital Transformation Of Supply Contribution Of Reasons For Failure In Supply Chain Guidelines PDF is the one for you. You can use it as a Google Slides template or a PowerPoint template. Incorporate impressive visuals, symbols, images, and other charts. Modify or reorganize the text boxes as you desire. Experiment with shade schemes and font pairings. Alter, share or cooperate with other people on your work. Download Digital Transformation Of Supply Contribution Of Reasons For Failure In Supply Chain Guidelines PDF and find out how to give a successful presentation. Present a perfect display to your team and make your presentation unforgettable.

Engineering Enterprise Competitive Competitor Comparison Topics PDF
The slide highlights the competitor comparison for top competitors. It compares companies on the basis of global market share, revenue, employee count, location served and services offered. If you are looking for a format to display your unique thoughts, then the professionally designed Engineering Enterprise Competitive Competitor Comparison Topics PDF is the one for you. You can use it as a Google Slides template or a PowerPoint template. Incorporate impressive visuals, symbols, images, and other charts. Modify or reorganize the text boxes as you desire. Experiment with shade schemes and font pairings. Alter, share or cooperate with other people on your work. Download Engineering Enterprise Competitive Competitor Comparison Topics PDF and find out how to give a successful presentation. Present a perfect display to your team and make your presentation unforgettable.
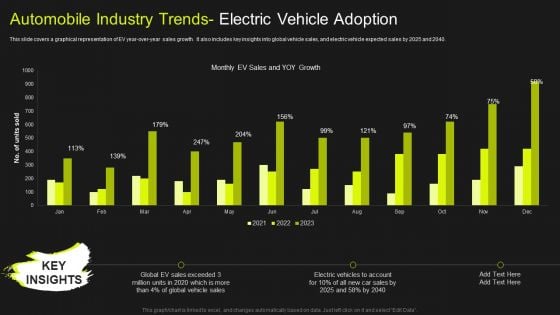
Global Automobile Market Analysis Automobile Industry Trends Electric Vehicle Adoption Mockup PDF
This slide covers a graphical representation of EV year-over-year sales growth. It also includes key insights into global vehicle sales, and electric vehicle expected sales by 2025 and 2040. If you are looking for a format to display your unique thoughts, then the professionally designed Global Automobile Market Analysis Automobile Industry Trends Electric Vehicle Adoption Mockup PDF is the one for you. You can use it as a Google Slides template or a PowerPoint template. Incorporate impressive visuals, symbols, images, and other charts. Modify or reorganize the text boxes as you desire. Experiment with shade schemes and font pairings. Alter, share or cooperate with other people on your work. Download Global Automobile Market Analysis Automobile Industry Trends Electric Vehicle Adoption Mockup PDF and find out how to give a successful presentation. Present a perfect display to your team and make your presentation unforgettable.
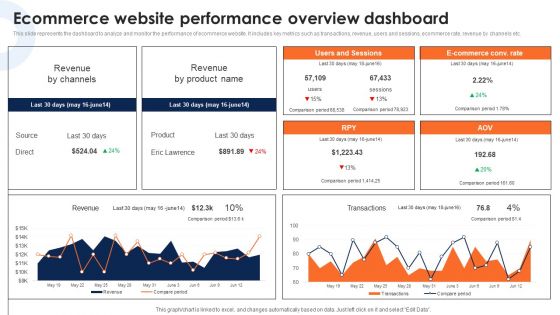
Ecommerce Website Performance Overview Dashboard Deploying Ecommerce Order Management Infographics PDF
This slide represents the dashboard to analyze and monitor the performance of ecommerce website. It includes key metrics such as transactions, revenue, users and sessions, ecommerce rate, revenue by channels etc.If you are looking for a format to display your unique thoughts, then the professionally designed Ecommerce Website Performance Overview Dashboard Deploying Ecommerce Order Management Infographics PDF is the one for you. You can use it as a Google Slides template or a PowerPoint template. Incorporate impressive visuals, symbols, images, and other charts. Modify or reorganize the text boxes as you desire. Experiment with shade schemes and font pairings. Alter, share or cooperate with other people on your work. Download Ecommerce Website Performance Overview Dashboard Deploying Ecommerce Order Management Infographics PDF and find out how to give a successful presentation. Present a perfect display to your team and make your presentation unforgettable.
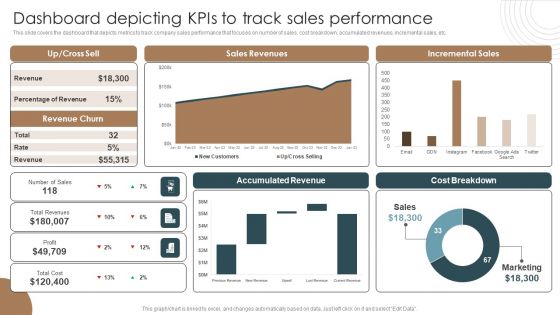
Dashboard Depicting Kpis To Track Sales Performance Integrating Technology To Transform Change Portrait PDF
This slide covers the dashboard that depicts metrics to track company sales performance that focuses on number of sales, cost breakdown, accumulated revenues, incremental sales, etc.If you are looking for a format to display your unique thoughts, then the professionally designed Dashboard Depicting Kpis To Track Sales Performance Integrating Technology To Transform Change Portrait PDF is the one for you. You can use it as a Google Slides template or a PowerPoint template. Incorporate impressive visuals, symbols, images, and other charts. Modify or reorganize the text boxes as you desire. Experiment with shade schemes and font pairings. Alter, share or cooperate with other people on your work. Download Dashboard Depicting Kpis To Track Sales Performance Integrating Technology To Transform Change Portrait PDF and find out how to give a successful presentation. Present a perfect display to your team and make your presentation unforgettable.
Corporate Financial Performance Tracking Dashboard Diagrams PDF
This slide provides information regarding dashboard utilized by firm to monitor financial performance. The performance is tracked through revenues generated, vendors associated, profit generated, etc. If you are looking for a format to display your unique thoughts, then the professionally designed Corporate Financial Performance Tracking Dashboard Diagrams PDF is the one for you. You can use it as a Google Slides template or a PowerPoint template. Incorporate impressive visuals, symbols, images, and other charts. Modify or reorganize the text boxes as you desire. Experiment with shade schemes and font pairings. Alter, share or cooperate with other people on your work. Download Corporate Financial Performance Tracking Dashboard Diagrams PDF and find out how to give a successful presentation. Present a perfect display to your team and make your presentation unforgettable.
Cloud Dashboard For Tracking Project Sprints Ppt PowerPoint Presentation File Layouts PDF
The following slide depicts cloud dashboard for monitoring project sprints. It provides information about sprint blockers, resolved issues, under performers, sprint health, releases, sprint burndown, etc. If you are looking for a format to display your unique thoughts, then the professionally designed Cloud Dashboard For Tracking Project Sprints Ppt PowerPoint Presentation File Layouts PDF is the one for you. You can use it as a Google Slides template or a PowerPoint template. Incorporate impressive visuals, symbols, images, and other charts. Modify or reorganize the text boxes as you desire. Experiment with shade schemes and font pairings. Alter, share or cooperate with other people on your work. Download Cloud Dashboard For Tracking Project Sprints Ppt PowerPoint Presentation File Layouts PDF and find out how to give a successful presentation. Present a perfect display to your team and make your presentation unforgettable.
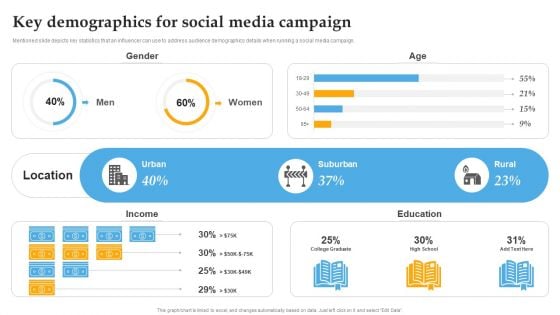
Key Demographics For Social Media Campaign Comprehensive Personal Brand Building Guide For Social Media Information PDF
Mentioned slide depicts key statistics that an influencer can use to address audience demographics details when running a social media campaign. If you are looking for a format to display your unique thoughts, then the professionally designed Key Demographics For Social Media Campaign Comprehensive Personal Brand Building Guide For Social Media Information PDF is the one for you. You can use it as a Google Slides template or a PowerPoint template. Incorporate impressive visuals, symbols, images, and other charts. Modify or reorganize the text boxes as you desire. Experiment with shade schemes and font pairings. Alter, share or cooperate with other people on your work. Download Key Demographics For Social Media Campaign Comprehensive Personal Brand Building Guide For Social Media Information PDF and find out how to give a successful presentation. Present a perfect display to your team and make your presentation unforgettable.
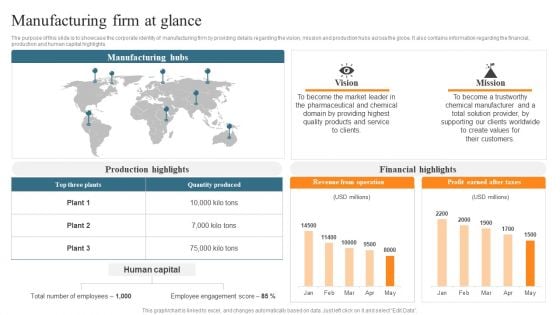
Leveraging Predictive Maintenance To Enhance Production Process Manufacturing Firm At Glance Elements PDF
The purpose of this slide is to showcase the corporate identity of manufacturing firm by providing details regarding the vision, mission and production hubs across the globe. It also contains information regarding the financial, production and human capital highlights. If you are looking for a format to display your unique thoughts, then the professionally designed Leveraging Predictive Maintenance To Enhance Production Process Manufacturing Firm At Glance Elements PDF is the one for you. You can use it as a Google Slides template or a PowerPoint template. Incorporate impressive visuals, symbols, images, and other charts. Modify or reorganize the text boxes as you desire. Experiment with shade schemes and font pairings. Alter, share or cooperate with other people on your work. Download Leveraging Predictive Maintenance To Enhance Production Process Manufacturing Firm At Glance Elements PDF and find out how to give a successful presentation. Present a perfect display to your team and make your presentation unforgettable.
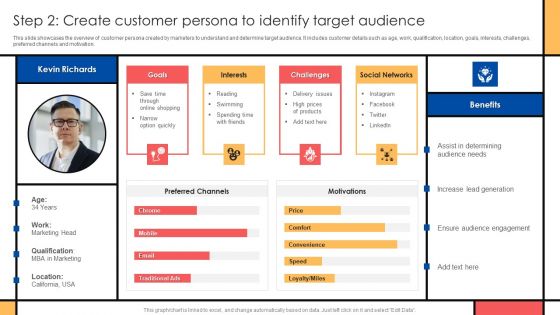
Guide To Create Advertising Campaign For Client Engagement Step 2 Create Customer Persona Background PDF
This slide showcases the overview of customer persona created by marketers to understand and determine target audience. It includes customer details such as age, work, qualification, location, goals, interests, challenges, preferred channels and motivation. If you are looking for a format to display your unique thoughts, then the professionally designed Guide To Create Advertising Campaign For Client Engagement Step 2 Create Customer Persona Background PDF is the one for you. You can use it as a Google Slides template or a PowerPoint template. Incorporate impressive visuals, symbols, images, and other charts. Modify or reorganize the text boxes as you desire. Experiment with shade schemes and font pairings. Alter, share or cooperate with other people on your work. Download Guide To Create Advertising Campaign For Client Engagement Step 2 Create Customer Persona Background PDF and find out how to give a successful presentation. Present a perfect display to your team and make your presentation unforgettable.
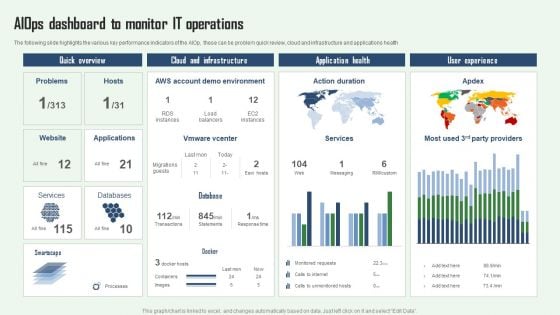
Aiops Dashboard To Monitor IT Operations Aiops Integration Summary Report Clipart PDF
The following slide highlights the various key performance indicators of the AIOp, these can be problem quick review, cloud and infrastructure and applications health. If you are looking for a format to display your unique thoughts, then the professionally designed Aiops Dashboard To Monitor IT Operations Aiops Integration Summary Report Clipart PDF is the one for you. You can use it as a Google Slides template or a PowerPoint template. Incorporate impressive visuals, symbols, images, and other charts. Modify or reorganize the text boxes as you desire. Experiment with shade schemes and font pairings. Alter, share or cooperate with other people on your work. Download Aiops Dashboard To Monitor IT Operations Aiops Integration Summary Report Clipart PDF and find out how to give a successful presentation. Present a perfect display to your team and make your presentation unforgettable.
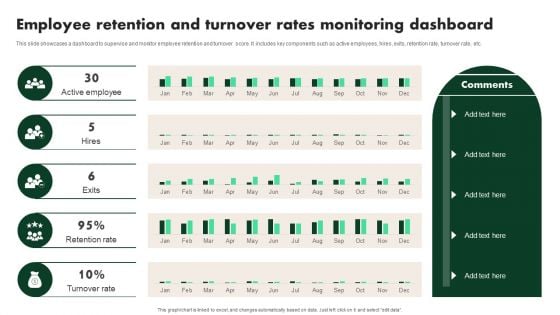
Creating Employee Value Proposition Employee Retention And Turnover Rates Monitoring Brochure PDF
This slide showcases a dashboard to supervise and monitor employee retention and turnover score. It includes key components such as active employees, hires, exits, retention rate, turnover rate, etc. If you are looking for a format to display your unique thoughts, then the professionally designed Creating Employee Value Proposition Employee Retention And Turnover Rates Monitoring Brochure PDF is the one for you. You can use it as a Google Slides template or a PowerPoint template. Incorporate impressive visuals, symbols, images, and other charts. Modify or reorganize the text boxes as you desire. Experiment with shade schemes and font pairings. Alter, share or cooperate with other people on your work. Download Creating Employee Value Proposition Employee Retention And Turnover Rates Monitoring Brochure PDF and find out how to give a successful presentation. Present a perfect display to your team and make your presentation unforgettable.
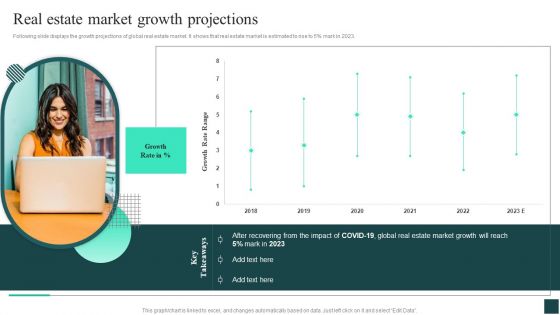
Credibility Assessment Summary For Construction Project Real Estate Market Growth Projections Ideas PDF
Following slide displays the growth projections of global real estate market. It shows that real estate market is estimated to rise to 5 percent mark in 2023. If you are looking for a format to display your unique thoughts, then the professionally designed Credibility Assessment Summary For Construction Project Real Estate Market Growth Projections Ideas PDF is the one for you. You can use it as a Google Slides template or a PowerPoint template. Incorporate impressive visuals, symbols, images, and other charts. Modify or reorganize the text boxes as you desire. Experiment with shade schemes and font pairings. Alter, share or cooperate with other people on your work. Download Credibility Assessment Summary For Construction Project Real Estate Market Growth Projections Ideas PDF and find out how to give a successful presentation. Present a perfect display to your team and make your presentation unforgettable.
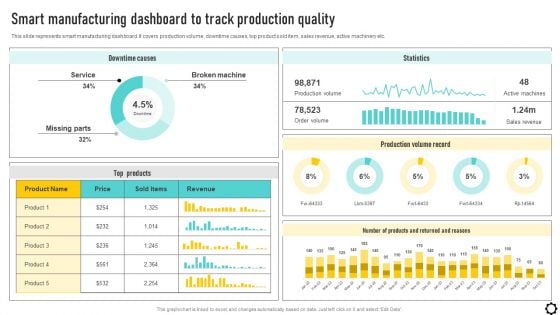
Optimizing Production Process Smart Manufacturing Dashboard To Track Production Diagrams PDF
This slide represents smart manufacturing dashboard. It covers production volume, downtime causes, top product sold item, sales revenue, active machinery etc. If you are looking for a format to display your unique thoughts, then the professionally designed Optimizing Production Process Smart Manufacturing Dashboard To Track Production Diagrams PDF is the one for you. You can use it as a Google Slides template or a PowerPoint template. Incorporate impressive visuals, symbols, images, and other charts. Modify or reorganize the text boxes as you desire. Experiment with shade schemes and font pairings. Alter, share or cooperate with other people on your work. Download Optimizing Production Process Smart Manufacturing Dashboard To Track Production Diagrams PDF and find out how to give a successful presentation. Present a perfect display to your team and make your presentation unforgettable.
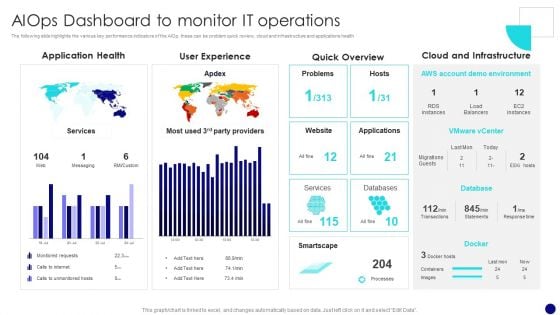
Information Technology Operations Administration With ML Aiops Dashboard To Monitor Diagrams PDF
The following slide highlights the various key performance indicators of the AIOp, these can be problem quick review, cloud and infrastructure and applications health. If you are looking for a format to display your unique thoughts, then the professionally designed Information Technology Operations Administration With ML Aiops Dashboard To Monitor Diagrams PDF is the one for you. You can use it as a Google Slides template or a PowerPoint template. Incorporate impressive visuals, symbols, images, and other charts. Modify or reorganize the text boxes as you desire. Experiment with shade schemes and font pairings. Alter, share or cooperate with other people on your work. Download Information Technology Operations Administration With ML Aiops Dashboard To Monitor Diagrams PDF and find out how to give a successful presentation. Present a perfect display to your team and make your presentation unforgettable.
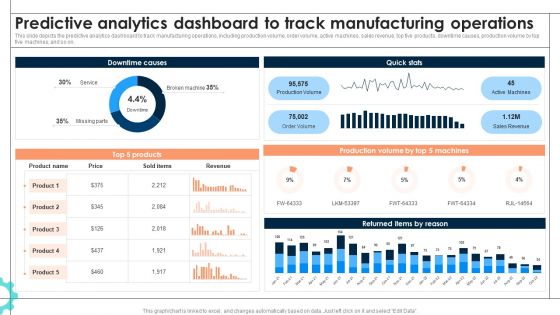
Intelligent Manufacturing Predictive Analytics Dashboard To Track Manufacturing Operations Information PDF
This slide depicts the predictive analytics dashboard to track manufacturing operations, including production volume, order volume, active machines, sales revenue, top five products, downtime causes, production volume by top five machines, and so on. If you are looking for a format to display your unique thoughts, then the professionally designed Intelligent Manufacturing Predictive Analytics Dashboard To Track Manufacturing Operations Information PDF is the one for you. You can use it as a Google Slides template or a PowerPoint template. Incorporate impressive visuals, symbols, images, and other charts. Modify or reorganize the text boxes as you desire. Experiment with shade schemes and font pairings. Alter, share or cooperate with other people on your work. Download Intelligent Manufacturing Predictive Analytics Dashboard To Track Manufacturing Operations Information PDF and find out how to give a successful presentation. Present a perfect display to your team and make your presentation unforgettable.
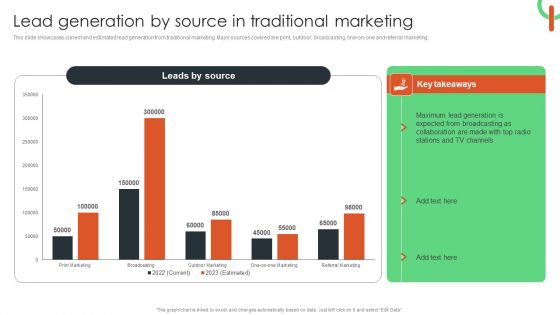
Lead Generation By Source In Traditional Marketing Summary PDF
This slide showcases current and estimated lead generation from traditional marketing. Major sources covered are print, outdoor, broadcasting, one-on-one and referral marketing. If you are looking for a format to display your unique thoughts, then the professionally designed Lead Generation By Source In Traditional Marketing Summary PDF is the one for you. You can use it as a Google Slides template or a PowerPoint template. Incorporate impressive visuals, symbols, images, and other charts. Modify or reorganize the text boxes as you desire. Experiment with shade schemes and font pairings. Alter, share or cooperate with other people on your work. Download Lead Generation By Source In Traditional Marketing Summary PDF and find out how to give a successful presentation. Present a perfect display to your team and make your presentation unforgettable.
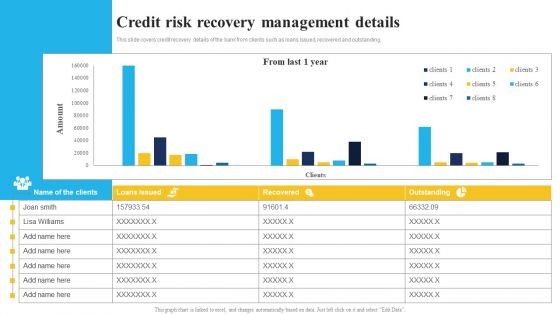
Bank And Finance Risk Management Tools And Methodologies Credit Risk Recovery Microsoft PDF
This slide covers credit recovery details of the bank from clients such as loans issued, recovered and outstanding. If you are looking for a format to display your unique thoughts, then the professionally designed Bank And Finance Risk Management Tools And Methodologies Credit Risk Recovery Microsoft PDF is the one for you. You can use it as a Google Slides template or a PowerPoint template. Incorporate impressive visuals, symbols, images, and other charts. Modify or reorganize the text boxes as you desire. Experiment with shade schemes and font pairings. Alter, share or cooperate with other people on your work. Download Bank And Finance Risk Management Tools And Methodologies Credit Risk Recovery Microsoft PDF and find out how to give a successful presentation. Present a perfect display to your team and make your presentation unforgettable.
Product Branding To Enhance Product Branding Performance Tracking Dashboard Graphics PDF
This slide provides information regarding product branding performance tracking dashboard in terms of revenues, new customers, customer satisfaction rate. If you are looking for a format to display your unique thoughts, then the professionally designed Product Branding To Enhance Product Branding Performance Tracking Dashboard Graphics PDF is the one for you. You can use it as a Google Slides template or a PowerPoint template. Incorporate impressive visuals, symbols, images, and other charts. Modify or reorganize the text boxes as you desire. Experiment with shade schemes and font pairings. Alter, share or cooperate with other people on your work. Download Product Branding To Enhance Product Branding Performance Tracking Dashboard Graphics PDF and find out how to give a successful presentation. Present a perfect display to your team and make your presentation unforgettable.
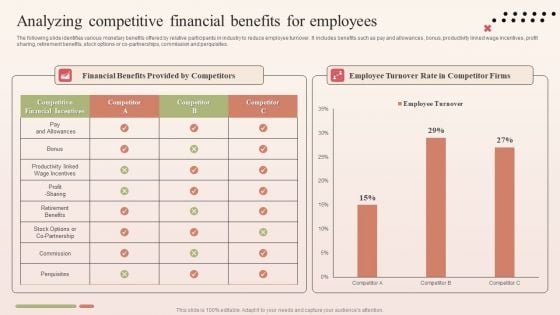
Analyzing Competitive Financial Benefits For Employees Infographics PDF
The following slide identifies various monetary benefits offered by relative participants in industry to reduce employee turnover. It includes benefits such as pay and allowances, bonus, productivity linked wage incentives, profit sharing, retirement benefits, stock options or co-partnerships, commission and perquisites. If you are looking for a format to display your unique thoughts, then the professionally designed Analyzing Competitive Financial Benefits For Employees Infographics PDF is the one for you. You can use it as a Google Slides template or a PowerPoint template. Incorporate impressive visuals, symbols, images, and other charts. Modify or reorganize the text boxes as you desire. Experiment with shade schemes and font pairings. Alter, share or cooperate with other people on your work. Download Analyzing Competitive Financial Benefits For Employees Infographics PDF and find out how to give a successful presentation. Present a perfect display to your team and make your presentation unforgettable.


 Continue with Email

 Home
Home


