Profit Icon
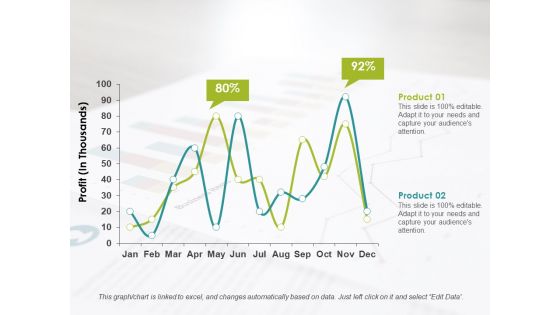
Line Chart Ppt PowerPoint Presentation Infographics Format Ideas
This is a line chart ppt powerpoint presentation infographics format ideas. This is a two stage process. The stages in this process are product, profit, business.
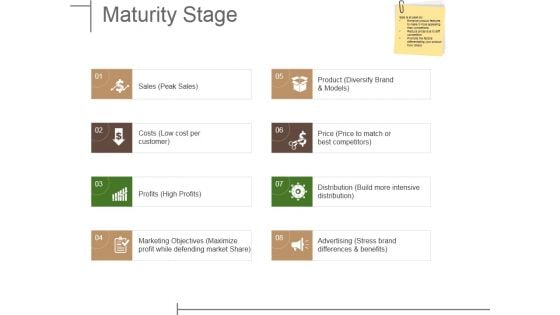
Maturity Stage Ppt PowerPoint Presentation Outline Themes
This is a maturity stage ppt powerpoint presentation outline themes. This is a eight stage process. The stages in this process are sales, costs, profits, marketing objectives, product.
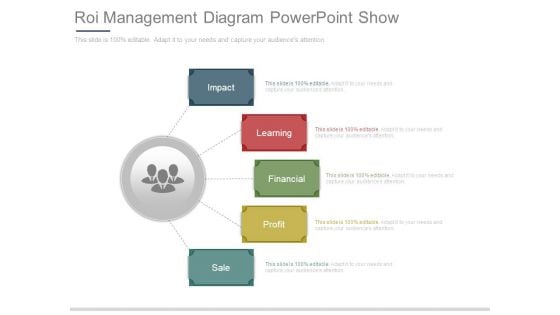
Roi Management Diagram Powerpoint Show
This is a roi management diagram powerpoint show. This is a five stage process. The stages in this process are impact, learning, financial, profit, sale.
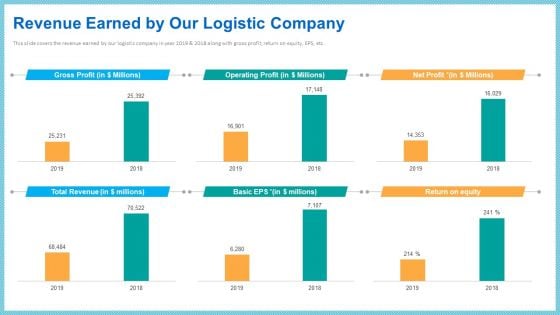
Improving Current Organizational Logistic Process Revenue Earned By Our Logistic Company Demonstration PDF
This slide covers the revenue earned by our logistic company in year 2019 and 2018 along with gross profit, return on equity, EPS, etc. Deliver and pitch your topic in the best possible manner with this improving current organizational logistic process revenue earned by our logistic company demonstration pdf. Use them to share invaluable insights on total revenue, gross profit, operating profit, net profit, return on equity and impress your audience. This template can be altered and modified as per your expectations. So, grab it now.
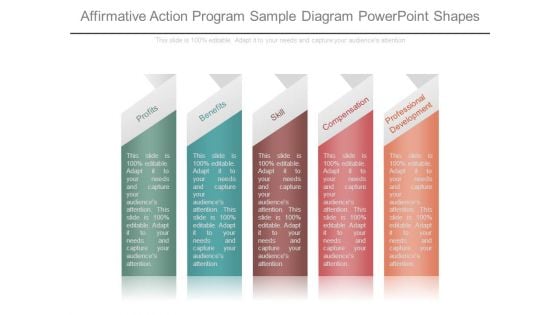
Affirmative Action Program Sample Diagram Powerpoint Shapes
This is a affirmative action program sample diagram powerpoint shapes. This is a five stage process. The stages in this process are profits, benefits, skill, compensation, professional development.
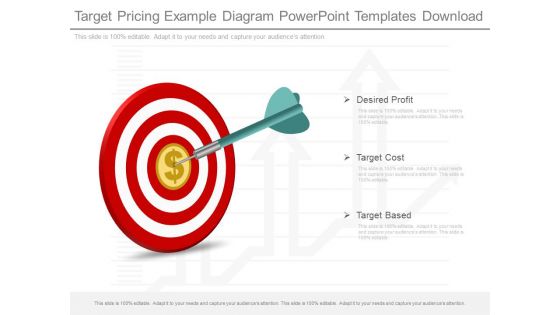
Target Pricing Example Diagram Powerpoint Templates Download
This is a target pricing example diagram powerpoint templates download. This is a three stage process. The stages in this process are desired profit, target cost, target based.
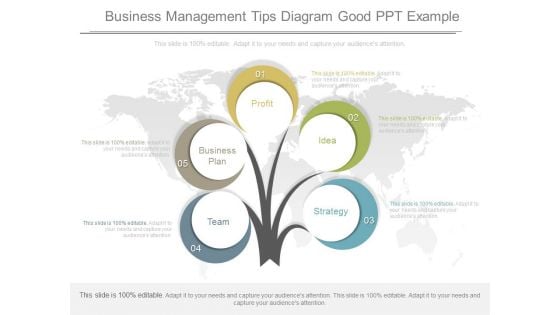
Business Management Tips Diagram Good Ppt Example
This is a business management tips diagram good ppt example. This is a five stage process. The stages in this process are team, business plan, profit, idea, strategy.
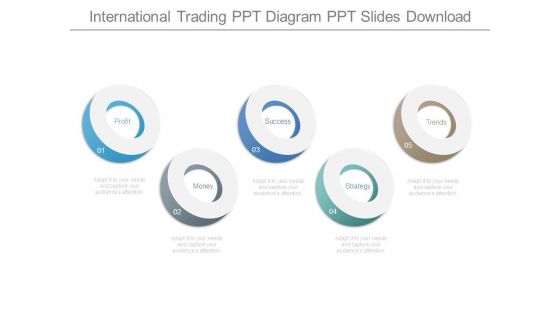
International Trading Ppt Diagram Ppt Slides Download
This is a international trading ppt diagram ppt slides download. This is a five stage process. The stages in this process are profit, money, success, strategy, trends.
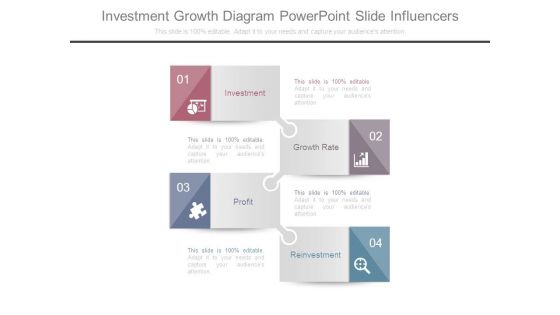
Investment Growth Diagram Powerpoint Slide Influencers
This is a investment growth diagram powerpoint slide influencers. This is a four stage process. The stages in this process are investment, growth rate, profit, reinvestment.
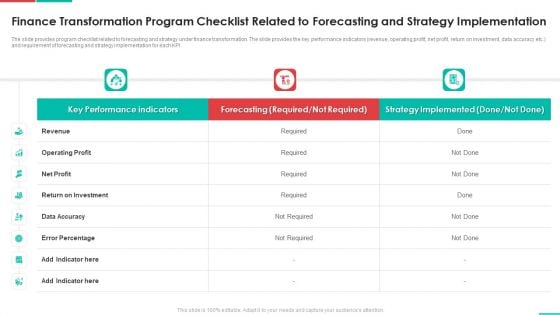
Roadmap For Financial Accounting Transformation Finance Transformation Program Checklist Related Themes PDF
The slide provides program checklist related to forecasting and strategy under finance transformation. The slide provides the key performance indicators revenue, operating profit, net profit, return on investment, data accuracy etc. and requirement of forecasting and strategy implementation for each KPI. Deliver and pitch your topic in the best possible manner with this roadmap for financial accounting transformation finance transformation program checklist related themes pdf. Use them to share invaluable insights on revenue, operating profit, net profit, return on investment, data accuracy and impress your audience. This template can be altered and modified as per your expectations. So, grab it now.
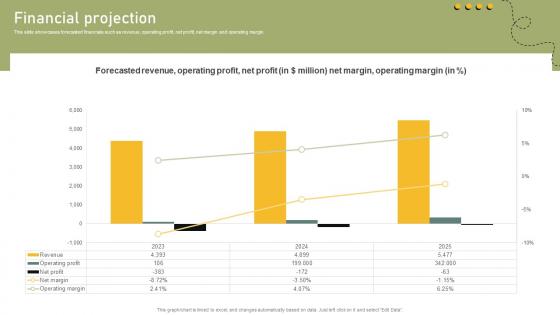
Financial Projection Shared Transportation Platform Business Model BMC SS V
This slide showcases forecasted financials such as revenue, operating profit, net profit, net margin and operating margin. There are so many reasons you need a Financial Projection Shared Transportation Platform Business Model BMC SS V. The first reason is you can not spend time making everything from scratch, Thus, Slidegeeks has made presentation templates for you too. You can easily download these templates from our website easily. This slide showcases forecasted financials such as revenue, operating profit, net profit, net margin and operating margin.
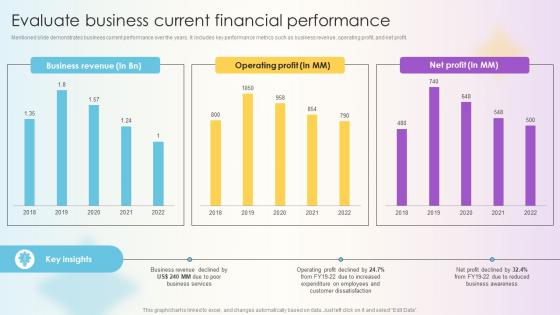
Managing Technical And Non Evaluate Business Current Financial Performance
Mentioned slide demonstrates business current performance over the years. It includes key performance metrics such as business revenue, operating profit, and net profit. The best PPT templates are a great way to save time, energy, and resources. Slidegeeks have 100 percent editable powerpoint slides making them incredibly versatile. With these quality presentation templates, you can create a captivating and memorable presentation by combining visually appealing slides and effectively communicating your message. Download Managing Technical And Non Evaluate Business Current Financial Performance from Slidegeeks and deliver a wonderful presentation. Mentioned slide demonstrates business current performance over the years. It includes key performance metrics such as business revenue, operating profit, and net profit.
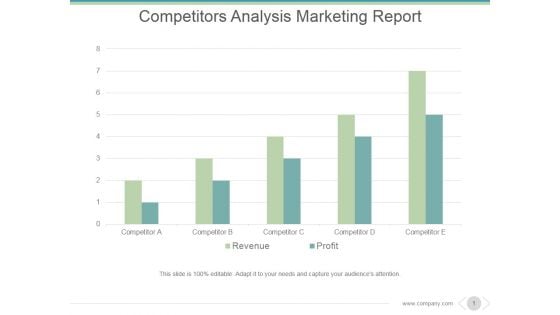
Competitors Analysis Marketing Report Ppt PowerPoint Presentation Tips
This is a competitors analysis marketing report ppt powerpoint presentation tips. This is a five stage process. The stages in this process are competitor, revenue, profit.
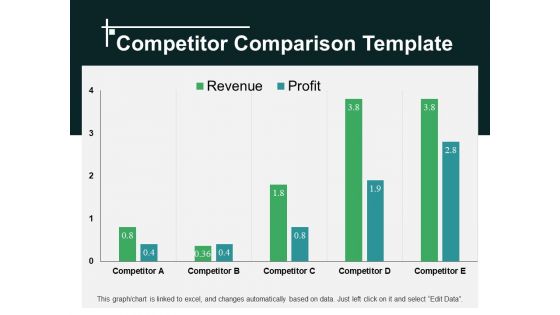
Competitor Comparison Template 2 Ppt PowerPoint Presentation Show Design Ideas
This is a competitor comparison template 2 ppt powerpoint presentation show design ideas. This is a four stage process. The stages in this process are competitor, profit, revenue.
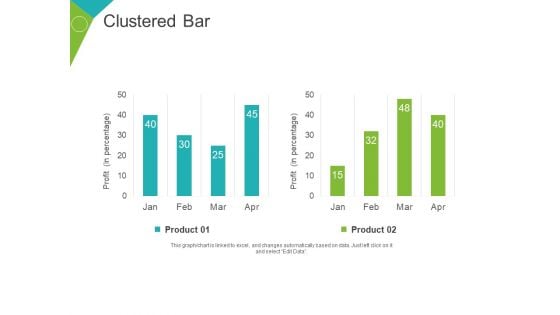
Clustered Bar Ppt PowerPoint Presentation Model Slides
This is a clustered bar ppt powerpoint presentation model slides. This is a two stage process. The stages in this process are product, profit, business, finance, percentage.
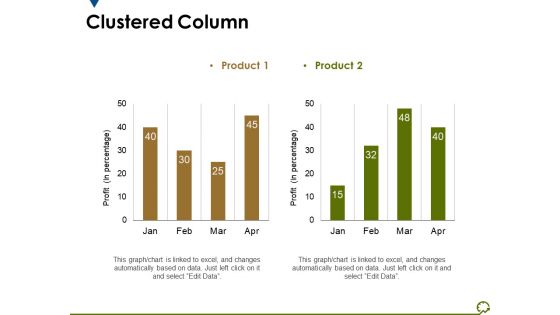
Clustered Column Ppt PowerPoint Presentation File Guidelines
This is a clustered column ppt powerpoint presentation file guidelines. This is a two stage process. The stages in this process are profit, business, marketing, graph, finance.
Clustered Column Ppt PowerPoint Presentation Pictures Objects
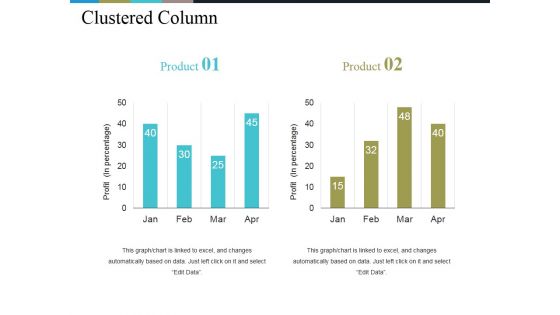
This is a clustered column ppt powerpoint presentation pictures objects. This is a two stage process. The stages in this process are profit, business, marketing, finance graph.
Stacked Column Ppt PowerPoint Presentation Styles File Formats
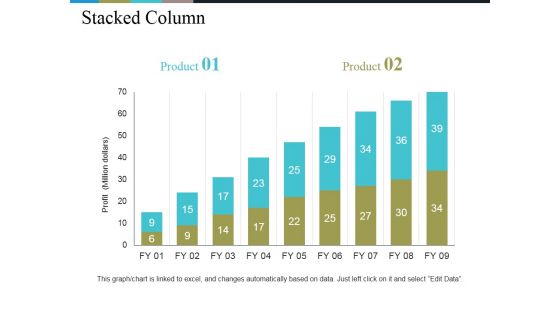
This is a stacked column ppt powerpoint presentation styles file formats. This is a two stage process. The stages in this process are profit, growth, business, graph, strategy.
Stacked Column Ppt PowerPoint Presentation Outline Information
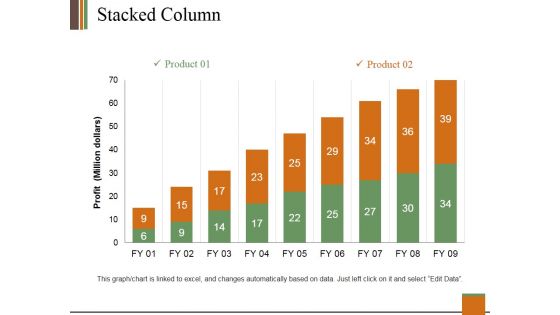
This is a stacked column ppt powerpoint presentation outline information. This is a two stage process. The stages in this process are profit, product, bar graph, growth, success.
Clustered Column Line Ppt PowerPoint Presentation Layouts Structure
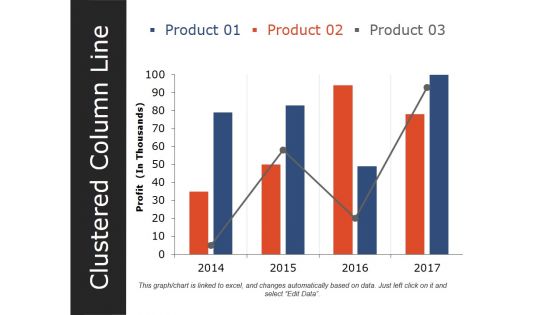
This is a clustered column line ppt powerpoint presentation layouts structure. This is a three stage process. The stages in this process are product, profit, graph, growth, success.
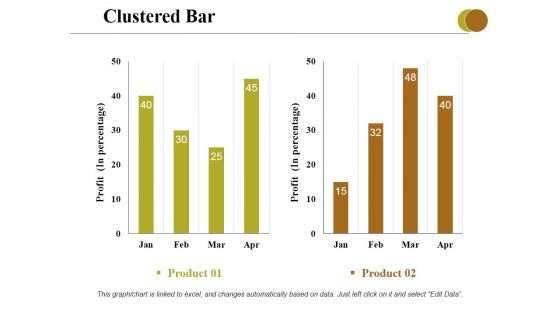
Clustered Bar Ppt PowerPoint Presentation Professional Grid
This is a clustered bar ppt powerpoint presentation professional grid. This is a two stage process. The stages in this process are profit, business, marketing, graph, strategy.
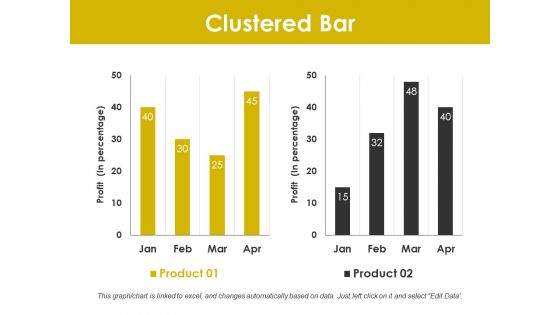
Clustered Bar Ppt PowerPoint Presentation Layouts Layout
This is a clustered bar ppt powerpoint presentation layouts layout. This is a two stage process. The stages in this process are profit, graph, business, marketing, finance.
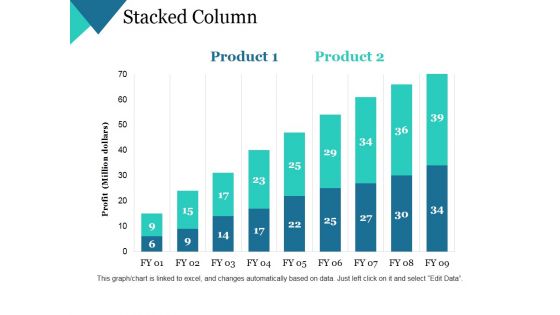
Stacked Column Ppt PowerPoint Presentation Gallery Slide
This is a stacked column ppt powerpoint presentation gallery slide. This is a two stage process. The stages in this process are profit, business, marketing, growth, strategy.
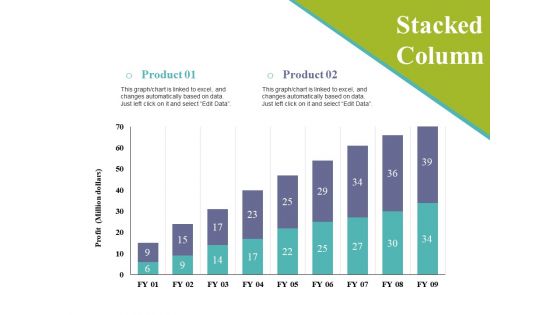
Stacked Column Ppt PowerPoint Presentation Styles Sample
This is a stacked column ppt powerpoint presentation styles sample. This is a two stage process. The stages in this process are profit, business, marketing, growth, graph.
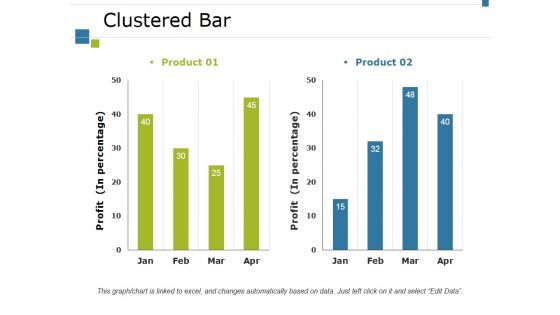
Clustered Bar Ppt PowerPoint Presentation Styles Portfolio
This is a clustered bar ppt powerpoint presentation styles portfolio. This is a two stage process. The stages in this process are product, profit, bar graph, growth, success.
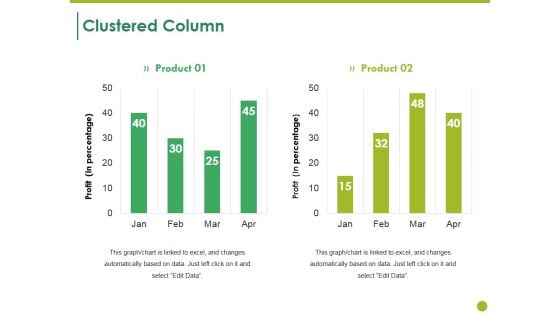
Clustered Column Ppt PowerPoint Presentation Layouts Ideas
This is a clustered column ppt powerpoint presentation layouts ideas. This is a two stage process. The stages in this process are product, profit, bar graph, growth, finance.
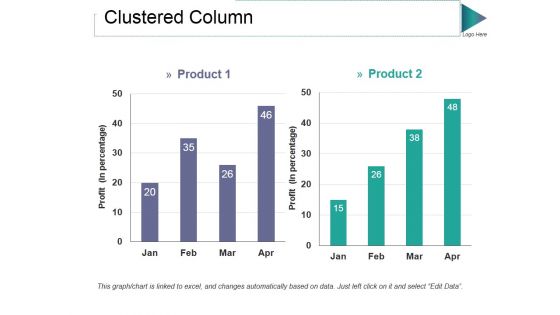
Clustered Column Ppt PowerPoint Presentation Professional Styles
This is a clustered column ppt powerpoint presentation professional styles. This is a two stage process. The stages in this process are product, profit, bar graph, growth, success.
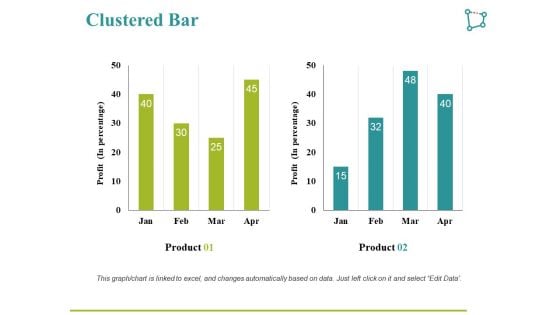
Clustered Bar Ppt PowerPoint Presentation Slides Deck
This is a clustered bar ppt powerpoint presentation slides deck. This is a two stage process. The stages in this process are product, profit, bar graph.
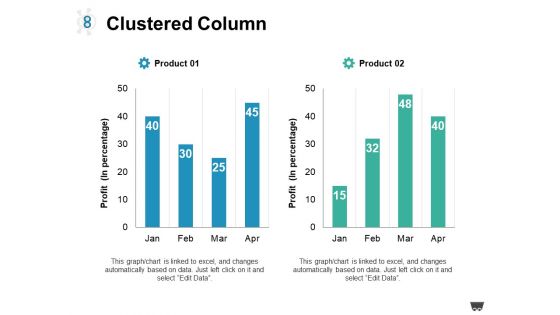
Clustered Column Ppt PowerPoint Presentation Show Introduction
This is a clustered column ppt powerpoint presentation show introduction. This is a two stage process. The stages in this process are product, profit, bar graph.
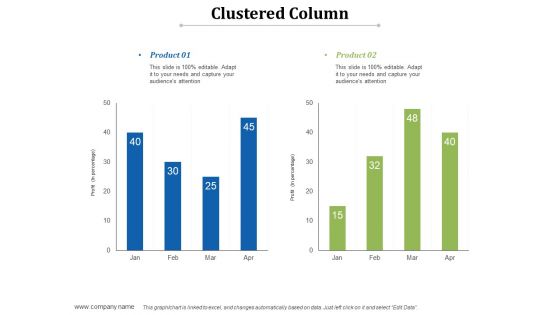
Clustered Column Ppt PowerPoint Presentation Styles Templates
This is a clustered column ppt powerpoint presentation styles templates. This is a two stage process. The stages in this process are product, profit, bar graph.
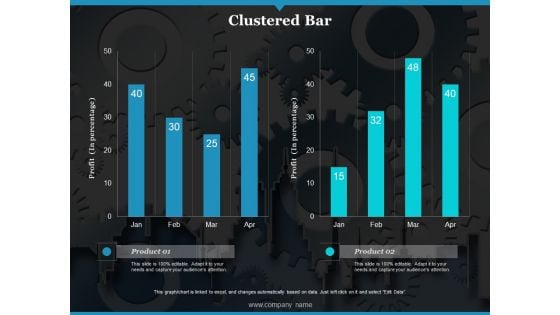
Clustered Bar Ppt PowerPoint Presentation Slides Graphic Tips
This is a clustered bar ppt powerpoint presentation slides graphic tips. This is a two stage process. The stages in this process are profit, product, clustered bar.
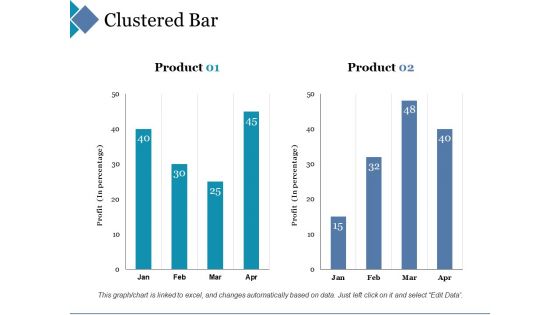
Clustered Bar Ppt PowerPoint Presentation Layouts Professional
This is a clustered bar ppt powerpoint presentation layouts professional. This is a two stage process. The stages in this process are clustered bar, product, profit, percentage.
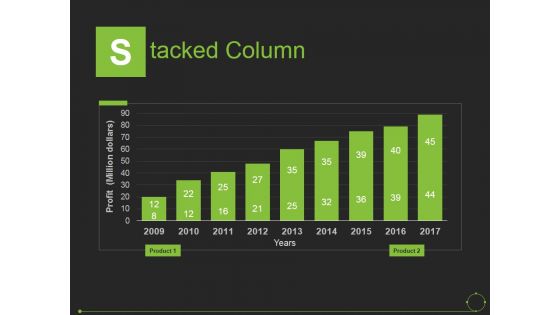
Stacked Column Ppt PowerPoint Presentation Slides Introduction
This is a stacked column ppt powerpoint presentation slides introduction. This is a nine stage process. The stages in this process are years, profit, product, business, marketing.
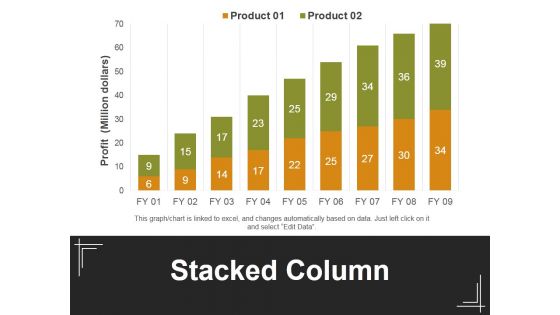
Stacked Column Ppt PowerPoint Presentation Outline Maker
This is a stacked column ppt powerpoint presentation outline maker. This is a two stage process. The stages in this process are profit, stacked bar, product, business, marketing.
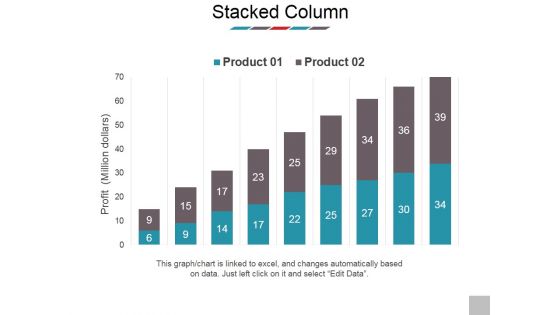
Stacked Column Ppt PowerPoint Presentation Professional Deck
This is a stacked column ppt powerpoint presentation professional deck. This is a two stage process. The stages in this process are profit, business, marketing, presentation, product.
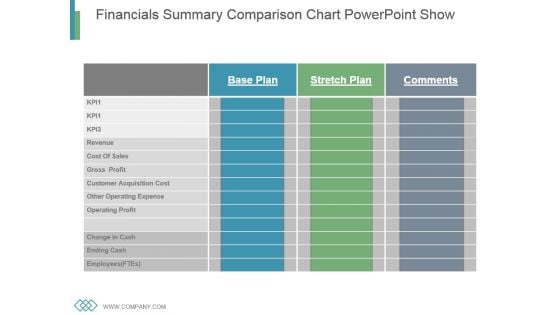
Financials Summary Comparison Chart Powerpoint Show
This is a financials summary comparison chart powerpoint show. This is a three stage process. The stages in this process are revenue, cost of sales, gross profit, customer acquisition cost, other operating cost expense, operating profit, change in cash, ending cash, employees.
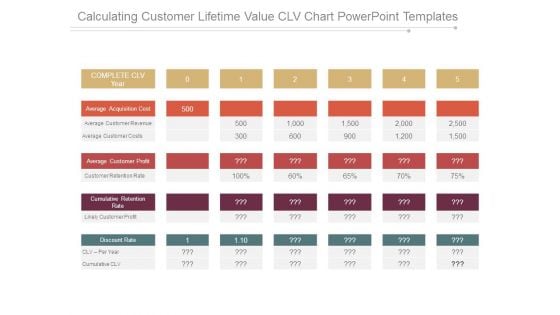
Calculating Customer Lifetime Value Clv Chart Powerpoint Templates
This is a calculating customer lifetime value clv chart powerpoint templates. This is a five stage process. The stages in this process are complete clv year, average acquisition cost, average customer revenue, average customer costs, average customer profit, customer retention rate, cumulative retention rate, likely customer profit, discount rate, clv per year, cumulative clv.

Financials Base Plan Table Chart Ppt Slide Templates
This is a financials base plan table chart ppt slide templates. This is a five stage process. The stages in this process are kpi, revenue, cost of sales, gross profit, customer acquisition cost, other operating cost expense, operating profit, change in cash, ending cash, employees ftes.
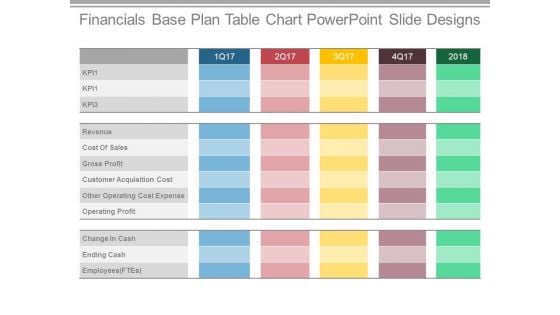
Financials Base Plan Table Chart Powerpoint Slide Designs
This is a financials base plan table chart powerpoint slide designs. This is a five stage process. The stages in this process are revenue, cost of sales, gross profit, customer acquisition cost, other operating cost expense, operating profit, change in cash, ending cash.

Lifetime Customer Value Lcv Display Table Powerpoint Themes
This is a lifetime customer value lcv display table powerpoint themes. This is a five stage process. The stages in this process are complete clv year, average acquisition cost, average customer revenue, average customer costs, average customer profit, customer retention rate, cumulative retention rate, likely customer profit, discount rate, clv per year, cumulative clv.
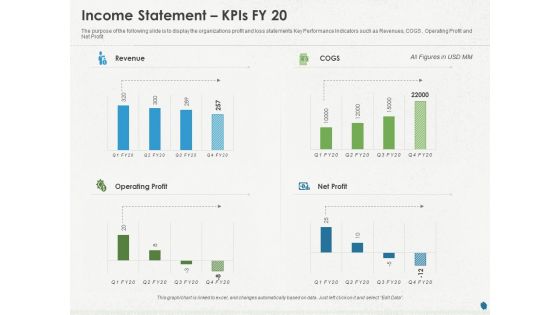
Distressed Debt Refinancing For Organizaton Income Statement Kpis FY 20 Ppt PowerPoint Presentation Model Guide PDF
Presenting this set of slides with name distressed debt refinancing for organizaton income statement kpis fy 20 ppt powerpoint presentation model guide pdf. The topics discussed in these slides are revenue, cogs, operating profit, net profit. This is a completely editable PowerPoint presentation and is available for immediate download. Download now and impress your audience.
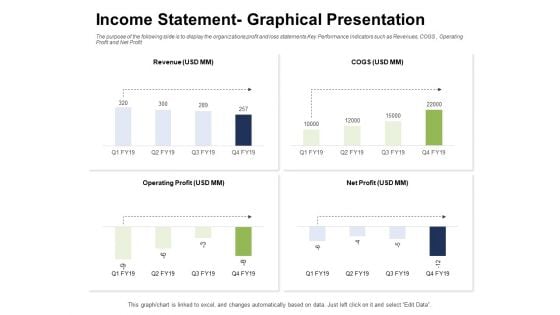
Ways To Bounce Back From Insolvency Income Statement Graphical Presentation Slides PDF
Presenting this set of slides with name ways to bounce back from insolvency income statement graphical presentation slides pdf. The topics discussed in these slides are revenue, operating profit, net profit. This is a completely editable PowerPoint presentation and is available for immediate download. Download now and impress your audience.
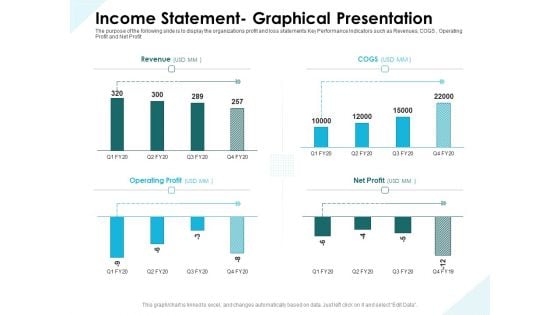
Issues Which Leads To Insolvency Income Statement Graphical Presentation Download PDF
Presenting this set of slides with name issues which leads to insolvency income statement graphical presentation download pdf. The topics discussed in these slides are revenue, operating profit, net profit. This is a completely editable PowerPoint presentation and is available for immediate download. Download now and impress your audience.
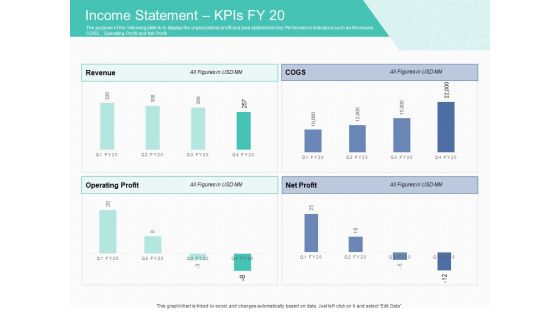
Corporate Debt Refinancing And Restructuring Income Statement Kpis FY 20 Pictures PDF
Presenting this set of slides with name corporate debt refinancing and restructuring income statement kpis fy 20 pictures pdf. The topics discussed in these slides are revenue, cogs, operating profit, net profit. This is a completely editable PowerPoint presentation and is available for immediate download. Download now and impress your audience.
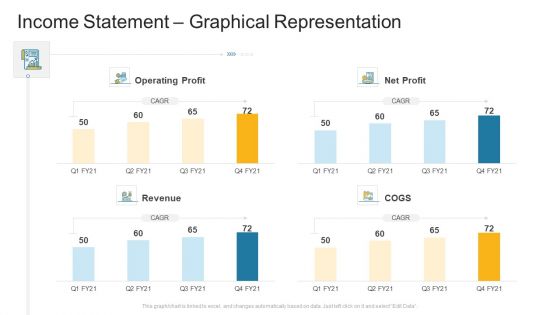
Income Statement Graphical Representation Company Profile Ppt Infographic Template Guidelines PDF
Deliver an awe inspiring pitch with this creative income statement graphical representation company profile ppt infographic template guidelines pdf bundle. Topics like operating profit, net profit, revenue, cogs can be discussed with this completely editable template. It is available for immediate download depending on the needs and requirements of the user.
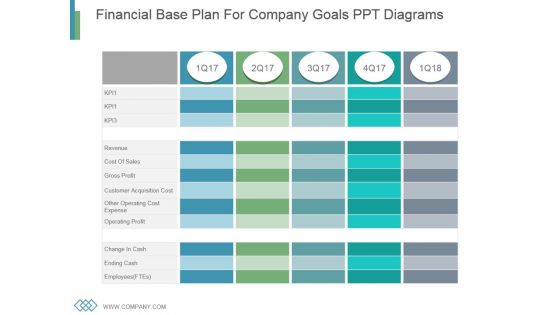
Financial Base Plan For Company Goals Ppt Diagrams
This is a financial base plan for company goals ppt diagrams. This is a five stage process. The stages in this process are revenue, cost of sales, gross profit, customer acquisition cost, other operating cost expense, operating profit, change in cash, ending cash, employees.
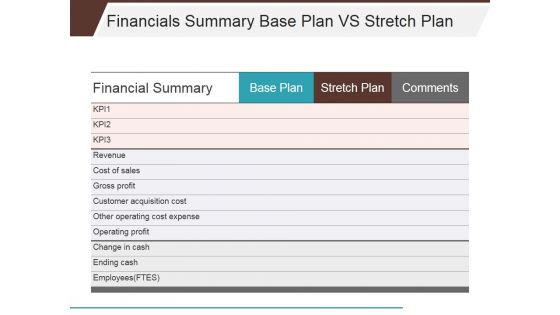
Financials Summary Base Plan Vs Stretch Plan Ppt PowerPoint Presentation Infographics Themes
This is a financials summary base plan vs stretch plan ppt powerpoint presentation infographics themes. This is a three stage process. The stages in this process are revenue, cost of sales, gross profit, customer acquisition cost, other operating cost expense, operating profit.
Increase In Dollar Graph Finance PowerPoint Templates And PowerPoint Themes 0912
Increase In Dollar Graph Finance PowerPoint Templates And PowerPoint Themes 0912-Microsoft Powerpoint Templates and Background with business graph with arrow showing profits-Business graph with arrow showing profits, signs, success, finance, business, arrows Encourage teams with our Increase In Dollar Graph Finance PowerPoint Templates And PowerPoint Themes 0912. Download without worries with our money back guaranteee.
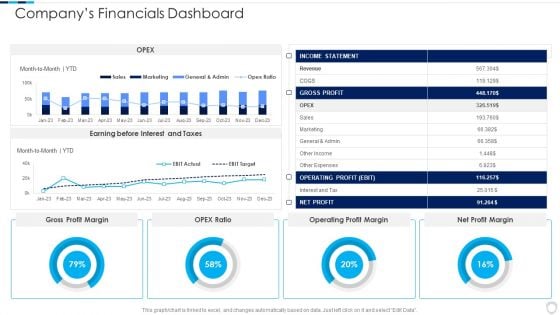
Financial Report Of An IT Firm Companys Financials Dashboard Infographics PDF
Deliver an awe inspiring pitch with this creative Financial Report Of An IT Firm Companys Financials Dashboard Infographics PDF bundle. Topics like Operating Profit, Gross Profit, Income Statement can be discussed with this completely editable template. It is available for immediate download depending on the needs and requirements of the user.
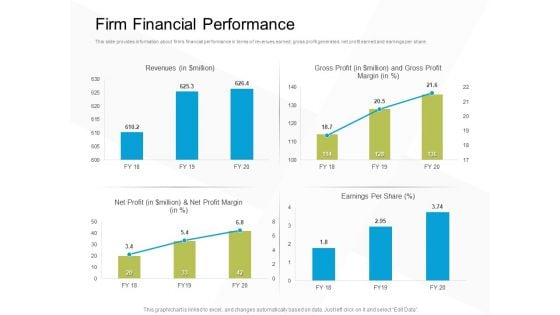
Business Evacuation Plan Firm Financial Performance Ppt PowerPoint Presentation Professional Inspiration PDF
Presenting this set of slides with name business evacuation plan firm financial performance ppt powerpoint presentation professional inspiration pdf. The topics discussed in these slides are revenues, gross profit, net profit, earnings per share. This is a completely editable PowerPoint presentation and is available for immediate download. Download now and impress your audience.
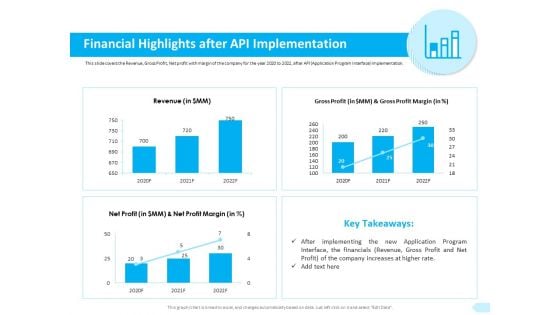
API Integration Software Development Financial Highlights After API Implementation Structure PDF
Presenting this set of slides with name api integration software development financial highlights after api implementation structure pdf. The topics discussed in these slides are revenue, gross profit, net profit. This is a completely editable PowerPoint presentation and is available for immediate download. Download now and impress your audience.
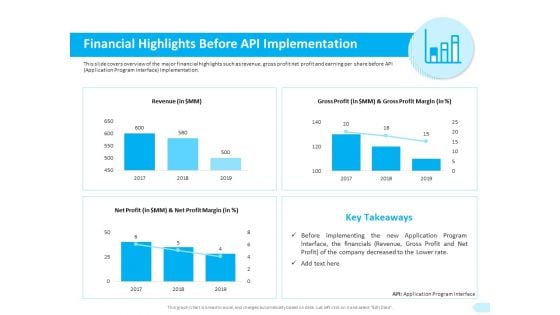
API Integration Software Development Financial Highlights Before API Implementation Template PDF
Presenting this set of slides with name api integration software development financial highlights before api implementation template pdf. The topics discussed in these slides are revenue, gross profit, net profit. This is a completely editable PowerPoint presentation and is available for immediate download. Download now and impress your audience.
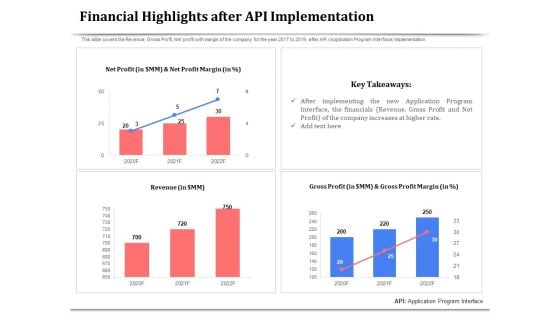
API Management For Building Software Applications Financial Highlights After API Implementation Brochure PDF
Presenting this set of slides with name api management for building software applications financial highlights after api implementation brochure pdf. The topics discussed in these slides are net profit, key takeaways, revenue, gross profit. This is a completely editable PowerPoint presentation and is available for immediate download. Download now and impress your audience.
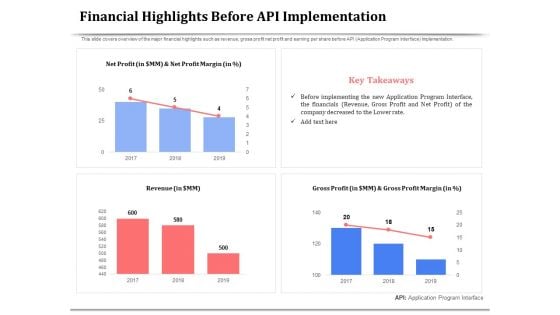
API Management For Building Software Applications Financial Highlights Before API Implementation Summary PDF
Presenting this set of slides with name api management for building software applications financial highlights before api implementation summary pdf. The topics discussed in these slides are net profit, key takeaways, revenue, gross profit. This is a completely editable PowerPoint presentation and is available for immediate download. Download now and impress your audience.
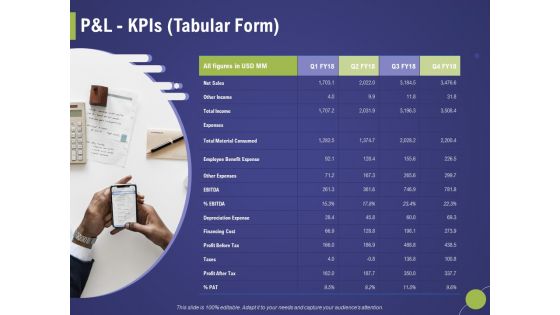
Firm Capability Assessment Pandl Kpis Tabular Form Ppt Infographic Template Inspiration PDF
Presenting this set of slides with name firm capability assessment pandl kpis tabular form ppt infographic template inspiration pdf. The topics discussed in these slides are revenue, net profit, operating profit, cogs. This is a completely editable PowerPoint presentation and is available for immediate download. Download now and impress your audience.
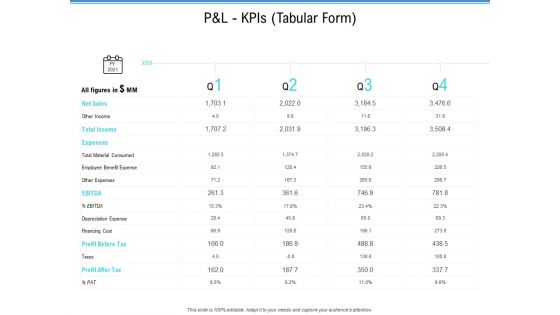
Enterprise Analysis P And L Kpis Tabular Form Ppt Slides Graphics Download PDF
Deliver and pitch your topic in the best possible manner with this enterprise analysis p and l kpis tabular form ppt slides graphics download pdf. Use them to share invaluable insights on operating profit, net profit, cogs, revenue and impress your audience. This template can be altered and modified as per your expectations. So, grab it now.
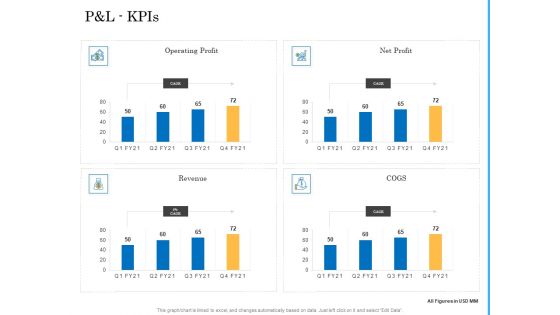
Deal Assessment Audit Process P And L Kpis Download PDF
Deliver and pitch your topic in the best possible manner with this deal assessment audit process p and l kpis download pdf. Use them to share invaluable insights on operating profit, net profit, revenue, cogs and impress your audience. This template can be altered and modified as per your expectations. So, grab it now.
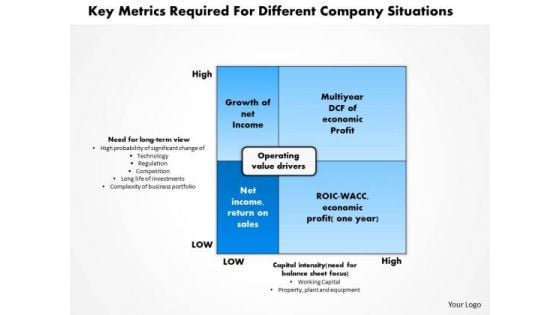
Business Framework Key Metrics Required For Different Company Situations PowerPoint Presentation
This diagram has been designed with framework of key metrics required for different company situations. This diagram contains rectangle of operating value drivers with four sections inside it representing terms like growth of net Income, multiyear DCF of economic profit, net income, return on sales, ROIC-WACC, and economic profit. Use this as a major element in streamlining any business process.
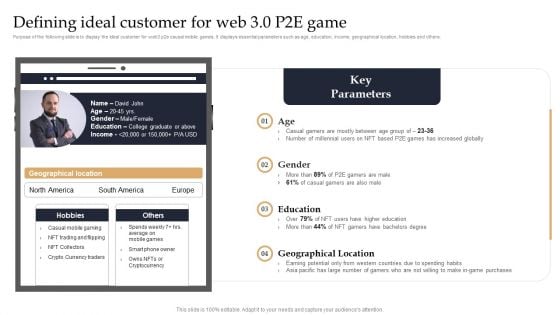
Web 3 0 Blockchain Based P2E Mobile Game Sector Report Promotional Plan Defining Ideal Customer For Web Template PDF
Purpose of the following slide is to display the ideal customer for web3 p2e causal mobile games. It displays essential parameters such as age, education, income, geographical location, hobbies and others. Get a simple yet stunning designed Web 3 0 Blockchain Based P2E Mobile Game Sector Report Promotional Plan Defining Ideal Customer For Web Template PDF. It is the best one to establish the tone in your meetings. It is an excellent way to make your presentations highly effective. So, download this PPT today from Slidegeeks and see the positive impacts. Our easy-to-edit Web 3 0 Blockchain Based P2E Mobile Game Sector Report Promotional Plan Defining Ideal Customer For Web Icons PDF can be your go-to option for all upcoming conferences and meetings. So, what are you waiting for. Grab this template today.

Value Proposition Product Benefits Ppt PowerPoint Presentation Influencers
This is a value proposition product benefits ppt powerpoint presentation influencers. This is a six stage process. The stages in this process are benefit, business, marketing, management, icons.

 Home
Home