Profit Icon
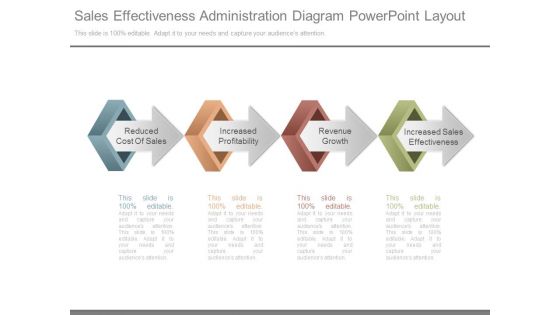
Sales Effectiveness Administration Diagram Powerpoint Layout
This is a sales effectiveness administration diagram powerpoint layout. This is a four stage process. The stages in this process are reduced cost of sales, increased profitability, revenue growth, increased sales effectiveness.
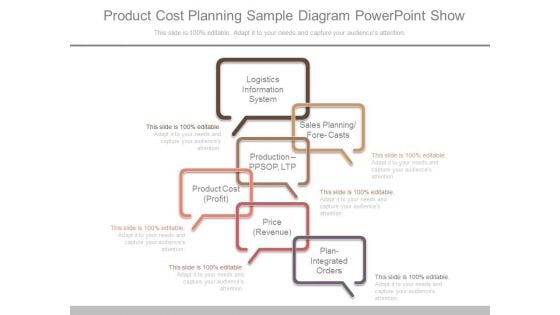
Product Cost Planning Sample Diagram Powerpoint Show
This is a product cost planning sample diagram powerpoint show. This is a six stage process. The stages in this process are logistics information system, sales planning, forecasts, production ppsop, ltp, product cost profit, price revenue, plan integrated orders.
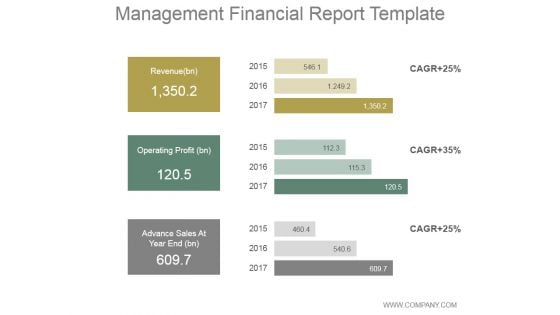
Management Financial Report Ppt PowerPoint Presentation Diagrams
This is a management financial report ppt powerpoint presentation diagrams. This is a three stage process. The stages in this process are revenue, operating profit, advance sales at year end.

Executive Summary Ppt PowerPoint Presentation Outline Diagrams
This is a executive summary ppt powerpoint presentation outline diagrams. This is a two stage process. The stages in this process are revenue, profits, operational cost, total customers, marketing channels.
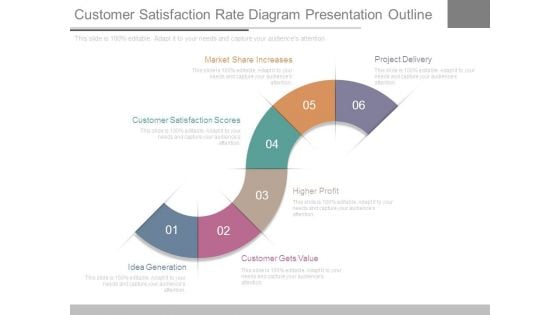
Customer Satisfaction Rate Diagram Presentation Outline
This is a customer satisfaction rate diagram presentation outline. This is a six stage process. The stages in this process are idea generation, customer gets value, higher profit, customer satisfaction scores, market share increases, project delivery.
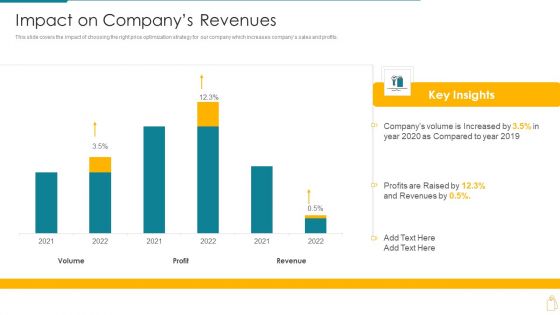
Cost And Income Optimization Impact On Companys Revenues Rules PDF
This slide covers the impact of choosing the right price optimization strategy for our company which increases companys sales and profits. Deliver an awe inspiring pitch with this creative cost and income optimization impact on companys revenues rules pdf bundle. Topics like volume, profit, revenue, 2021 to 2022 can be discussed with this completely editable template. It is available for immediate download depending on the needs and requirements of the user.
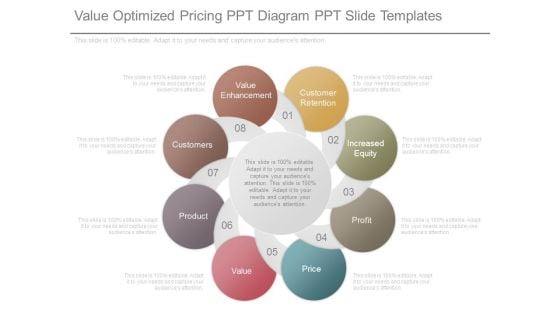
Value Optimized Pricing Ppt Diagram Ppt Slide Templates
This is a value optimized pricing ppt diagram ppt slide templates. This is a eight stage process. The stages in this process are value enhancement, customers, product, value, customer retention, increased equity, profit, price.

Business Management Information Systems Diagram Presentation Deck
This is a business management information systems diagram presentation deck. This is a seven stage process. The stages in this process are corporations, consulting with a firm or as a freelancer, government, education, technology entrepreneurship, healthcare, non profits.
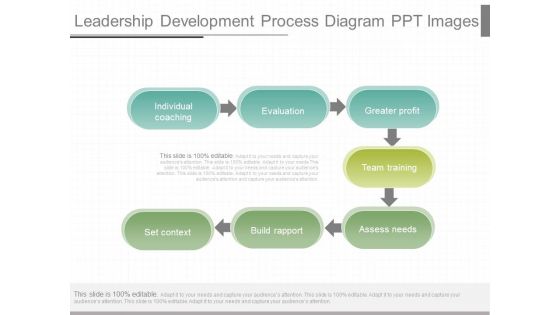
Leadership Development Process Diagram Ppt Images
This is a leadership development process diagram ppt images. This is a seven stage process. The stages in this process are individual coaching, evaluation, greater profit, team training, assess needs, build rapport, set context.
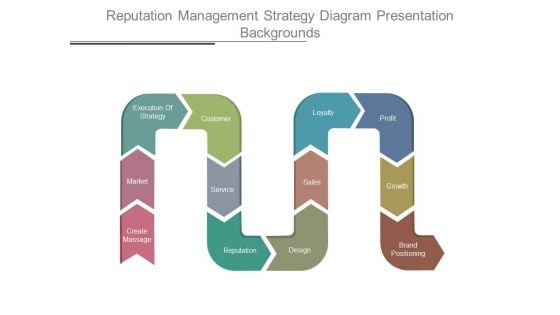
Reputation Management Strategy Diagram Presentation Backgrounds
This is a reputation management strategy diagram presentation backgrounds. This is a twelve stage process. The stages in this process are create massage, market, execution of strategy, customer, service, reputation, design, sales, loyalty, profit, growth, brand positioning.
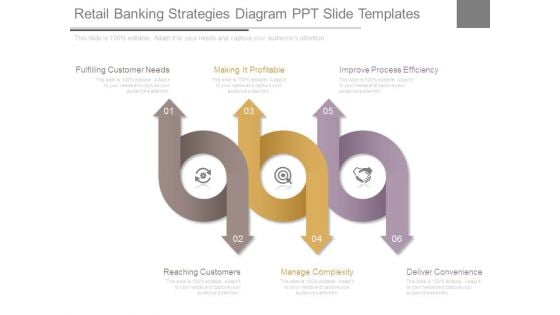
Retail Banking Strategies Diagram Ppt Slide Templates
This is a retail banking strategies diagram ppt slide templates. This is a six stage process. The stages in this process are fulfilling customer needs, making it profitable, improve process efficiency, reaching customers, manage complexity, deliver convenience.
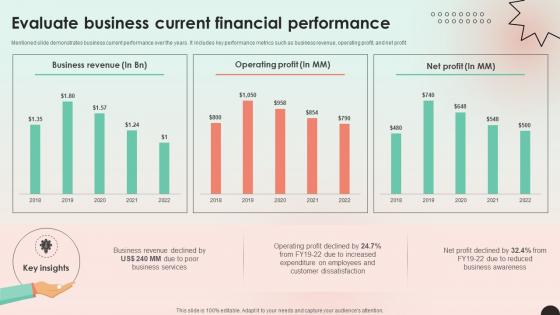
Web Consulting Business Evaluate Business Current Financial Performance
Mentioned slide demonstrates business current performance over the years. It includes key performance metrics such as business revenue, operating profit, and net profit. Are you searching for a Web Consulting Business Evaluate Business Current Financial Performance that is uncluttered, straightforward, and original Its easy to edit, and you can change the colors to suit your personal or business branding. For a presentation that expresses how much effort you have put in, this template is ideal With all of its features, including tables, diagrams, statistics, and lists, its perfect for a business plan presentation. Make your ideas more appealing with these professional slides. Download Web Consulting Business Evaluate Business Current Financial Performance from Slidegeeks today. Mentioned slide demonstrates business current performance over the years. It includes key performance metrics such as business revenue, operating profit, and net profit.
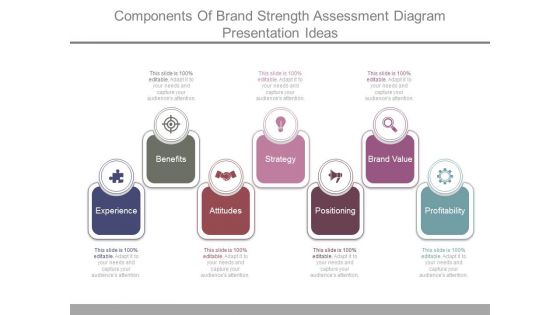
Components Of Brand Strength Assessment Diagram Presentation Ideas
This is a components of brand strength assessment diagram presentation ideas. This is a seven stage process. The stages in this process are benefits, experience, attitudes, strategy, positioning, brand value, profitability.
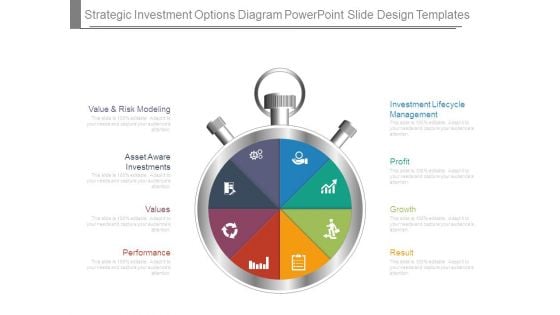
Strategic Investment Options Diagram Powerpoint Slide Design Templates
This is a strategic investment options diagram powerpoint slide design templates. This is a eight stage process. The stages in this process are value and risk modeling, asset aware investments, values, performance, investment lifecycle management, profit, growth, result.
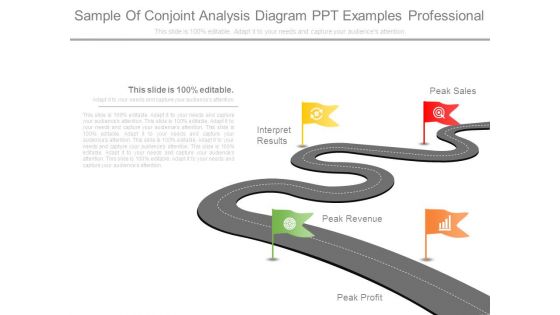
Sample Of Conjoint Analysis Diagram Ppt Examples Professional
This is a sample of conjoint analysis diagram ppt examples professional. This is a four stage process. The stages in this process are peak profit, peak revenue, interpret results, peak sales.
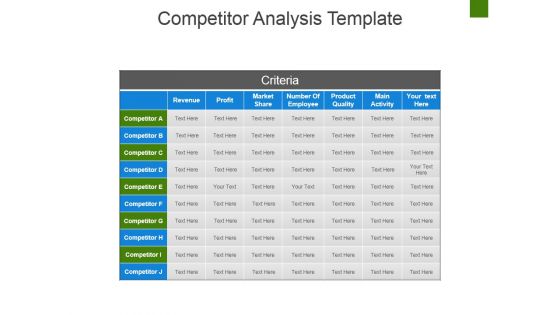
Competitor Analysis Template Ppt PowerPoint Presentation Pictures Diagrams
This is a competitor analysis template ppt powerpoint presentation pictures diagrams. This is a seven stage process. The stages in this process are revenue, profit, market share, number of employee, product quality, main activity.
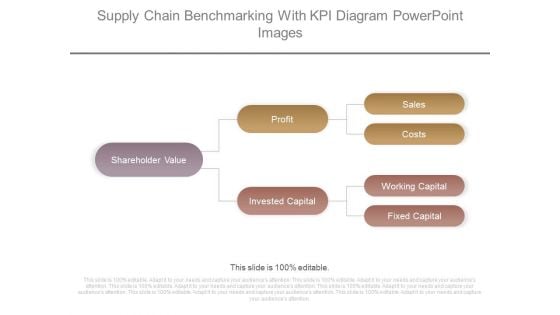
Supply Chain Benchmarking With Kpi Diagram Powerpoint Images
This is a supply chain benchmarking with kpi diagram powerpoint images. This is a three stage process. The stages in this process are shareholder value, profit, invested capital, sales, costs, working capital, fixed capital.

Business Diagram Roulette Wheel For Business Risk Presentation Template
Our above slide displays graphics of roulette wheel. Download our above diagram to express views on gambling, business risk and profit. Use this diagram to get good comments from viewers.
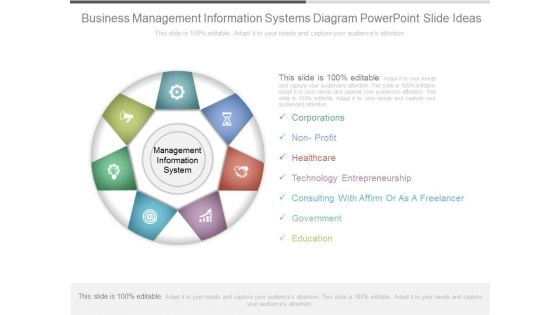
Business Management Information Systems Diagram Powerpoint Slide Ideas
This is a business management information systems diagram powerpoint slide ideas. This is a seven stage process. The stages in this process are corporations, non profit, healthcare, technology entrepreneurship, consulting with affirm or as a freelancer, government, education.
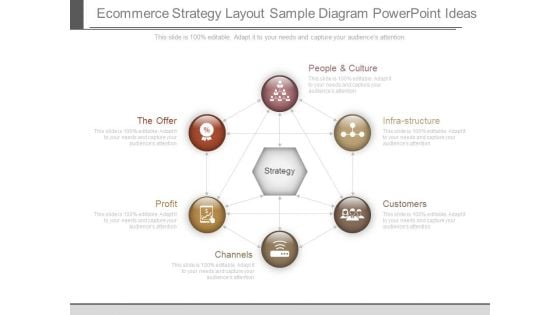
E Commerce Strategy Layout Sample Diagram Powerpoint Ideas
This is a e commerce strategy layout sample diagram powerpoint ideas. This is a six stage process. The stages in this process are people and culture, the offer, infrastructure, customers, channels, profit, strategy.\n\n\n\n
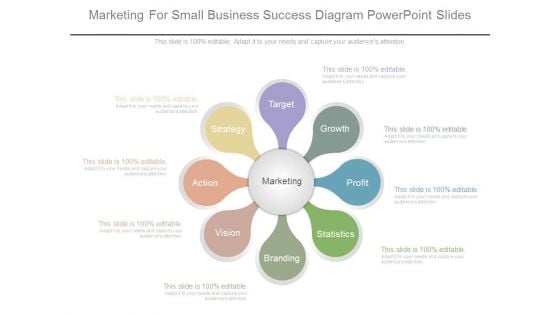
Marketing For Small Business Success Diagram Powerpoint Slides
This is a marketing for small business success diagram powerpoint slides. This is a eight stage process. The stages in this process are target, growth, profit, statistics, branding, vision, action, strategy, marketing.
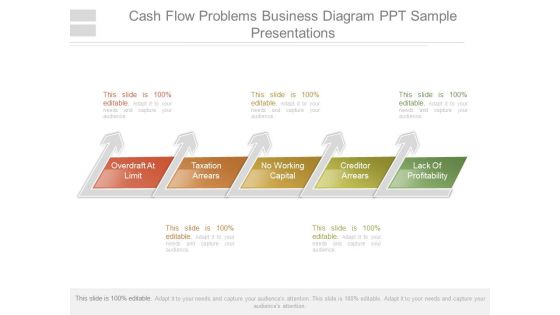
Cash Flow Problems Business Diagram Ppt Sample Presentations
This is a cash flow problems business diagram ppt sample presentations. This is a five stage process. The stages in this process are overdraft at limit, taxation arrears, no working capital, creditor arrears, lack of profitability.
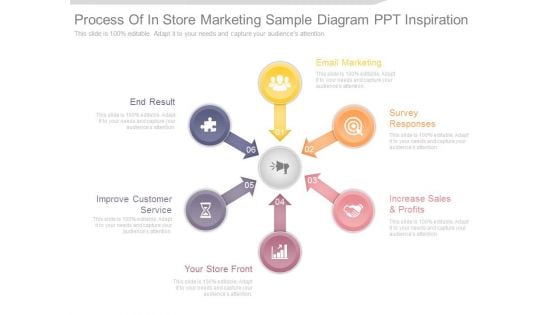
Process Of In Store Marketing Sample Diagram Ppt Inspiration
This is a process of in store marketing sample diagram ppt inspiration. This is a six stage process. The stages in this process are end result, improve customer service, your store front, increase sales and profits, survey responses, email marketing.
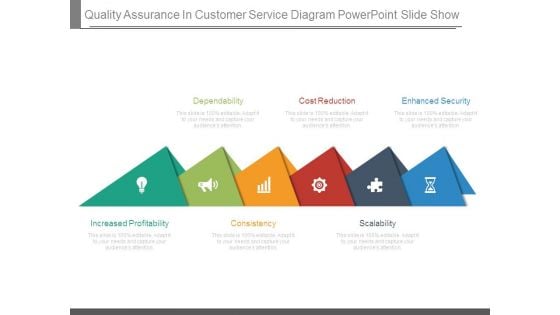
Quality Assurance In Customer Service Diagram Powerpoint Slide Show
This is a quality assurance in customer service diagram powerpoint slide show. This is a six stage process. The stages in this process are dependability, cost reduction, enhanced security, scalability, consistency, increased profitability.
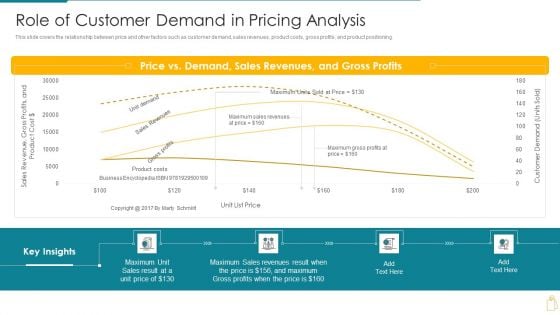
Cost And Income Optimization Role Of Customer Demand In Pricing Analysis Topics PDF
This slide covers the relationship between price and other factors such as customer demand, sales revenues, product costs, gross profits, and product positioning. Deliver an awe inspiring pitch with this creative cost and income optimization role of customer demand in pricing analysis topics pdf bundle. Topics like gross profits, sales revenues, price vs demand can be discussed with this completely editable template. It is available for immediate download depending on the needs and requirements of the user.
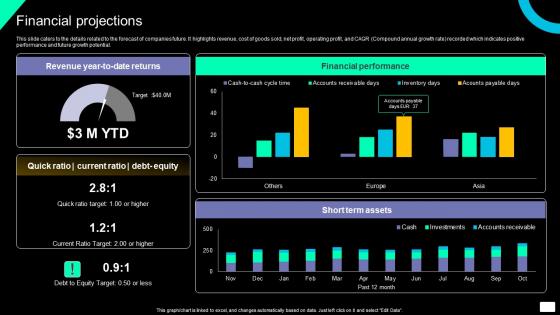
Financial Projections Brand Exposure And Lead Generation Software Investment Designs Pdf
This slide caters to the details related to the forecast of companies future. It highlights revenue, cost of goods sold, net profit, operating profit, and CAGR Compound annual growth rate recorded which indicates positive performance and future growth potential. Present like a pro with Financial Projections Brand Exposure And Lead Generation Software Investment Designs Pdf Create beautiful presentations together with your team, using our easy-to-use presentation slides. Share your ideas in real-time and make changes on the fly by downloading our templates. So whether you are in the office, on the go, or in a remote location, you can stay in sync with your team and present your ideas with confidence. With Slidegeeks presentation got a whole lot easier. Grab these presentations today. This slide caters to the details related to the forecast of companies future. It highlights revenue, cost of goods sold, net profit, operating profit, and CAGR Compound annual growth rate recorded which indicates positive performance and future growth potential.
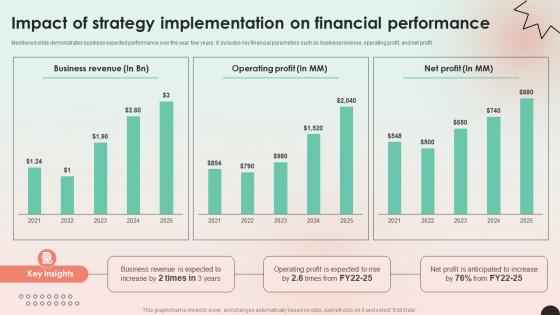
Web Consulting Business Impact Of Strategy Implementation On Financial
Mentioned slide demonstrates business expected performance over the year few years. It includes key financial parameters such as business revenue, operating profit, and net profit. Here you can discover an assortment of the finest PowerPoint and Google Slides templates. With these templates, you can create presentations for a variety of purposes while simultaneously providing your audience with an eye-catching visual experience. Download Web Consulting Business Impact Of Strategy Implementation On Financial to deliver an impeccable presentation. These templates will make your job of preparing presentations much quicker, yet still, maintain a high level of quality. Slidegeeks has experienced researchers who prepare these templates and write high-quality content for you. Later on, you can personalize the content by editing the Web Consulting Business Impact Of Strategy Implementation On Financial. Mentioned slide demonstrates business expected performance over the year few years. It includes key financial parameters such as business revenue, operating profit, and net profit.
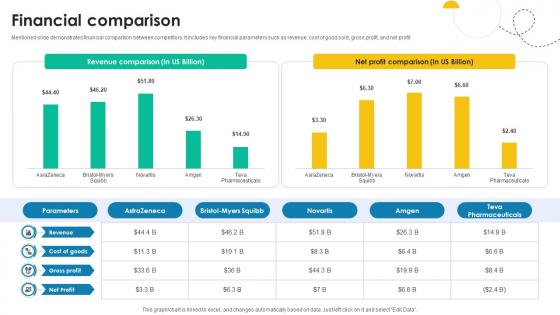
Financial Comparison Medical Research And Development Company Profile CP SS V
Mentioned slide demonstrates financial comparison between competitors. It includes key financial parameters such as revenue, cost of good sold, gross profit, and net profit. Are you in need of a template that can accommodate all of your creative concepts This one is crafted professionally and can be altered to fit any style. Use it with Google Slides or PowerPoint. Include striking photographs, symbols, depictions, and other visuals. Fill, move around, or remove text boxes as desired. Test out color palettes and font mixtures. Edit and save your work, or work with colleagues. Download Financial Comparison Medical Research And Development Company Profile CP SS V and observe how to make your presentation outstanding. Give an impeccable presentation to your group and make your presentation unforgettable. Mentioned slide demonstrates financial comparison between competitors. It includes key financial parameters such as revenue, cost of good sold, gross profit, and net profit.

Executive Summary Vehicle Manufacturing Company Profile CP SS V
This slide represents the executive summary of Mitsubishi, which includes details regarding the team, revenue, net profit, operating segment, and gross profit. Do you have an important presentation coming up Are you looking for something that will make your presentation stand out from the rest Look no further than Executive Summary Vehicle Manufacturing Company Profile CP SS V. With our professional designs, you can trust that your presentation will pop and make delivering it a smooth process. And with Slidegeeks, you can trust that your presentation will be unique and memorable. So why wait Grab Executive Summary Vehicle Manufacturing Company Profile CP SS V today and make your presentation stand out from the rest This slide represents the executive summary of Mitsubishi, which includes details regarding the team, revenue, net profit, operating segment, and gross profit.
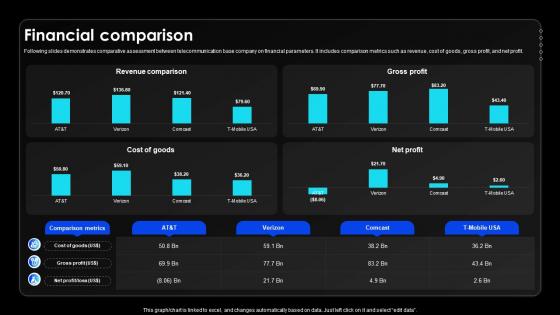
Financial Comparison Wireless Communication Services Provider Company Profile CP SS V
Following slides demonstrates comparative assessment between telecommunication base company on financial parameters. It includes comparison metrics such as revenue, cost of goods, gross profit, and net profit.If your project calls for a presentation, then Slidegeeks is your go-to partner because we have professionally designed, easy-to-edit templates that are perfect for any presentation. After downloading, you can easily edit Financial Comparison Wireless Communication Services Provider Company Profile CP SS V and make the changes accordingly. You can rearrange slides or fill them with different images. Check out all the handy templates Following slides demonstrates comparative assessment between telecommunication base company on financial parameters. It includes comparison metrics such as revenue, cost of goods, gross profit, and net profit.
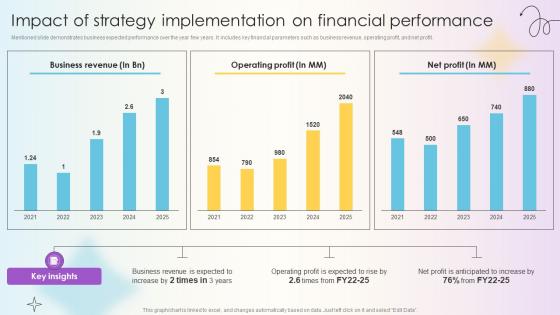
Managing Technical And Non Impact Of Strategy Implementation On Financial
Mentioned slide demonstrates business expected performance over the year few years. It includes key financial parameters such as business revenue, operating profit, and net profit. Slidegeeks has constructed Managing Technical And Non Impact Of Strategy Implementation On Financial after conducting extensive research and examination. These presentation templates are constantly being generated and modified based on user preferences and critiques from editors. Here, you will find the most attractive templates for a range of purposes while taking into account ratings and remarks from users regarding the content. This is an excellent jumping-off point to explore our content and will give new users an insight into our top-notch PowerPoint Templates. Mentioned slide demonstrates business expected performance over the year few years. It includes key financial parameters such as business revenue, operating profit, and net profit.
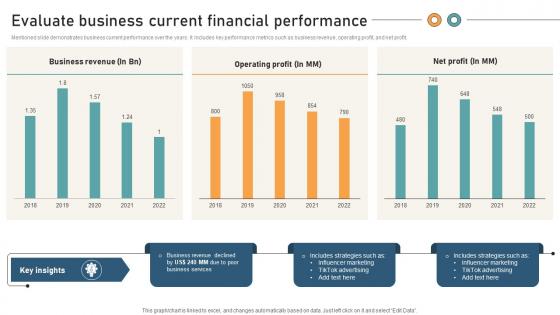
Comprehensive Guide For Website Evaluate Business Current Financial Performance
Mentioned slide demonstrates business current performance over the years. It includes key performance metrics such as business revenue, operating profit, and net profit. This Comprehensive Guide For Website Evaluate Business Current Financial Performance from Slidegeeks makes it easy to present information on your topic with precision. It provides customization options, so you can make changes to the colors, design, graphics, or any other component to create a unique layout. It is also available for immediate download, so you can begin using it right away. Slidegeeks has done good research to ensure that you have everything you need to make your presentation stand out. Make a name out there for a brilliant performance. Mentioned slide demonstrates business current performance over the years. It includes key performance metrics such as business revenue, operating profit, and net profit.
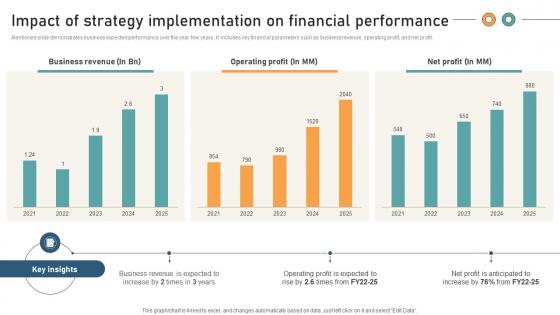
Comprehensive Guide For Website Impact Of Strategy Implementation On Financial
Mentioned slide demonstrates business expected performance over the year few years. It includes key financial parameters such as business revenue, operating profit, and net profit. Boost your pitch with our creative Comprehensive Guide For Website Impact Of Strategy Implementation On Financial. Deliver an awe-inspiring pitch that will mesmerize everyone. Using these presentation templates you will surely catch everyones attention. You can browse the ppts collection on our website. We have researchers who are experts at creating the right content for the templates. So you do not have to invest time in any additional work. Just grab the template now and use them. Mentioned slide demonstrates business expected performance over the year few years. It includes key financial parameters such as business revenue, operating profit, and net profit.
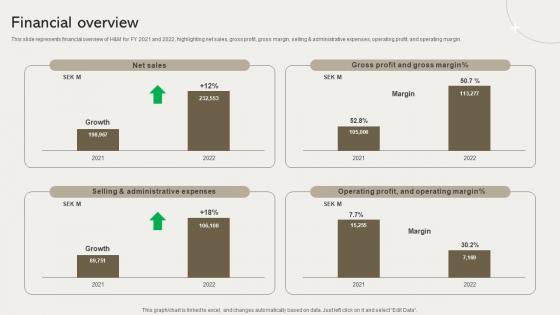
Financial Overview Clothing Retailer Company Profile CP SS V
This slide represents financial overview of HandM for FY 2021 and 2022, highlighting net sales, gross profit, gross margin, selling and administrative expenses, operating profit, and operating margin. Do you have an important presentation coming up Are you looking for something that will make your presentation stand out from the rest Look no further than Financial Overview Clothing Retailer Company Profile CP SS V. With our professional designs, you can trust that your presentation will pop and make delivering it a smooth process. And with Slidegeeks, you can trust that your presentation will be unique and memorable. So why wait Grab Financial Overview Clothing Retailer Company Profile CP SS V today and make your presentation stand out from the rest This slide represents financial overview of HandM for FY 2021 and 2022, highlighting net sales, gross profit, gross margin, selling and administrative expenses, operating profit, and operating margin.
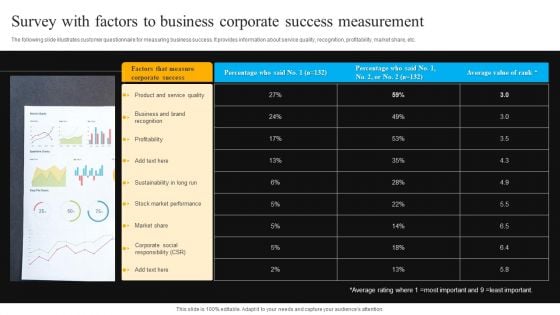
Survey With Factors To Business Corporate Success Measurement Themes PDF
The following slide illustrates customer questionnaire for measuring business success. It provides information about service quality, recognition, profitability, market share, etc. Pitch your topic with ease and precision using this Survey With Factors To Business Corporate Success Measurement Themes PDF. This layout presents information on Business And Brand, Profitability, Stock Market Performance. It is also available for immediate download and adjustment. So, changes can be made in the color, design, graphics or any other component to create a unique layout.
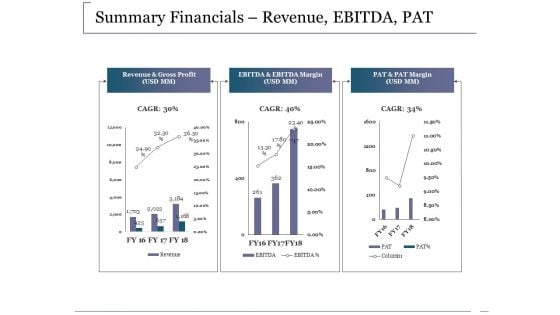
Summary Financials Revenue Ebitda Pat Ppt PowerPoint Presentation Outline Infographics
This is a summary financials revenue ebitda pat ppt powerpoint presentation outline infographics. This is a three stage process. The stages in this process are revenue and gross profit, ebitda and ebitda margin, pat and pat margin, business, marketing.
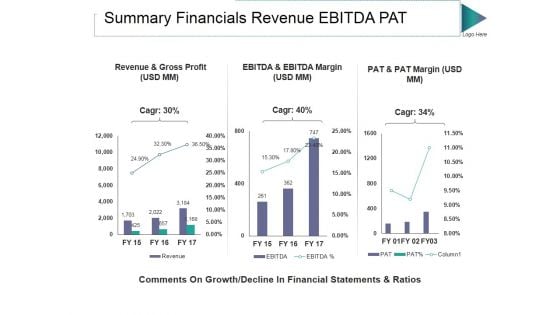
Summary Financials Revenue Ebitda Pat Ppt PowerPoint Presentation Visuals
This is a summary financials revenue ebitda pat ppt powerpoint presentation visuals. This is a three stage process. The stages in this process are revenue and gross profit, pat and pat margin, ebitda and ebitda margin.
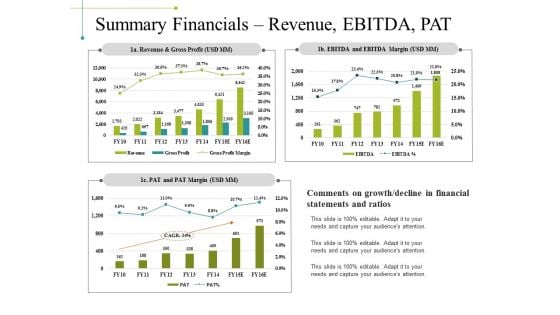
Summary Financials Revenue Ebitda Pat Ppt PowerPoint Presentation Inspiration Templates
This is a summary financials revenue ebitda pat ppt powerpoint presentation inspiration templates. This is a three stage process. The stages in this process are revenue and gross profit, pat and pat margin, ebitda and ebitda margin, business, marketing.
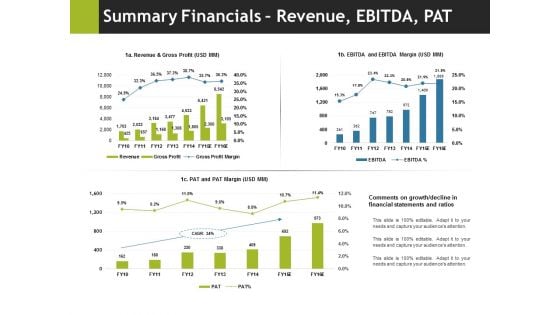
Summary Financials Revenue Ebitda Pat Ppt PowerPoint Presentation Pictures Outline
This is a summary financials revenue ebitda pat ppt powerpoint presentation pictures outline. This is a three stage process. The stages in this process are business, marketing, pat and pat margin, ebitda and ebitda margin, revenue and gross profit.
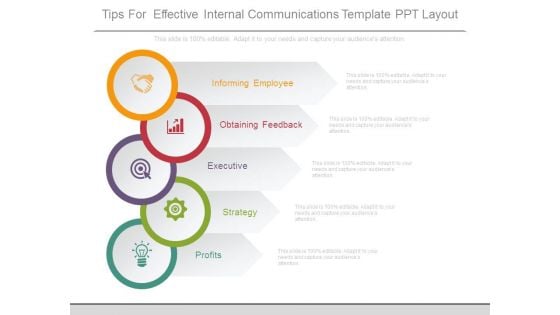
Tips For Effective Internal Communications Template Ppt Layout
This is a tips for effective internal communications template ppt layout. This is a five stage process. The stages in this process are informing employee, obtaining feedback, executive, strategy, profits.
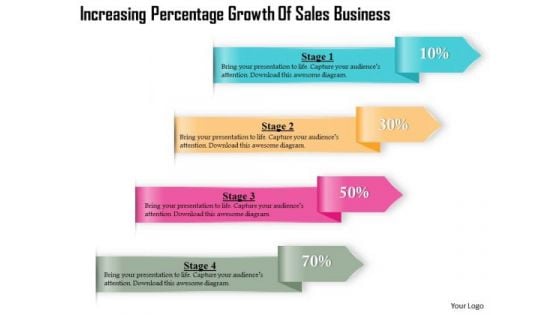
Consulting Slides Increasing Percentage Growth Of Sales Business Presentation
This diagram is designed with graphics of text boxes showing percentage growth. Use this diagram in presentations to display growth in sales or profit. This diagram is editable and can be easily adjusted.
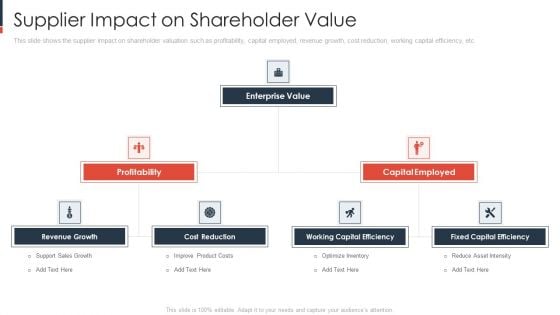
Supplier Impact On Shareholder Value Elements PDF
This slide shows the supplier impact on shareholder valuation such as profitability, capital employed, revenue growth, cost reduction, working capital efficiency, etc.Presenting supplier impact on shareholder value elements pdf to provide visual cues and insights. Share and navigate important information on two stages that need your due attention. This template can be used to pitch topics like revenue growth, profitability, capital employed. In addtion, this PPT design contains high resolution images, graphics, etc, that are easily editable and available for immediate download.
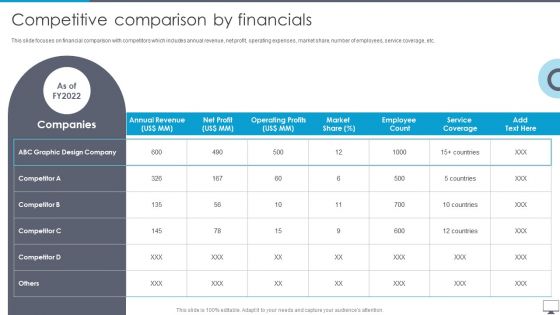
Graphic Designing And Visual Arts Company Profile Competitive Comparison By Financials Themes PDF
This slide focuses on financial comparison with competitors which includes annual revenue, net profit, operating expenses, market share, number of employees, service coverage, etc. Deliver an awe inspiring pitch with this creative Graphic Designing And Visual Arts Company Profile Competitive Comparison By Financials Themes PDF bundle. Topics like Annual Revenue, Operating Profits, Service Coverage can be discussed with this completely editable template. It is available for immediate download depending on the needs and requirements of the user.
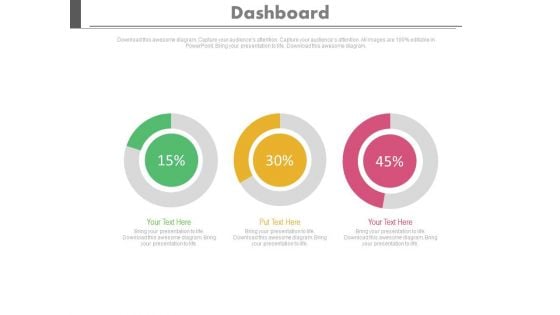
Three Dashboard With Percentage Value Growth Powerpoint Slides
This PowerPoint template has been designed with three dashboards. Use this PPT slide to depict rise in business profit. This professional diagram slide will help you express your views to target audience.
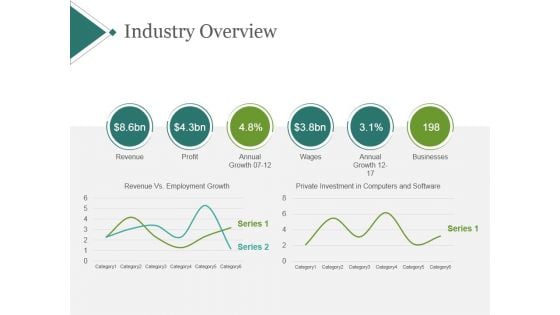
Industry Overview Template 1 Ppt PowerPoint Presentation Deck
This is a industry overview template 1 ppt powerpoint presentation deck. This is a six stage process. The stages in this process are revenue, profit, annual growth, wages, annual growth, businesses.

Current State Analysis Financial Comparison Ppt Powerpoint Presentation File Graphic Tips
This is a current state analysis financial comparison ppt powerpoint presentation file graphic tips. This is a five stage process. The stages in this process are revenue, profits, cash balance.
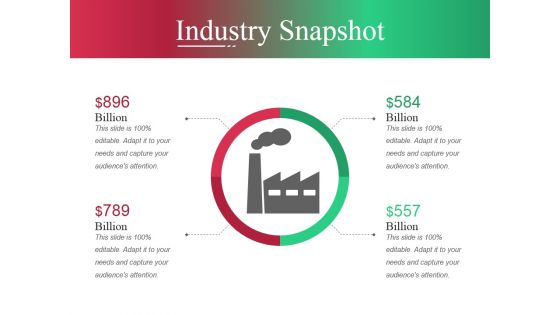
Industry Snapshot Template Ppt PowerPoint Presentation Slides Shapes
This is a industry snapshot template ppt powerpoint presentation slides shapes. This is a two stage process. The stages in this process are revenue, profit, annual growth, wages, annual growth, business.
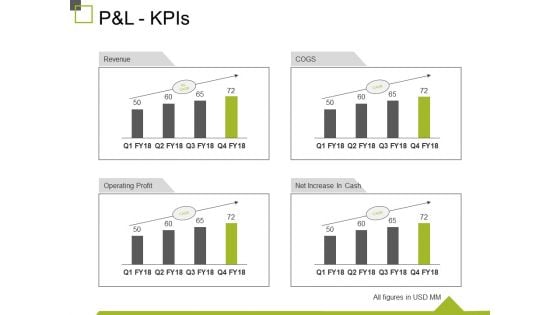
P And L Kpis Ppt PowerPoint Presentation Show Design Inspiration
This is a p and l kpis ppt powerpoint presentation show design inspiration. This is a four stage process. The stages in this process are revenue, operating profit, cogs, net increase in cash, business.
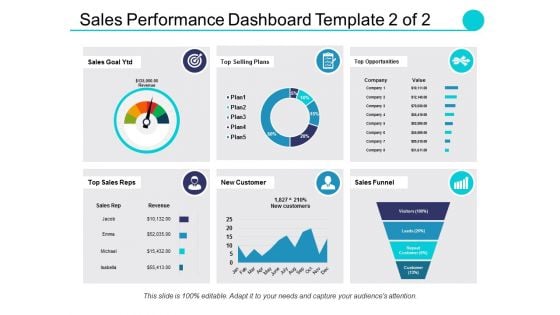
Sales Performance Dashboard Template Ppt PowerPoint Presentation Professional Elements
This is a sales performance dashboard template ppt powerpoint presentation professional elements. This is a eight stage process. The stages in this process are sales comparison, sales by product category, sales by month, brand profitability, revenue.

Weekly Sales Performance KPI Dashboard For Revenue Generation Brochure PDF
The following slide exhibits dashboard to maintain revenue and management under control. It presents information related to profits, cross selling, costs, etc. Pitch your topic with ease and precision using this Weekly Sales Performance KPI Dashboard For Revenue Generation Brochure PDF. This layout presents information on Total Sales, Revenue, Profit, Cost. It is also available for immediate download and adjustment. So, changes can be made in the color, design, graphics or any other component to create a unique layout.
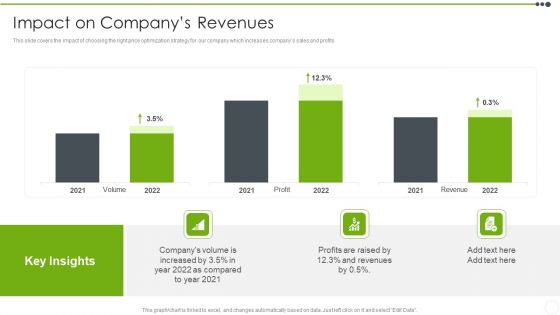
Estimating The Price Impact On Companys Revenues Infographics PDF
This slide covers the impact of choosing the right price optimization strategy for our company which increases companys sales and profits. Deliver an awe inspiring pitch with this creative Estimating The Price Impact On Companys Revenues Infographics PDF bundle. Topics like Profits, Revenues can be discussed with this completely editable template. It is available for immediate download depending on the needs and requirements of the user.

Monthly Financial Metrics Dashboard With Revenue And Expenditure Rules PDF
This slide showcases KPI dashboard for monitoring financial health of business to ensure smooth flow of business operations. It includes details such as COGS, net profit, cost breakdown, etc. Showcasing this set of slides titled Monthly Financial Metrics Dashboard With Revenue And Expenditure Rules PDF. The topics addressed in these templates are Net Profit, Costs, Expenditure. All the content presented in this PPT design is completely editable. Download it and make adjustments in color, background, font etc. as per your unique business setting.

Increase In Prizes Real Estate PowerPoint Templates And PowerPoint Themes 0912
Increase In Prizes Real Estate PowerPoint Templates And PowerPoint Themes Presentations-Microsoft Powerpoint Templates and Background with coins showing increasing profits-Increase In Prizes Real Estate PowerPoint Templates And PowerPoint Themes PresentationsThis PPT can be used for presentations relating to-Coins showing increasing profits, real estate, money, finance, business, marketing Many factors can create a distraction. Our Increase In Prizes Real Estate PowerPoint Templates And PowerPoint Themes 0912 will not let them fall for it.
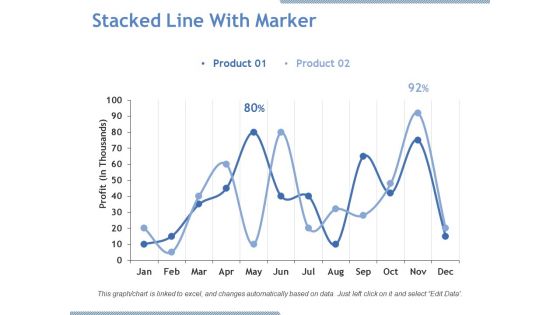
Stacked Line With Marker Ppt PowerPoint Presentation Pictures Graphics Download
This is a stacked line with marker ppt powerpoint presentation pictures graphics download. This is a two stage process. The stages in this process are product, profit, line chart, business, growth.

Competitive Sales Strategy Development Plan For Revenue Growth Metrics To Measure Sales Sample PDF
This slide focuses on metrics to measure sales team performance that covers total sales, revenue, profit, cost, incremental sales, accumulated revenue, cost breakdown, etc. Deliver and pitch your topic in the best possible manner with this Competitive Sales Strategy Development Plan For Revenue Growth Metrics To Measure Sales Sample PDF. Use them to share invaluable insights on Sales Revenue, Profit, Cost and impress your audience. This template can be altered and modified as per your expectations. So, grab it now.
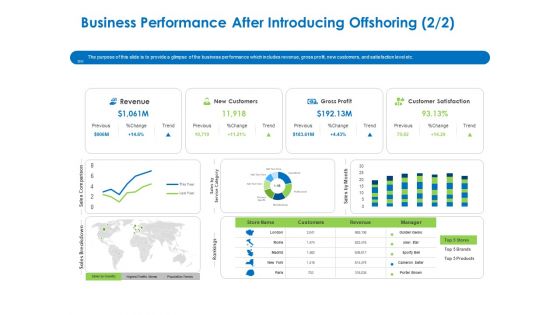
Relocation Of Business Process Offshoring Business Performance After Introducing Offshoring Revenue Download PDF
The purpose of this slide is to provide a glimpse of the business performance which includes revenue, gross profit, new customers, and satisfaction level etc. Deliver an awe-inspiring pitch with this creative relocation of business process offshoring business performance after introducing offshoring revenue download pdf bundle. Topics like revenue, new customers, gross profit, customer satisfaction can be discussed with this completely editable template. It is available for immediate download depending on the needs and requirements of the user.
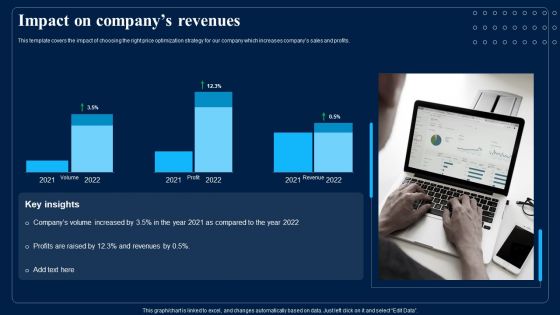
Identifying Optimum Pricing Methods For Business Impact On Companys Revenues Introduction PDF
This template covers the impact of choosing the right price optimization strategy for our company which increases companys sales and profits. Deliver an awe inspiring pitch with this creative Identifying Optimum Pricing Methods For Business Impact On Companys Revenues Introduction PDF bundle. Topics like Profits, Revenues can be discussed with this completely editable template. It is available for immediate download depending on the needs and requirements of the user.
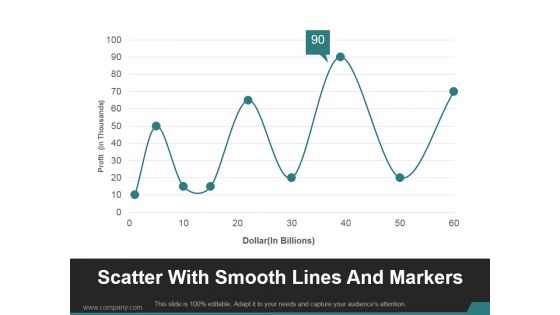
Scatter With Smooth Lines And Markers Ppt PowerPoint Presentation Show
This is a scatter with smooth lines and markers ppt powerpoint presentation show. This is a nine stage process. The stages in this process are business, marketing, line chart, profit, management.
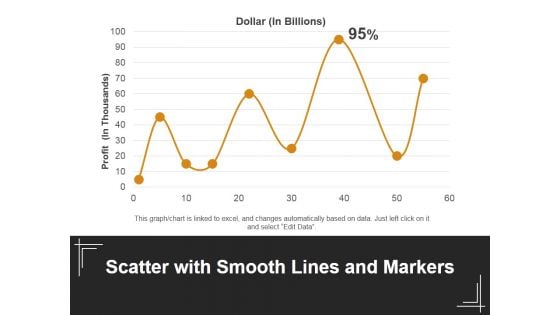
Scatter With Smooth Lines And Markers Ppt PowerPoint Presentation Outline Design Ideas
This is a scatter with smooth lines and markers ppt powerpoint presentation outline design ideas. This is a one stage process. The stages in this process are dollar, profit, line chart, business, marketing.
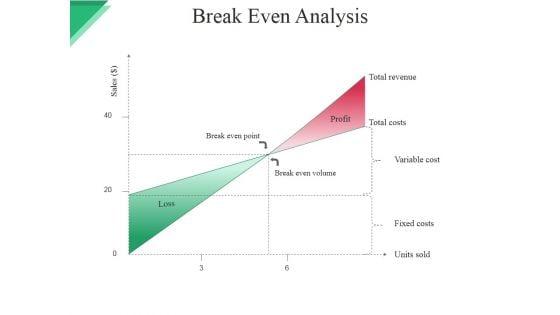
Break Even Analysis Ppt PowerPoint Presentation Styles Samples
This is a break even analysis ppt powerpoint presentation styles samples. This is a two stage process. The stages in this process are break even point, break even volume, profit, total revenue, total costs, variable cost.

 Home
Home