Program Management Dashboard
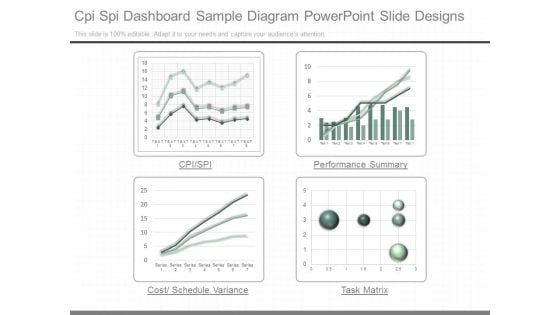
Cpi Spi Dashboard Sample Diagram Powerpoint Slide Designs
This is a cpi spi dashboard sample diagram powerpoint slide designs. This is a four stage process. The stages in this process are cpi spi, performance summary, cost schedule variance, task matrix.
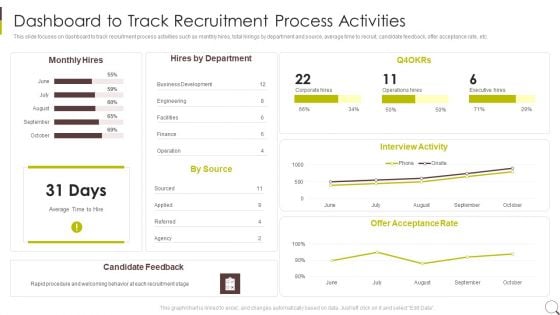
Dashboard To Track Recruitment Process Activities Brochure PDF
This slide focuses on dashboard to track recruitment process activities such as monthly hires, total hirings by department and source, average time to recruit, candidate feedback, offer acceptance rate, etc.Deliver and pitch your topic in the best possible manner with this Dashboard To Track Recruitment Process Activities Brochure PDF. Use them to share invaluable insights on Business Development, Engineering, Interview Activity and impress your audience. This template can be altered and modified as per your expectations. So, grab it now.
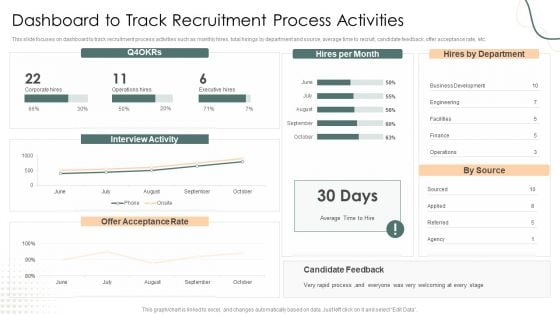
Dashboard To Track Recruitment Process Activities Download PDF
This slide focuses on dashboard to track recruitment process activities such as monthly hires, total hirings by department and source, average time to recruit, candidate feedback, offer acceptance rate, etc.Deliver an awe inspiring pitch with this creative Dashboard To Track Recruitment Process Activities Download PDF bundle. Topics like Interview Activity, Acceptance Rate, Candidate can be discussed with this completely editable template. It is available for immediate download depending on the needs and requirements of the user.
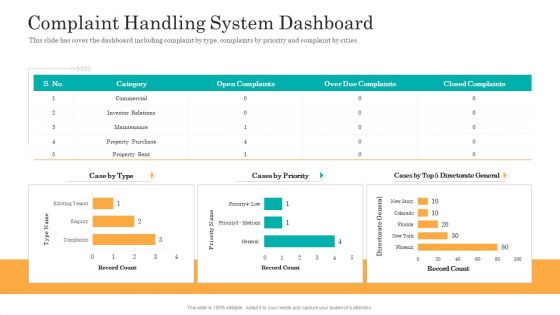
Consumer Complaint Handling Process Complaint Handling System Dashboard Slides PDF
This slide has cover the dashboard including complaint by type, complaints by priority and complaint by cities. Deliver an awe-inspiring pitch with this creative consumer complaint handling process complaint handling system dashboard slides pdf bundle. Topics like commercial, investor relations, maintenance, property purchase, property rent can be discussed with this completely editable template. It is available for immediate download depending on the needs and requirements of the user.
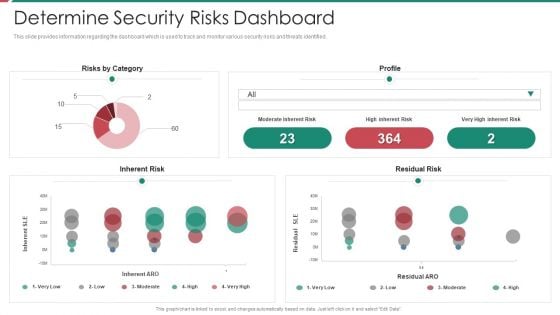
Security And Process Integration Determine Security Risks Dashboard Rules PDF
This slide provides information regarding the dashboard which is used to track and monitor various security risks and threats identified. Deliver and pitch your topic in the best possible manner with this security and process integration determine security risks dashboard rules pdf. Use them to share invaluable insights on moderate inherent risk, high inherent risk, very high inherent risk and impress your audience. This template can be altered and modified as per your expectations. So, grab it now.
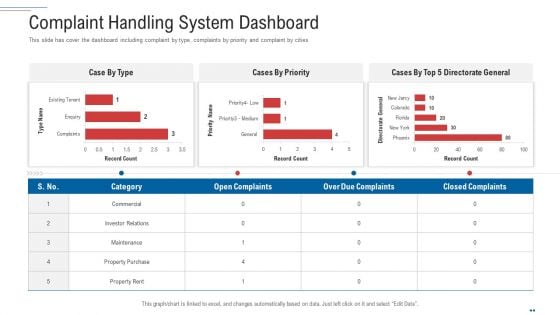
Customer Complaint Handling Process Complaint Handling System Dashboard Graphics PDF
This slide has cover the dashboard including complaint by type, complaints by priority and complaint by cities. Deliver an awe inspiring pitch with this creative customer complaint handling process complaint handling system dashboard graphics pdf bundle. Topics like commercial, investor relations, maintenance, property purchase can be discussed with this completely editable template. It is available for immediate download depending on the needs and requirements of the user.
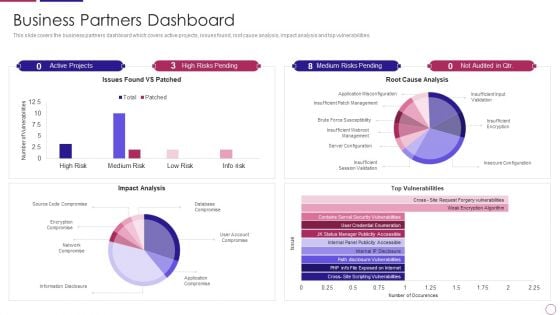
PRM To Streamline Business Processes Business Partners Dashboard Introduction PDF
This slide covers the business partners dashboard which covers active projects, issues found, root cause analysis, impact analysis and top vulnerabilities. Deliver and pitch your topic in the best possible manner with this prm to streamline business processes business partners dashboard introduction pdf. Use them to share invaluable insights on impact analysis, top vulnerabilities, server configuration, network compromise, issues found vs patched and impress your audience. This template can be altered and modified as per your expectations. So, grab it now.
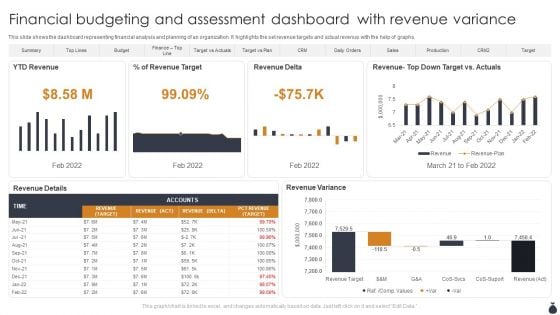
Financial Budgeting And Assessment Dashboard With Revenue Variance Designs PDF
This slide shows the dashboard representing financial analysis and planning of an organization. It highlights the set revenue targets and actual revenue with the help of graphs. Showcasing this set of slides titled Financial Budgeting And Assessment Dashboard With Revenue Variance Designs PDF. The topics addressed in these templates are YTD Revenue, Revenue Delta, Revenue Variance. All the content presented in this PPT design is completely editable. Download it and make adjustments in color, background, font etc. as per your unique business setting.
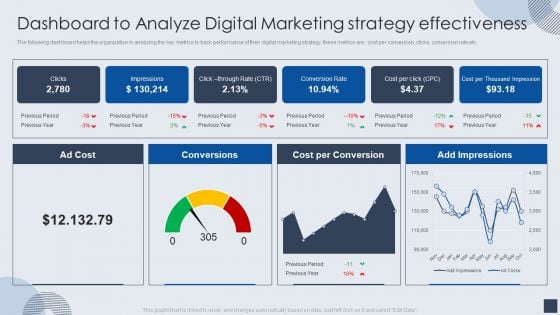
Dashboard To Analyze Digital Marketing Strategy Effectiveness Mockup PDF
The following dashboard helps the organization in analyzing the key metrics to track performance of their digital marketing strategy, these metrics are cost per conversion, clicks, conversion rate etc. Deliver an awe inspiring pitch with this creative Dashboard To Analyze Digital Marketing Strategy Effectiveness Mockup PDF bundle. Topics like Cost Per Conversion, Conversion Rate can be discussed with this completely editable template. It is available for immediate download depending on the needs and requirements of the user.
Hyperautomation Performance Tracking Dashboard Hyperautomation Software Solutions IT Summary PDF
This slide depicts the performance tracking dashboard for hyper-automation, covering the number of rules triggered, automated emails, average originator, recipient, average click-through rate for automated emails, and quick links.Formulating a presentation can take up a lot of effort and time, so the content and message should always be the primary focus. The visuals of the PowerPoint can enhance the presenters message, so our Hyperautomation Performance Tracking Dashboard Hyperautomation Software Solutions IT Summary PDF was created to help save time. Instead of worrying about the design, the presenter can concentrate on the message while our designers work on creating the ideal templates for whatever situation is needed. Slidegeeks has experts for everything from amazing designs to valuable content, we have put everything into Hyperautomation Performance Tracking Dashboard Hyperautomation Software Solutions IT Summary PDF.
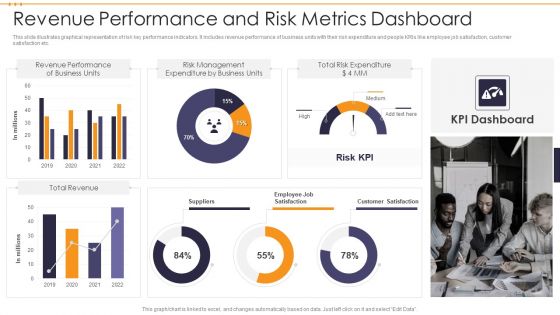
Revenue Performance And Risk Metrics Dashboard Demonstration PDF
This slide illustrates graphical representation of risk key performance indicators. It includes revenue performance of business units with their risk expenditure and people KRIs like employee job satisfaction, customer satisfaction etc. Showcasing this set of slides titled Revenue Performance And Risk Metrics Dashboard Demonstration PDF. The topics addressed in these templates are Total Risk Expenditure, Risk Management, Revenue Performance . All the content presented in this PPT design is completely editable. Download it and make adjustments in color, background, font etc. as per your unique business setting.
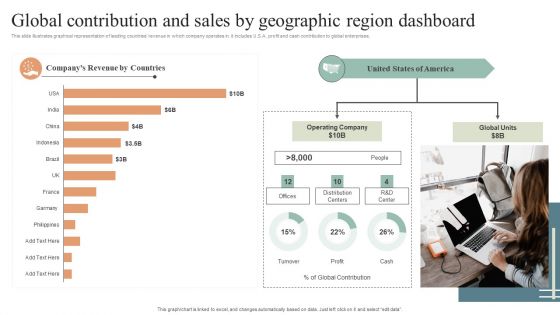
Global Contribution And Sales By Geographic Region Dashboard Diagrams PDF
This slide illustrates graphical representation of leading countries revenue in which company operates in. it includes U.S.A. profit and cash contribution to global enterprises. Pitch your topic with ease and precision using this Global Contribution And Sales By Geographic Region Dashboard Diagrams PDF. This layout presents information on Global Contribution, Sales By Geographic, Region Dashboard. It is also available for immediate download and adjustment. So, changes can be made in the color, design, graphics or any other component to create a unique layout.
Workplace Wellness Employee Health Fitness Dashboard Icon Professional PDF
This slide covers the dashboard wherein we have covered employee health and fitness progress after consultation services offered by our company. Deliver an awe inspiring pitch with this creative workplace wellness employee health fitness dashboard icon professional pdf bundle. Topics like aggregate recommendations, fitness score can be discussed with this completely editable template. It is available for immediate download depending on the needs and requirements of the user.
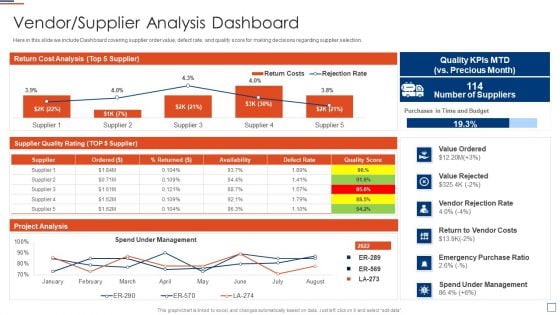
Risk Evaluation And Mitigation Vendor Supplier Analysis Dashboard Clipart PDF
Here in this slide we include Dashboard covering supplier order value, defect rate, and quality score for making decisions regarding supplier selection. Deliver an awe inspiring pitch with this creative Risk Evaluation And Mitigation Vendor Supplier Analysis Dashboard Clipart PDF bundle. Topics like Cost Analysis, Project Analysis, Supplier Quality can be discussed with this completely editable template. It is available for immediate download depending on the needs and requirements of the user.
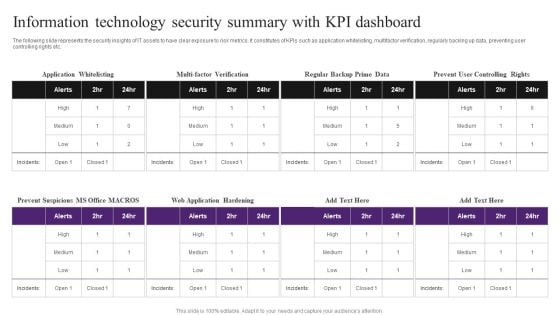
Information Technology Security Summary With KPI Dashboard Inspiration PDF
The following slide represents the security insights of IT assets to have clear exposure to risk metrics. It constitutes of KPIs such as application whitelisting, multifactor verification, regularly backing up data, preventing user controlling rights etc. Pitch your topic with ease and precision using this Information Technology Security Summary With KPI Dashboard Inspiration PDF. This layout presents information on Information Technology Security, Summary With KPI Dashboard. It is also available for immediate download and adjustment. So, changes can be made in the color, design, graphics or any other component to create a unique layout.
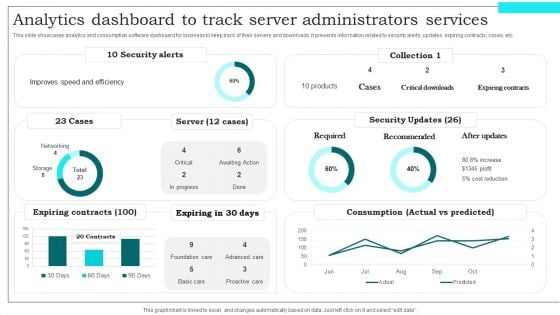
Analytics Dashboard To Track Server Administrators Services Demonstration PDF
This slide showcases analytics and consumption software dashboard for business to keep track of their servers and downloads. It presents information related to security alerts, updates, expiring contracts, cases, etc. Showcasing this set of slides titled Analytics Dashboard To Track Server Administrators Services Demonstration PDF. The topics addressed in these templates are Expiring Contracts, Security Updates, Required. All the content presented in this PPT design is completely editable. Download it and make adjustments in color, background, font etc. as per your unique business setting.
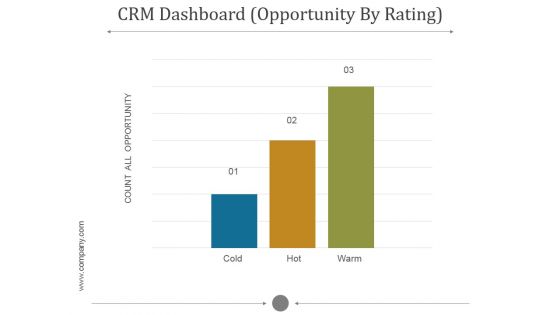
Crm Dashboard Opportunity By Rating Ppt PowerPoint Presentation Template
This is a crm dashboard opportunity by rating ppt powerpoint presentation template. This is a five stage process. The stages in this process are count all opportunity, cold, hot, warm.
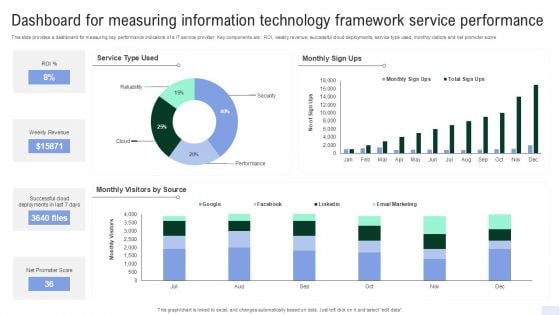
Dashboard For Measuring Information Technology Framework Service Performance Ideas PDF
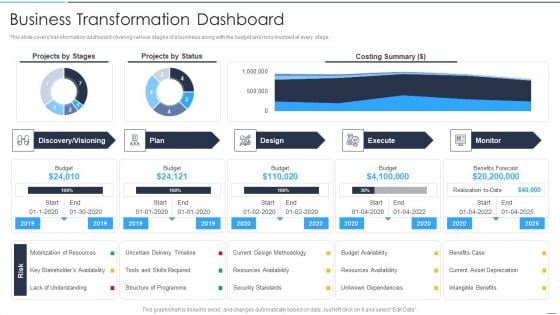
Accelerate Online Journey Now Business Transformation Dashboard Background PDF
This slide covers transformation dashboard covering various stages of a business along with the budget and risks involved at every stage.Deliver and pitch your topic in the best possible manner with this Accelerate Online Journey Now Business Transformation Dashboard Background PDF Use them to share invaluable insights on Mobilization Resources, Stakeholders Availability, Uncertain Timeline and impress your audience. This template can be altered and modified as per your expectations. So, grab it now.
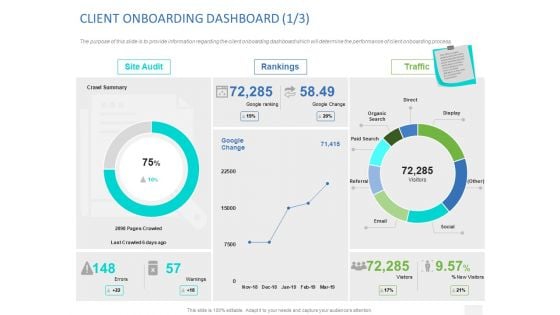
Organizational Socialization CLIENT ONBOARDING DASHBOARD Traffic Ppt Model Sample PDF
The purpose of this slide is to provide information regarding the client onboarding dashboard which will determine the performance of client onboarding process. Deliver and pitch your topic in the best possible manner with this organizational socialization client onboarding dashboard traffic ppt model sample pdf. use them to share invaluable insights on site audit, rankings, traffic,organic search, direct. and impress your audience. this template can be altered and modified as per your expectations. so, grab it now.
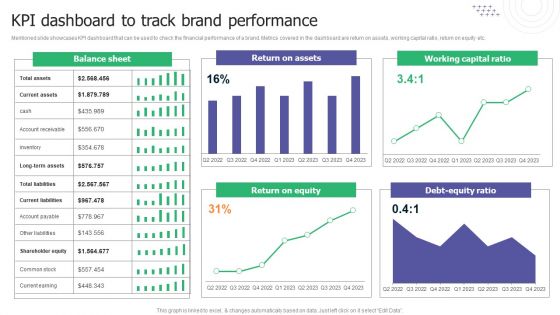
KPI Dashboard To Track Brand Performance Ppt Ideas Pictures PDF
Mentioned slide showcases KPI dashboard that can be used to check the financial performance of a brand. Metrics covered in the dashboard are return on assets, working capital ratio, return on equity etc. Formulating a presentation can take up a lot of effort and time, so the content and message should always be the primary focus. The visuals of the PowerPoint can enhance the presenters message, so our KPI Dashboard To Track Brand Performance Ppt Ideas Pictures PDF was created to help save time. Instead of worrying about the design, the presenter can concentrate on the message while our designers work on creating the ideal templates for whatever situation is needed. Slidegeeks has experts for everything from amazing designs to valuable content, we have put everything into KPI Dashboard To Track Brand Performance Ppt Ideas Pictures PDF.

Comprehensive Business Digitization Deck Business Transformation Dashboard Sample PDF
This slide covers transformation dashboard covering various stages of a business along with the budget and risks involved at every stage. Deliver and pitch your topic in the best possible manner with this comprehensive business digitization deck business transformation dashboard sample pdf. Use them to share invaluable insights on discovery or visioning, plan, design, execute, monitor and impress your audience. This template can be altered and modified as per your expectations. So, grab it now.
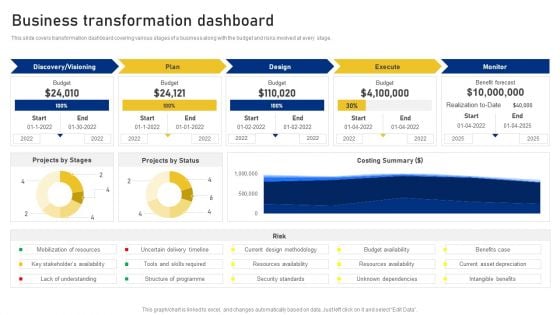
Reshaping Business In Digital Business Transformation Dashboard Formats PDF
This slide covers transformation dashboard covering various stages of a business along with the budget and risks involved at every stage. Deliver an awe inspiring pitch with this creative Reshaping Business In Digital Business Transformation Dashboard Formats PDF bundle. Topics like Plan, Design, Execute, Monitor can be discussed with this completely editable template. It is available for immediate download depending on the needs and requirements of the user.

KPI Dashboard To Track Amazon Performance Ppt Styles Guidelines PDF
This slide provides information regarding dashboard to monitor Amazon performance. The KPIs include tracking of product sales, conversion rate, advertising spends, session, organic sales, etc. There are so many reasons you need a KPI Dashboard To Track Amazon Performance Ppt Styles Guidelines PDF. The first reason is you can not spend time making everything from scratch, Thus, Slidegeeks has made presentation templates for you too. You can easily download these templates from our website easily.
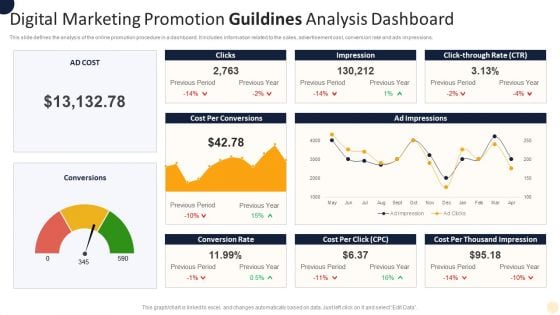
Digital Marketing Promotion Guildines Analysis Dashboard Rules PDF
This slide defines the analysis of the online promotion procedure in a dashboard. It includes information related to the sales, advertisement cost, conversion rate and ads impressions. Showcasing this set of slides titled Digital Marketing Promotion Guildines Analysis Dashboard Rules PDF. The topics addressed in these templates are Impression, Conversion Rate, Thousand Impression. All the content presented in this PPT design is completely editable. Download it and make adjustments in color, background, font etc. as per your unique business setting.
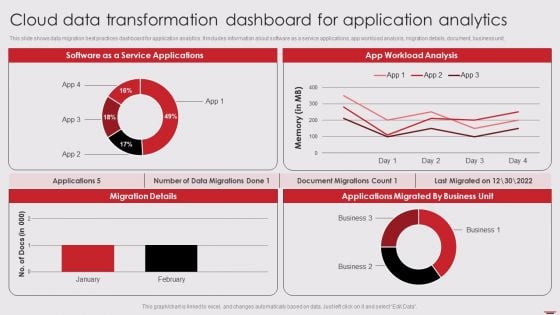
Cloud Data Transformation Dashboard For Application Analytics Information PDF
This slide shows data migration best practices dashboard for application analytics. It includes information about software as a service applications, app workload analysis, migration details, document, business unit. Pitch your topic with ease and precision using this Cloud Data Transformation Dashboard For Application Analytics Information PDF. This layout presents information on Software Service Applications, App Workload Analysis, Migration Details. It is also available for immediate download and adjustment. So, changes can be made in the color, design, graphics or any other component to create a unique layout.
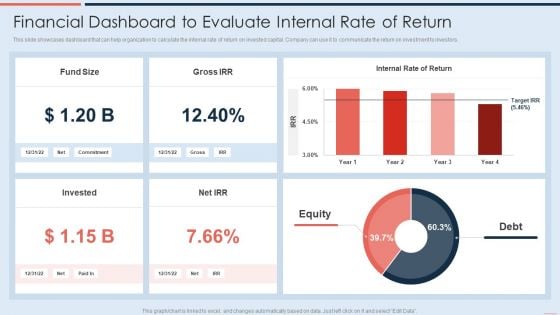
Financial Dashboard To Evaluate Internal Rate Of Return Microsoft PDF
This slide showcases dashboard that can help organization to calculate the internal rate of return on invested capital. Company can use it to communicate the return on investment to investors. Deliver an awe inspiring pitch with this creative Financial Dashboard To Evaluate Internal Rate Of Return Microsoft PDF bundle. Topics like Invested, Equity, Debt can be discussed with this completely editable template. It is available for immediate download depending on the needs and requirements of the user.
SEO Tracking Dashboard For Backlinks And Keywords Inspiration PDF
Purpose of the following slide is to measure the SEO performance of the organization as it measures the keywords, backlinks, the total number of sessions and average call duration. Deliver and pitch your topic in the best possible manner with this SEO Tracking Dashboard For Backlinks And Keywords Inspiration PDF. Use them to share invaluable insights on Seo Tracking Dashboard, Backlinks And Keywords and impress your audience. This template can be altered and modified as per your expectations. So, grab it now.
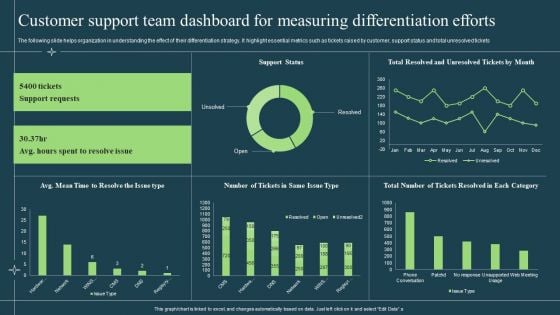
Customer Support Team Dashboard For Measuring Differentiation Efforts Formats PDF
The following slide helps organization in understanding the effect of their differentiation strategy. It highlight essential metrics such as tickets raised by customer, support status and total unresolved tickets. Deliver an awe inspiring pitch with this creative Customer Support Team Dashboard For Measuring Differentiation Efforts Formats PDF bundle. Topics like Customer Support Team Dashboard, Measuring Differentiation Efforts can be discussed with this completely editable template. It is available for immediate download depending on the needs and requirements of the user.
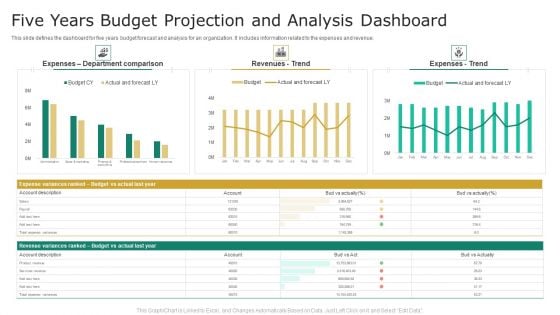
Five Years Budget Projection And Analysis Dashboard Graphics PDF
This slide defines the dashboard for five years budget forecast and analysis for an organization. It includes information related to the expenses and revenue. Showcasing this set of slides titled Five Years Budget Projection And Analysis Dashboard Graphics PDF. The topics addressed in these templates are Revenues, Expenses, Budget. All the content presented in this PPT design is completely editable. Download it and make adjustments in color, background, font etc. as per your unique business setting.

Team Mentoring Dashboard With Client And Training Details Sample PDF
This slide covers all the information related to the clients to whom coaching has been provided and in certain number of hours how many sessions they attended. It also includes the total earnings , coaching hours and the name of top clients.Pitch your topic with ease and precision using this Team Mentoring Dashboard With Client And Training Details Sample PDF This layout presents information on Team Mentoring Dashboard With Client And Training Details It is also available for immediate download and adjustment. So, changes can be made in the color, design, graphics or any other component to create a unique layout.
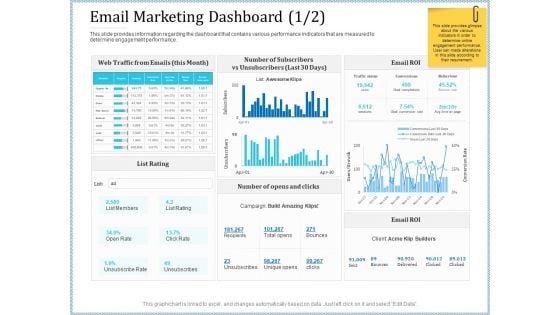
Leveraged Client Engagement Email Marketing Dashboard Click Professional PDF
This slide provides information regarding the dashboard that contains various performance indicators that are measured to determine engagement performance. Deliver and pitch your topic in the best possible manner with this leveraged client engagement email marketing dashboard click professional pdf. Use them to share invaluable insights on campaign, traffic status, social, organic, paid search and impress your audience. This template can be altered and modified as per your expectations. So, grab it now.
Distributed Computing Dashboard For Edge Computing Tracking Brochure PDF
This slide depicts the edge computing dashboard to monitor the security of networks and devices in the organization by covering threat prevention and detection details.Deliver and pitch your topic in the best possible manner with this Distributed Computing Dashboard For Edge Computing Tracking Brochure PDF Use them to share invaluable insights on Device Recommendation, Most Prevalent, Device Recommendation and impress your audience. This template can be altered and modified as per your expectations. So, grab it now.
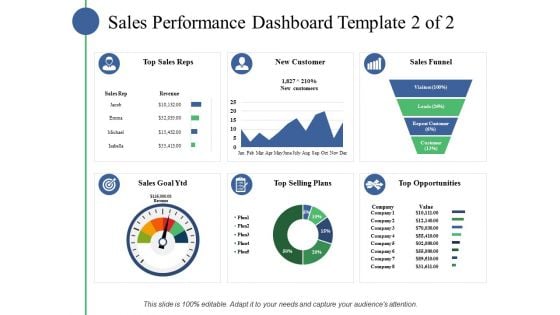
Sales Performance Dashboard Template Ppt PowerPoint Presentation Slides Example File
This is a sales performance dashboard template ppt powerpoint presentation slides example file. This is a eight stage process. The stages in this process are business, marketing, strategy, finance, planning.
Sales Performance Dashboard Ppt PowerPoint Presentation Professional Icons
This is a sales performance dashboard template ppt powerpoint presentation slides example file. This is a six stage process. The stages in this process are business, marketing, strategy, finance, planning.
Employee Engagement Dashboard Ppt PowerPoint Presentation Icon Shapes
This is a employee engagement dashboard ppt powerpoint presentation icon shapes. This is a four stage process. The stages in this process are personal growth, technical skills, marketing, planning, strategy.
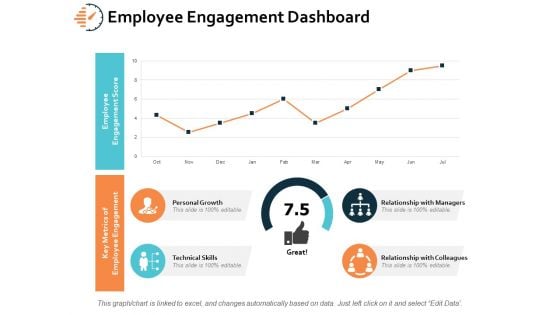
Employee Engagement Dashboard Ppt PowerPoint Presentation Layouts Inspiration
This is a employee engagement dashboard ppt powerpoint presentation layouts inspiration. This is a four stage process. The stages in this process are personal growth, technical skills, marketing, planning, strategy.
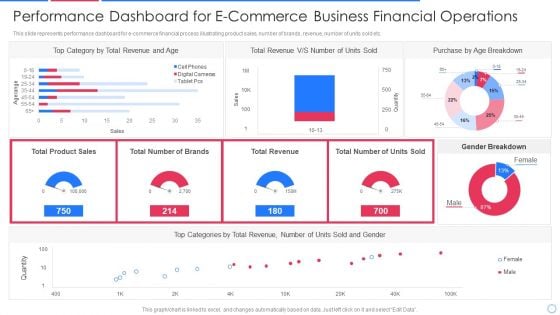
Performance Dashboard For E Commerce Business Financial Operations Infographics PDF
This slide represents performance dashboard for e-commerce financial process illustrating product sales, number of brands, revenue, number of units sold etc.Pitch your topic with ease and precision using this performance dashboard for e commerce business financial operations infographics pdf This layout presents information on category by total revenue, total revenue, purchase by age breakdown It is also available for immediate download and adjustment. So, changes can be made in the color, design, graphics or any other component to create a unique layout.
Sales Product Performance Dashboard Ppt PowerPoint Presentation Summary Icon
This is a sales product performance dashboard ppt powerpoint presentation infographics samples. This is a four stage process. The stages in this process are top products in revenue, incremental sales campaign, sales product performance, cost of goods sold.
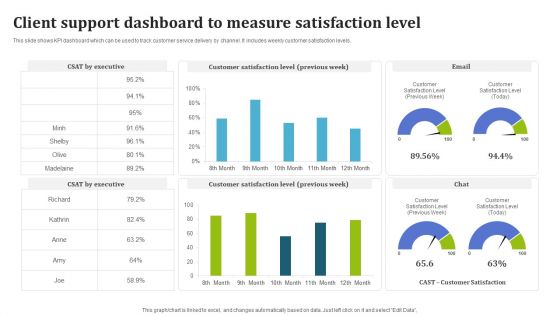
Client Support Dashboard To Measure Satisfaction Level Structure PDF
This slide shows KPI dashboard which can be used to track customer service delivery by channel. It includes weekly customer satisfaction levels. Showcasing this set of slides titled Client Support Dashboard To Measure Satisfaction Level Structure PDF. The topics addressed in these templates are Executive, Customer Satisfaction Level, Email. All the content presented in this PPT design is completely editable. Download it and make adjustments in color, background, font etc. as per your unique business setting.
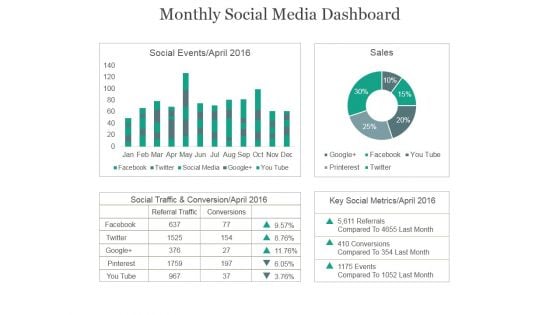
Monthly Social Media Dashboard Ppt PowerPoint Presentation Example 2015
This is a monthly social media dashboard ppt powerpoint presentation example 2015. This is a four stage process. The stages in this process are social events, sales, social traffic, conservation, key social metrics.
Monthly Social Media Dashboard Ppt PowerPoint Presentation Icon Gallery
This is a monthly social media dashboard ppt powerpoint presentation icon gallery. This is a two stage process. The stages in this process are facebook, social traffic and conversion, referral traffic, conversions, key social metrics, pinterest, you tube.
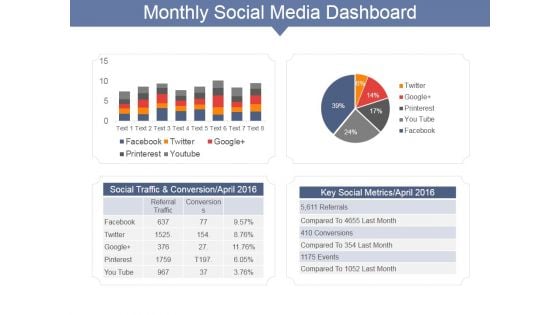
Monthly Social Media Dashboard Ppt PowerPoint Presentation Gallery Show
This is a monthly social media dashboard ppt powerpoint presentation gallery show. This is a two stage process. The stages in this process are social traffic and conversion april, key social metrics april, facebook, twitter.
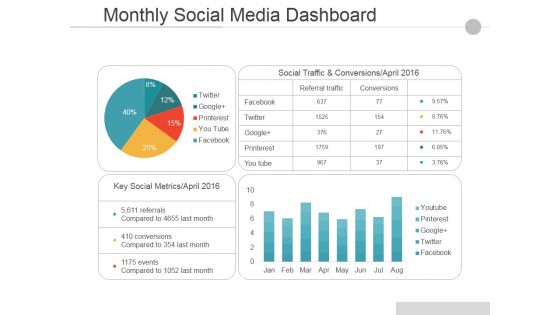
Monthly Social Media Dashboard Ppt PowerPoint Presentation Pictures Guide
This is a monthly social media dashboard ppt powerpoint presentation pictures guide. This is a two stage process. The stages in this process are social traffic and conversions april, key social metrics april, facebook, twitter, google.
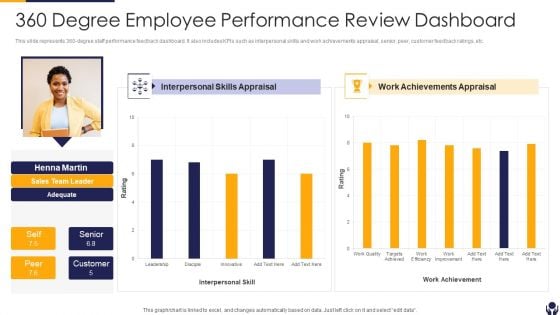
360 Degree Employee Performance Review Dashboard Summary PDF
This slide represents 360 degree staff performance feedback dashboard. It also includes KPIs such as interpersonal skills and work achievements appraisal, senior, peer, customer feedback ratings, etc. Pitch your topic with ease and precision using this 360 Degree Employee Performance Review Dashboard Summary PDF This layout presents information on Skills Appraisal, Achievements, Appraisal It is also available for immediate download and adjustment. So, changes can be made in the color, design, graphics or any other component to create a unique layout.
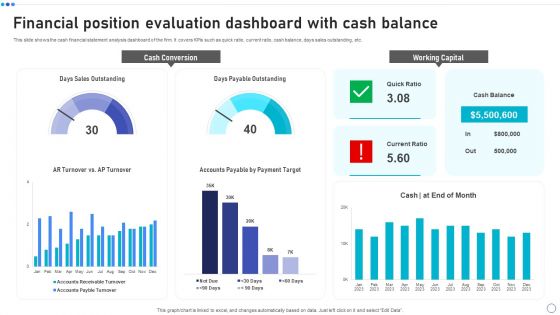
Financial Position Evaluation Dashboard With Cash Balance Rules PDF
This slide shows the cash financial statement analysis dashboard of the firm. It covers KPIs such as quick ratio, current ratio, cash balance, days sales outstanding, etc. Showcasing this set of slides titled Financial Position Evaluation Dashboard With Cash Balance Rules PDF. The topics addressed in these templates are Cash Conversion, Working Capital, Days Sales Outstanding. All the content presented in this PPT design is completely editable. Download it and make adjustments in color, background, font etc. as per your unique business setting.
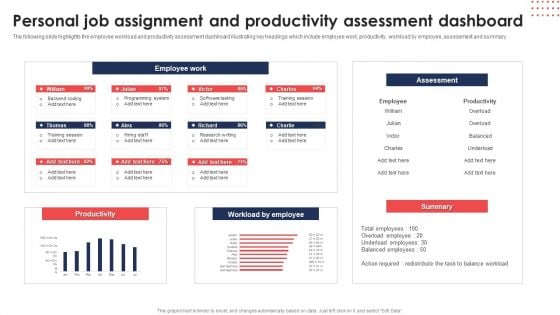
Personal Job Assignment And Productivity Assessment Dashboard Sample PDF
The following slide highlights the employee workload and productivity assessment dashboard illustrating key headings which include employee work, productivity, workload by employee, assessment and summary. Pitch your topic with ease and precision using this Personal Job Assignment And Productivity Assessment Dashboard Sample PDF. This layout presents information on Employee Work, Assessment, Productivity. It is also available for immediate download and adjustment. So, changes can be made in the color, design, graphics or any other component to create a unique layout.
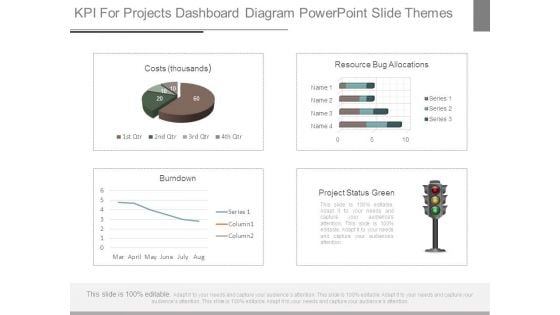
Kpi For Projects Dashboard Diagram Powerpoint Slide Themes
This is a kpi for projects dashboard diagram powerpoint slide themes. This is a four stage process. The stages in this process are project status green, costs thousands, resource bug allocations, burndown.
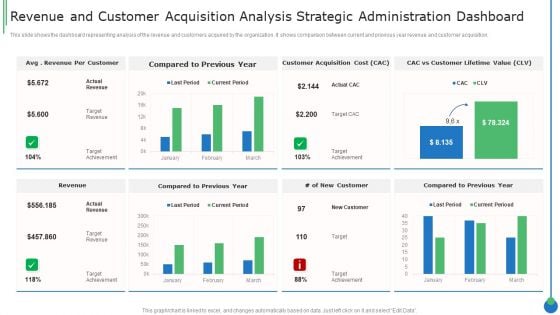
Revenue And Customer Acquisition Analysis Strategic Administration Dashboard Clipart PDF
This slide shows the dashboard representing analysis of the revenue and customers acquired by the organization. It shows comparison between current and previous year revenue and customer acquisition.Pitch your topic with ease and precision using this Revenue And Customer Acquisition Analysis Strategic Administration Dashboard Clipart PDF This layout presents information on Revenue Customer, Compared Previous, Customer Acquisition It is also available for immediate download and adjustment. So, changes can be made in the color, design, graphics or any other component to create a unique layout.
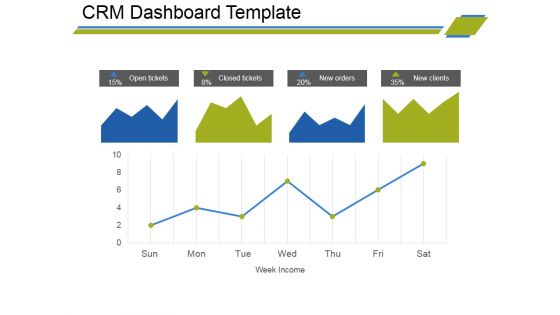
Crm Dashboard Template Ppt PowerPoint Presentation Gallery Ideas
This is a crm dashboard template ppt powerpoint presentation gallery ideas. This is a four stage process. The stages in this process are area chart, growth, strategy, business, analysis.
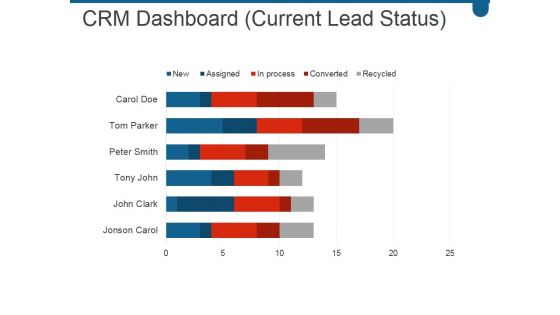
Crm Dashboard Current Lead Status Ppt PowerPoint Presentation Graphics
This is a crm dashboard current lead status ppt powerpoint presentation graphics. This is a six stage process. The stages in this process are carol doe, tom parker, peter smith, tony john, john clark.
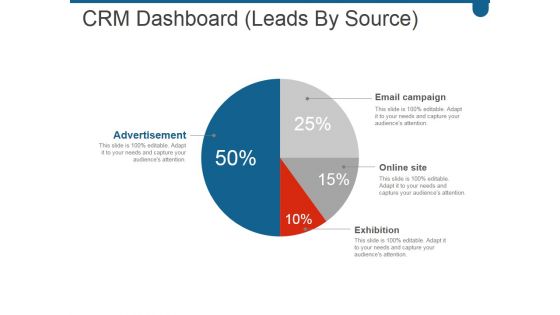
Crm Dashboard Leads By Source Ppt PowerPoint Presentation Inspiration
This is a crm dashboard leads by source ppt powerpoint presentation inspiration. This is a four stage process. The stages in this process are advertisement, email campaign, online site, exhibition.
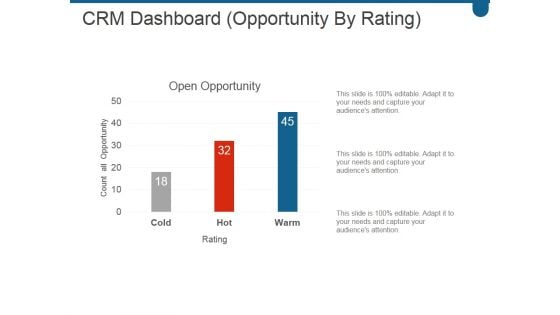
Crm Dashboard Opportunity By Rating Ppt PowerPoint Presentation Model
This is a crm dashboard opportunity by rating ppt powerpoint presentation model. This is a three stage process. The stages in this process are open opportunity, cold, hot, warm.
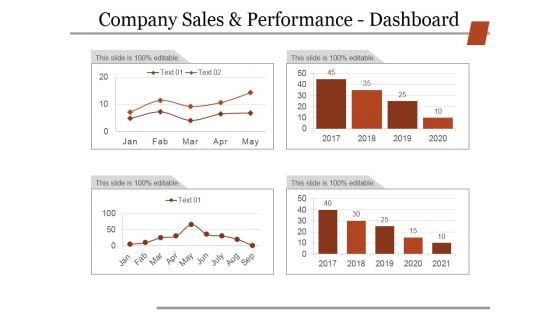
Company Sales And Performance Dashboard Ppt PowerPoint Presentation Slides Grid
This is a company sales and performance dashboard ppt powerpoint presentation slides grid. This is a four stage process. The stages in this process are business, strategy, marketing, finance, analysis.
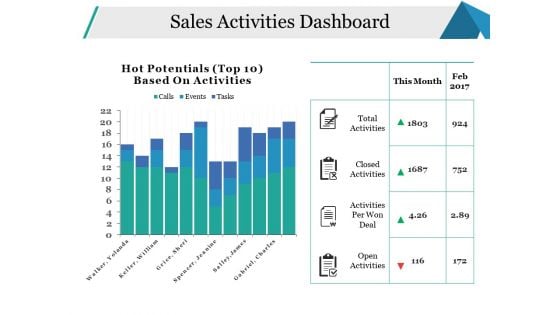
Sales Activities Dashboard Ppt PowerPoint Presentation Pictures Model
This is a sales activities dashboard ppt powerpoint presentation pictures model. This is a two stage process. The stages in this process are open activities, activities per won deal, closed activities, total activities, business.

Sales Activities Dashboard Ppt PowerPoint Presentation Ideas Themes
This is a sales activities dashboard ppt powerpoint presentation ideas themes. This is a two stage process. The stages in this process are total activities, closed activities, activities per won deal, open activities.
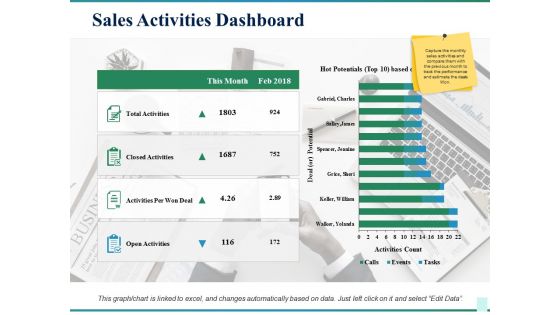
Sales Activities Dashboard Ppt PowerPoint Presentation Show Skills
This is a sales activities dashboard ppt powerpoint presentation show skills. This is a four stage process. The stages in this process are total activities, closed activities, activities per won deal, open activities, this month.
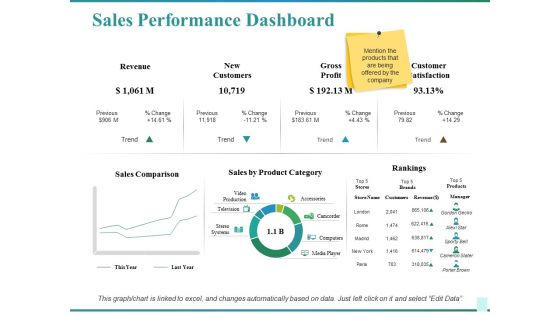
Sales Performance Dashboard Ppt PowerPoint Presentation Show Graphics Design
This is a sales performance dashboard ppt powerpoint presentation show graphics design. This is a two stage process. The stages in this process are sales comparison, sales by product category, rankings, customer satisfaction, revenue.

Sales Product Performance Dashboard Ppt PowerPoint Presentation Model Graphics Design
This is a sales product performance dashboard ppt powerpoint presentation model graphics design. This is a four stage process. The stages in this process are top products in revenue, incremental sales, cost of goods.
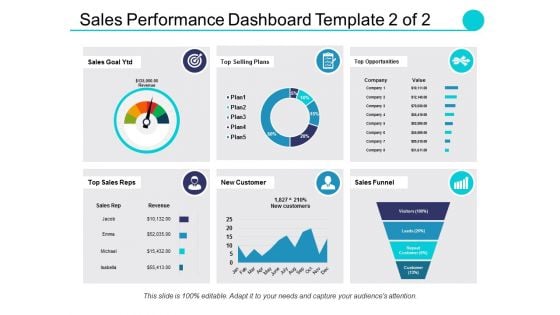
Sales Performance Dashboard Template Ppt PowerPoint Presentation Professional Elements
This is a sales performance dashboard template ppt powerpoint presentation professional elements. This is a eight stage process. The stages in this process are sales comparison, sales by product category, sales by month, brand profitability, revenue.


 Continue with Email

 Home
Home


