Program Management Dashboard
Dashboard For Tracking Aftersales Customer Services Team Performance Designs PDF
This slide covers the KPI dashboard for ticket tracking. It includes metrics such as tickets by month, service level, and details of customer service department agents. Boost your pitch with our creative Dashboard For Tracking Aftersales Customer Services Team Performance Designs PDF. Deliver an awe inspiring pitch that will mesmerize everyone. Using these presentation templates you will surely catch everyones attention. You can browse the ppts collection on our website. We have researchers who are experts at creating the right content for the templates. So you do not have to invest time in any additional work. Just grab the template now and use them.
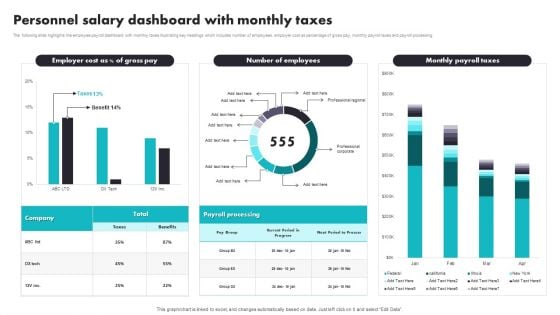
Personnel Salary Dashboard With Monthly Taxes Introduction PDF
The following slide highlights the employee payroll dashboard with monthly taxes illustrating key headings which includes number of employees, employer cost as percentage of gross pay, monthly payroll taxes and payroll processing. Pitch your topic with ease and precision using this Personnel Salary Dashboard With Monthly Taxes Introduction PDF. This layout presents information on Payroll Processing, Benefits. It is also available for immediate download and adjustment. So, changes can be made in the color, design, graphics or any other component to create a unique layout.
CRM Pipeline Administration Tracking Customer Sales Funnel Dashboard Brochure PDF
This slide covers information regarding the customer sales funnel tracking with sales volume and total market. If you are looking for a format to display your unique thoughts, then the professionally designed CRM Pipeline Administration Tracking Customer Sales Funnel Dashboard Brochure PDF is the one for you. You can use it as a Google Slides template or a PowerPoint template. Incorporate impressive visuals, symbols, images, and other charts. Modify or reorganize the text boxes as you desire. Experiment with shade schemes and font pairings. Alter, share or cooperate with other people on your work. Download CRM Pipeline Administration Tracking Customer Sales Funnel Dashboard Brochure PDF and find out how to give a successful presentation. Present a perfect display to your team and make your presentation unforgettable.

PMO Dashboard With Strategy And Delivery KPI Elements PDF
Presenting PMO Dashboard With Strategy And Delivery KPI Elements PDF to dispense important information. This template comprises three stages. It also presents valuable insights into the topics including Percentage Of Projects, Organization Objectives, Percentage Of Projects This is a completely customizable PowerPoint theme that can be put to use immediately. So, download it and address the topic impactfully.
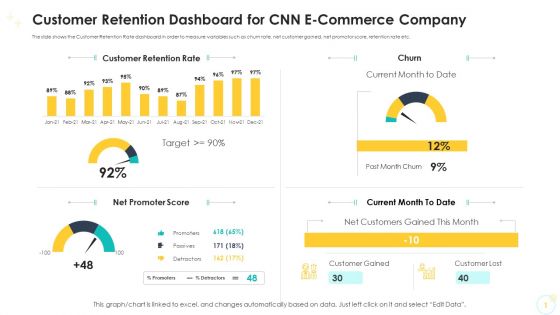
Customer Retention Dashboard For CNN E Commerce Company Ideas PDF
The slide shows the Customer Retention Rate dashboard in order to measure variables such as churn rate, net customer gained, net promotor score, retention rate etc. Deliver and pitch your topic in the best possible manner with this customer retention dashboard for CNN e commerce company ideas pdf. Use them to share invaluable insights on net promoter score, current month to date, current month to date, customer retention rate and impress your audience. This template can be altered and modified as per your expectations. So, grab it now.

Expert Systems Business Intelligence KPI Dashboard Working Formats PDF
Deliver an awe inspiring pitch with this creative expert systems business intelligence kpi dashboard working formats pdf bundle. Topics like checking s savings, working capital can be discussed with this completely editable template. It is available for immediate download depending on the needs and requirements of the user.
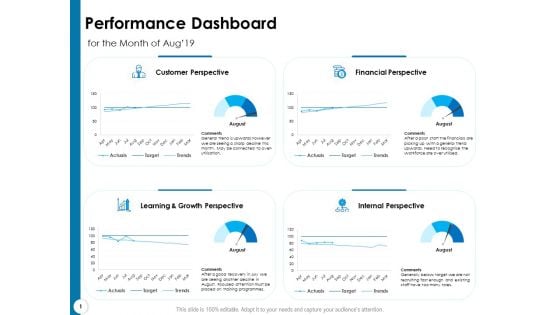
Strategy Execution Balanced Scorecard Performance Dashboard Elements PDF
Presenting this set of slides with name strategy execution balanced scorecard performance dashboard elements pdf. The topics discussed in these slides are customer perspective, financial perspective, internal perspective, learning and growth perspective. This is a completely editable PowerPoint presentation and is available for immediate download. Download now and impress your audience.
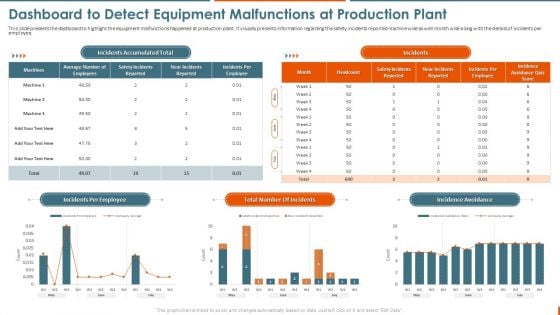
Maintenance Administration Dashboard To Detect Equipment Malfunctions At Guidelines PDF
This slide presents the dashboard to highlight the equipment malfunctions happened at production plant. It visually presents information regarding the safety incidents reported machine wise as well month wise along with the details of incidents per employee. Slidegeeks is one of the best resources for PowerPoint templates. You can download easily and regulate Maintenance Administration Dashboard To Detect Equipment Malfunctions At Guidelines PDF for your personal presentations from our wonderful collection. A few clicks is all it takes to discover and get the most relevant and appropriate templates. Use our Templates to add a unique zing and appeal to your presentation and meetings. All the slides are easy to edit and you can use them even for advertisement purposes.
Statistics Dashboard Vector Icon Ppt PowerPoint Presentation Pictures Visual Aids
Presenting this set of slides with name statistics dashboard vector icon ppt powerpoint presentation pictures visual aids. This is a one stage process. The stages in this process are data visualization icon, research analysis, business focus. This is a completely editable PowerPoint presentation and is available for immediate download. Download now and impress your audience.
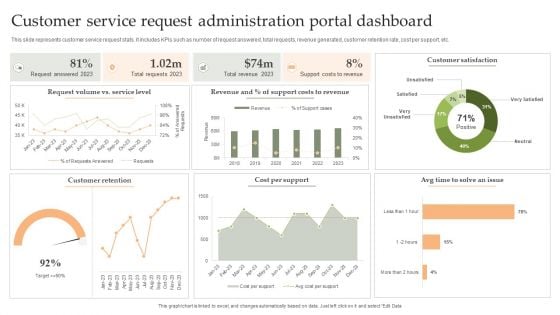
Customer Service Request Administration Portal Dashboard Download PDF
This slide represents customer service request stats. It includes KPIs such as number of request answered, total requests, revenue generated, customer retention rate, cost per support, etc. Showcasing this set of slides titled Customer Service Request Administration Portal Dashboard Download PDF. The topics addressed in these templates are Cost Per Support, Customer Retention, Customer Satisfaction. All the content presented in this PPT design is completely editable. Download it and make adjustments in color, background, font etc. as per your unique business setting.
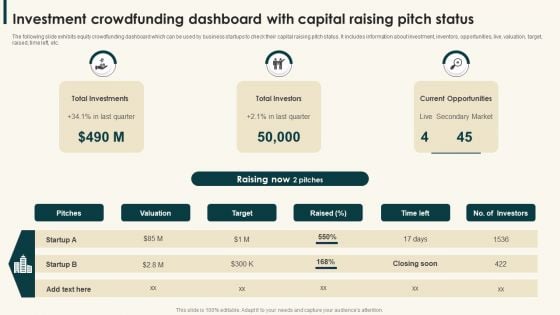
Investment Crowdfunding Dashboard With Capital Raising Pitch Status Sample PDF
The following slide exhibits equity crowdfunding dashboard which can be used by business startups to check their capital raising pitch status. It includes information about investment, inventors, opportunities, live, valuation, target, raised, time left, etc.Presenting Investment Crowdfunding Dashboard With Capital Raising Pitch Status Sample PDF to dispense important information. This template comprises three stages. It also presents valuable insights into the topics including Total Investments, Total Investors, Current Opportunities. This is a completely customizable PowerPoint theme that can be put to use immediately. So, download it and address the topic impactfully.
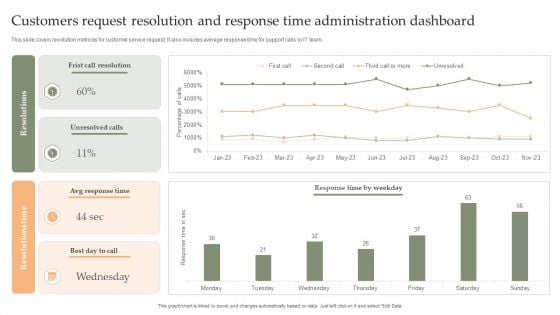
Customers Request Resolution And Response Time Administration Dashboard Mockup PDF
This slide covers resolution metrices for customer service request. It also includes average response time for support calls by IT team. Showcasing this set of slides titled Customers Request Resolution And Response Time Administration Dashboard Mockup PDF. The topics addressed in these templates are Frist Call Resolution, Unresolved Calls, Avg Response Time. All the content presented in this PPT design is completely editable. Download it and make adjustments in color, background, font etc. as per your unique business setting.
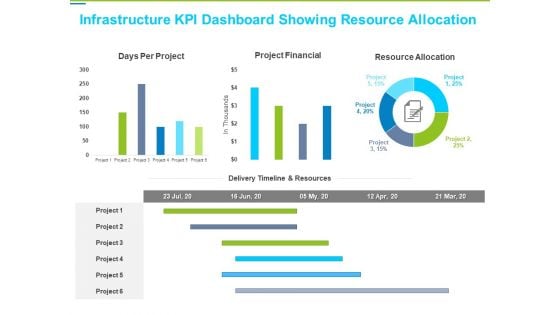
Framework Administration Infrastructure KPI Dashboard Showing Resource Allocation Brochure PDF
This is a framework administration infrastructure kpi dashboard showing resource allocation brochure pdf template with various stages. Focus and dispense information on six stages using this creative set, that comes with editable features. It contains large content boxes to add your information on topics like project financial, resource allocation, days per project. You can also showcase facts, figures, and other relevant content using this PPT layout. Grab it now.
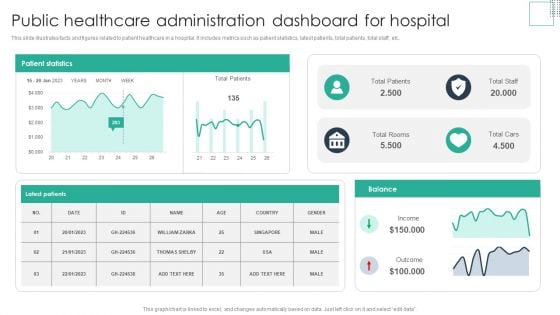
Public Healthcare Administration Dashboard For Hospital Guidelines PDF
This slide illustrates facts and figures related to patient healthcare in a hospital. It includes metrics such as patient statistics, latest patients, total patients, total staff, etc.Pitch your topic with ease and precision using this Public Healthcare Administration Dashboard For Hospital Guidelines PDF. This layout presents information on Total Patients, Total Rooms, Patient Statistics. It is also available for immediate download and adjustment. So, changes can be made in the color, design, graphics or any other component to create a unique layout.
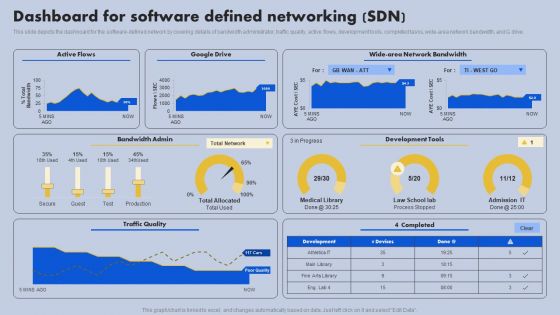
Dashboard For Software Defined Networking SDN Ppt Slides Images PDF
This slide depicts the dashboard for the software-defined network by covering details of bandwidth administrator, traffic quality, active flows, development tools, completed tasks, wide-area network bandwidth, and G drive. Coming up with a presentation necessitates that the majority of the effort goes into the content and the message you intend to convey. The visuals of a PowerPoint presentation can only be effective if it supplements and supports the story that is being told. Keeping this in mind our experts created Dashboard For Software Defined Networking SDN Ppt Slides Images PDF to reduce the time that goes into designing the presentation. This way, you can concentrate on the message while our designers take care of providing you with the right template for the situation.
Dashboard For Software Defined Networking SDN Ppt Icon Samples PDF
This slide depicts the dashboard for the software-defined network by covering details of bandwidth administrator, traffic quality, active flows, development tools, completed tasks, wide-area network bandwidth, and G drive. Coming up with a presentation necessitates that the majority of the effort goes into the content and the message you intend to convey. The visuals of a PowerPoint presentation can only be effective if it supplements and supports the story that is being told. Keeping this in mind our experts created Dashboard For Software Defined Networking SDN Ppt Icon Samples PDF to reduce the time that goes into designing the presentation. This way, you can concentrate on the message while our designers take care of providing you with the right template for the situation.
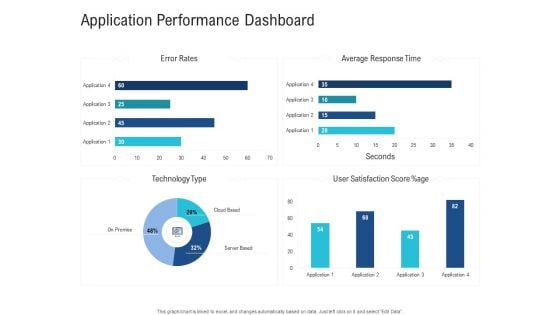
Enhance Enterprise Application Performance Application Performance Dashboard Microsoft PDF
Deliver an awe-inspiring pitch with this creative enhance enterprise application performance application performance dashboard microsoft pdf bundle. Topics like technology, server, satisfaction score, cloud based, average response can be discussed with this completely editable template. It is available for immediate download depending on the needs and requirements of the user.
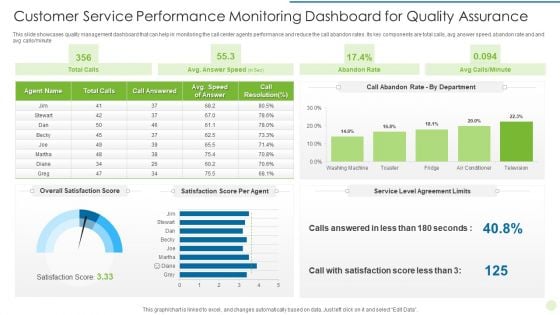
Customer Service Performance Monitoring Dashboard For Quality Assurance Professional PDF
Pitch your topic with ease and precision using this Customer Service Performance Monitoring Dashboard For Quality Assurance Professional PDF This layout presents information on Overall Satisfaction Score, Satisfaction Score Per Agent, Answered In Less It is also available for immediate download and adjustment. So, changes can be made in the color, design, graphics or any other component to create a unique layout.
Development And Operations KPI Dashboard IT Circular Diagram Graphics PDF
This is a development and operations kpi dashboard it circular diagram graphics pdf template with various stages. Focus and dispense information on seven stages using this creative set, that comes with editable features. It contains large content boxes to add your information on topics like circular diagram. You can also showcase facts, figures, and other relevant content using this PPT layout. Grab it now.
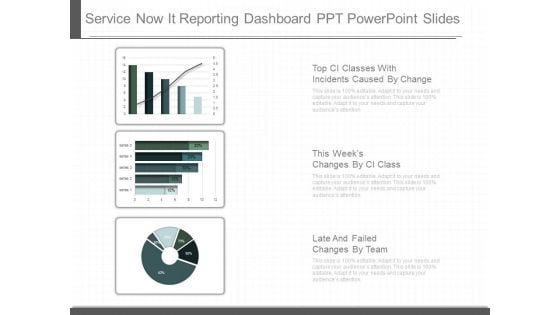
Service Now It Reporting Dashboard Ppt Powerpoint Slides
This is a service now it reporting dashboard ppt powerpoint slides. This is a three stage process. The stages in this process are top ci classes with incidents caused by change, this weeks changes by ci class, late and failed changes by team.
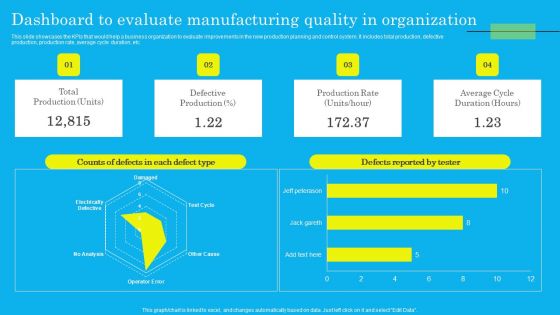
Dashboard To Evaluate Manufacturing Quality In Organization Elements PDF
This slide showcases the KPIs that would help a business organization to evaluate improvements in the new production planning and control system. It includes total production, defective production, production rate, average cycle duration, etc. Here you can discover an assortment of the finest PowerPoint and Google Slides templates. With these templates, you can create presentations for a variety of purposes while simultaneously providing your audience with an eye catching visual experience. Download Dashboard To Evaluate Manufacturing Quality In Organization Elements PDF to deliver an impeccable presentation. These templates will make your job of preparing presentations much quicker, yet still, maintain a high level of quality. Slidegeeks has experienced researchers who prepare these templates and write high quality content for you. Later on, you can personalize the content by editing the Dashboard To Evaluate Manufacturing Quality In Organization Elements PDF.
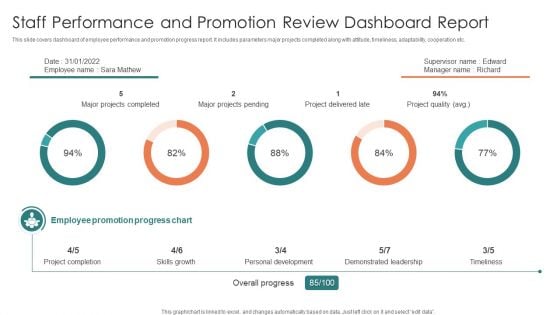
Staff Performance And Promotion Review Dashboard Report Structure PDF
Showcasing this set of slides titled Staff Performance And Promotion Review Dashboard Report Structure PDF. The topics addressed in these templates are Personal Development, Demonstrated Leadership, Skills Growth. All the content presented in this PPT design is completely editable. Download it and make adjustments in color, background, font etc. as per your unique business setting.
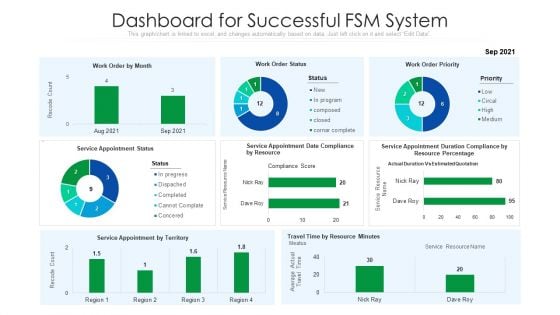
Dashboard For Successful FSM System Ppt Visual Aids Infographics PDF
Showcasing this set of slides titled dashboard for successful fsm system ppt visual aids infographics pdf. The topics addressed in these templates are resource percentage, duration compliance, priority. All the content presented in this PPT design is completely editable. Download it and make adjustments in color, background, font etc. as per your unique business setting.
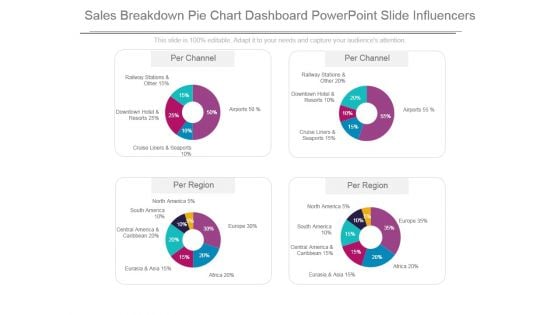
Sales Breakdown Pie Chart Dashboard Powerpoint Slide Influencers
This is a sales breakdown pie chart dashboard powerpoint slide influencers. This is a four stage process. The stages in this process are railway stations and other, downtown hotel and resorts, cruise liners and seaports, airports, north america, south america, central america and caribbean, eurasia and asia, africa, europe.
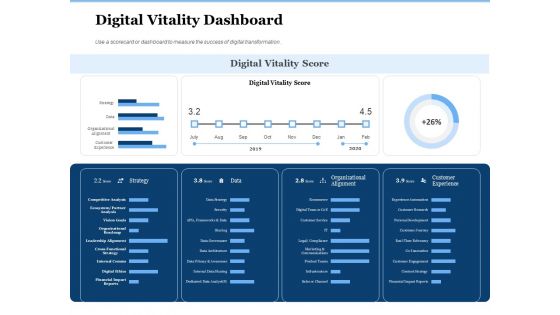
Generate Digitalization Roadmap For Business Digital Vitality Dashboard Diagrams PDF
Deliver an awe inspiring pitch with this creative generate digitalization roadmap for business digital vitality dashboard diagrams pdf bundle. Topics like strategy, organizational alignment, digital vitality score, customer experience can be discussed with this completely editable template. It is available for immediate download depending on the needs and requirements of the user.
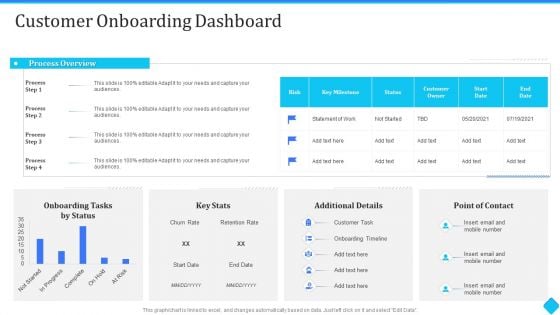
User Onboarding Process Development Customer Onboarding Dashboard Background PDF
Deliver and pitch your topic in the best possible manner with this User Onboarding Process Development Customer Onboarding Dashboard Background PDF. Use them to share invaluable insights on customer owner, onboarding timeline, process overview and impress your audience. This template can be altered and modified as per your expectations. So, grab it now.
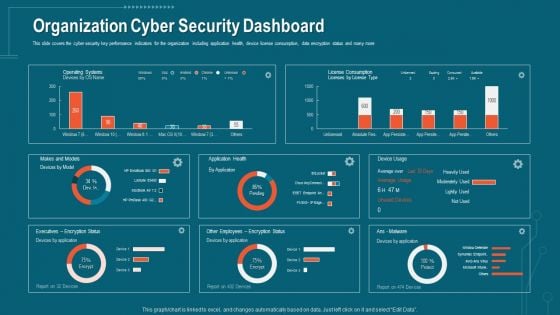
Companys Data Safety Recognition Organization Cyber Security Dashboard Pictures PDF
This slide covers the cyber security key performance indicators for the organization including application health, device license consumption, data encryption status and many more. Deliver an awe-inspiring pitch with this creative companys data safety recognition organization cyber security dashboard pictures pdf bundle. Topics like application health, operating systems, encryption status can be discussed with this completely editable template. It is available for immediate download depending on the needs and requirements of the user.
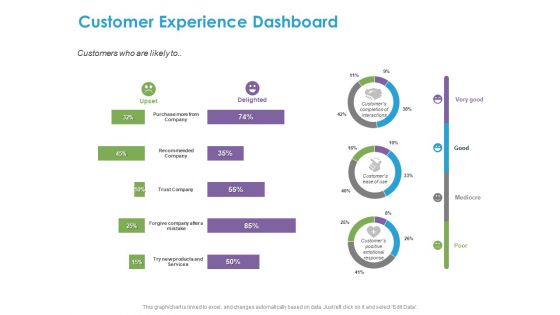
Customer Experience Process Customer Experience Dashboard Ppt Infographics Gridlines PDF
Presenting this set of slides with name customer experience process customer experience dashboard ppt infographics gridlines pdf. The topics discussed in these slides are purchase company, recommended company, trust company, forgive company mistake, try new products and services. This is a completely editable PowerPoint presentation and is available for immediate download. Download now and impress your audience.
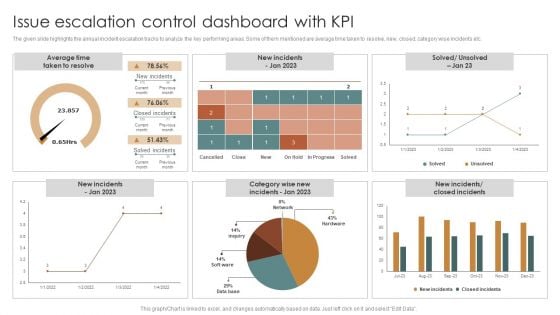
Issue Escalation Control Dashboard With KPI Clipart PDF
The given slide highlights the annual incident escalation tracks to analyze the key performing areas. Some of them mentioned are average time taken to resolve, new, closed, category wise incidents etc. Showcasing this set of slides titled Issue Escalation Control Dashboard With KPI Clipart PDF. The topics addressed in these templates are Average Time, Taken To Resolve. All the content presented in this PPT design is completely editable. Download it and make adjustments in color, background, font etc. as per your unique business setting.
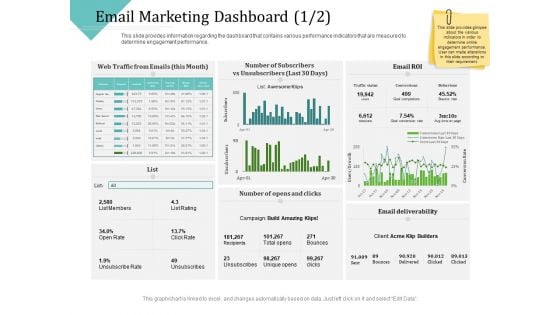
Improving Client Experience Email Marketing Dashboard Click Demonstration PDF
Deliver and pitch your topic in the best possible manner with this improving client experience email marketing dashboard click demonstration pdf. Use them to share invaluable insights on campaign, traffic status, social, organic, paid search and impress your audience. This template can be altered and modified as per your expectations. So, grab it now.
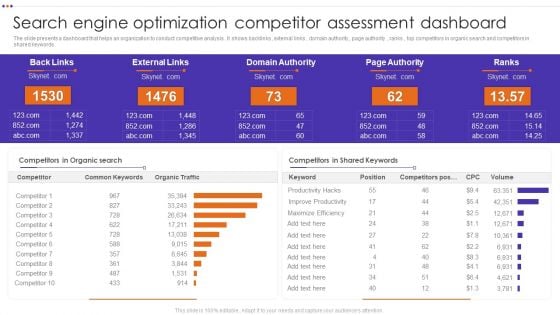
Search Engine Optimization Competitor Assessment Dashboard Graphics PDF
Pitch your topic with ease and precision using this Search Engine Optimization Competitor Assessment Dashboard Graphics PDF. This layout presents information on Domain Authority, External Links, Competitors In Organic. It is also available for immediate download and adjustment. So, changes can be made in the color, design, graphics or any other component to create a unique layout.
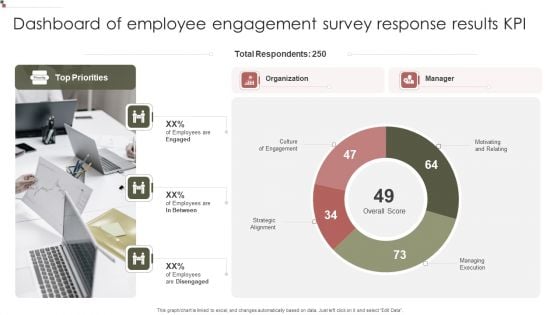
Dashboard Of Employee Engagement Survey Response Results KPI Microsoft PDF
Showcasing this set of slides titled Dashboard Of Employee Engagement Survey Response Results KPI Microsoft PDF. The topics addressed in these templates are Total Respondents, Organization Culture, Engagement. All the content presented in this PPT design is completely editable. Download it and make adjustments in color, background, font etc. as per your unique business setting.
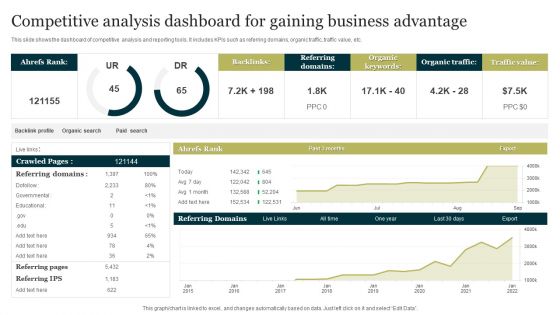
Competitive Analysis Dashboard For Gaining Business Advantage Professional PDF
Showcasing this set of slides titled Competitive Analysis Dashboard For Gaining Business Advantage Professional PDF. The topics addressed in these templates are Organic Traffic, Traffic Value, Referring Domains. All the content presented in this PPT design is completely editable. Download it and make adjustments in color, background, font etc. as per your unique business setting.
Organization Cyber Security Dashboard Ppt Icon Sample PDF
This slide covers the cyber security key performance indicators for the organization including application health, device license consumption, data encryption status and many more Deliver and pitch your topic in the best possible manner with this organization cyber security dashboard ppt icon sample pdf. Use them to share invaluable insights on makes and models, application health, license consumption, operating systems and impress your audience. This template can be altered and modified as per your expectations. So, grab it now.
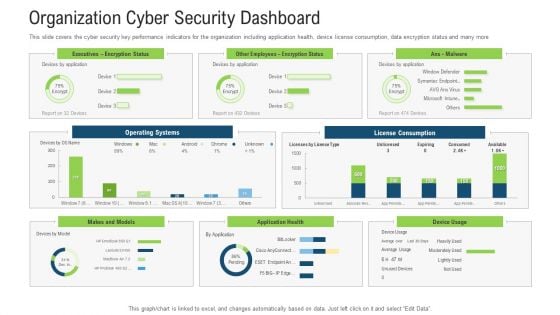
Organization Cyber Security Dashboard Ppt Show Outfit PDF
This slide covers the cyber security key performance indicators for the organization including application health, device license consumption, data encryption status and many more. Deliver an awe inspiring pitch with this creative organization cyber security dashboard ppt show outfit pdf bundle. Topics like operating systems, license consumption, makes and models, other employees can be discussed with this completely editable template. It is available for immediate download depending on the needs and requirements of the user.
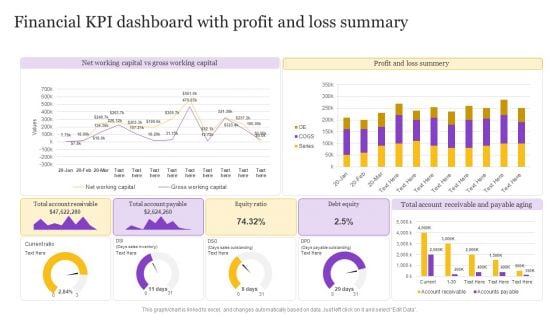
Financial KPI Dashboard With Profit And Loss Summary Professional PDF
Pitch your topic with ease and precision using this Financial KPI Dashboard With Profit And Loss Summary Professional PDF. This layout presents information on Net Working Capital, Gross Working Capital. It is also available for immediate download and adjustment. So, changes can be made in the color, design, graphics or any other component to create a unique layout.
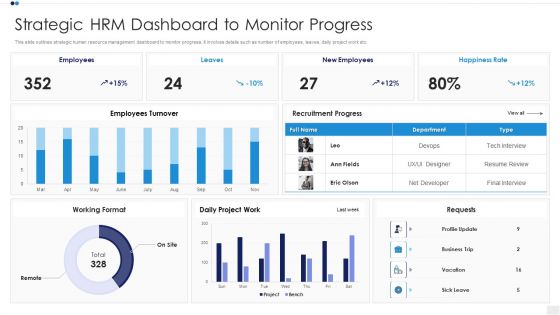
Strategic HRM Dashboard To Monitor Progress Designs PDF
Showcasing this set of slides titled trategic HRM Dashboard To Monitor Progress Designs PDF The topics addressed in these templates are Employees Turnover, Recruitment Progress, Working Format All the content presented in this PPT design is completely editable. Download it and make adjustments in color, background, font etc. as per your unique business setting.
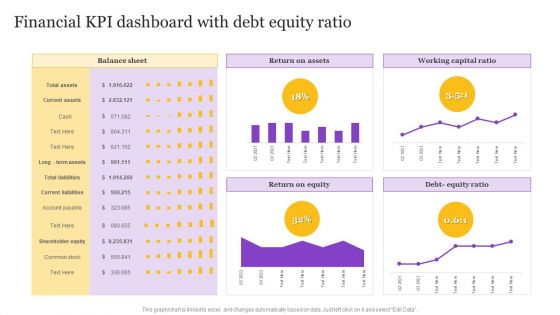
Financial KPI Dashboard With Debt Equity Ratio Rules PDF
Pitch your topic with ease and precision using this Financial KPI Dashboard With Debt Equity Ratio Rules PDF. This layout presents information on Working Capital Ratio, Return On Assets, Return On Equity. It is also available for immediate download and adjustment. So, changes can be made in the color, design, graphics or any other component to create a unique layout.
Solar Computing IT Green Cloud Computing Performance Tracking Dashboard
This slide depicts the performance tracking dashboard for green cloud computing. This slide aims to showcase the performance tracking report of green cloud computing by covering parameters such as Power Use Effectiveness PUE, high-density zone, history, consumption, and Average Propensity to Consume APC consumption. Are you in need of a template that can accommodate all of your creative concepts This one is crafted professionally and can be altered to fit any style. Use it with Google Slides or PowerPoint. Include striking photographs, symbols, depictions, and other visuals. Fill, move around, or remove text boxes as desired. Test out color palettes and font mixtures. Edit and save your work, or work with colleagues. Download Solar Computing IT Green Cloud Computing Performance Tracking Dashboard and observe how to make your presentation outstanding. Give an impeccable presentation to your group and make your presentation unforgettable. This slide depicts the performance tracking dashboard for green cloud computing. This slide aims to showcase the performance tracking report of green cloud computing by covering parameters such as Power Use Effectiveness PUE, high-density zone, history, consumption, and Average Propensity to Consume APC consumption.
Green Computing Green Cloud Computing Performance Tracking Dashboard
This slide depicts the performance tracking dashboard for green cloud computing. This slide aims to showcase the performance tracking report of green cloud computing by covering parameters such asPower Use Effectiveness PUE, high-density zone, history, consumption, and Average Propensity to Consume APC consumption. If you are looking for a format to display your unique thoughts, then the professionally designed Green Computing Green Cloud Computing Performance Tracking Dashboard is the one for you. You can use it as a Google Slides template or a PowerPoint template. Incorporate impressive visuals, symbols, images, and other charts. Modify or reorganize the text boxes as you desire. Experiment with shade schemes and font pairings. Alter, share or cooperate with other people on your work. Download Green Computing Green Cloud Computing Performance Tracking Dashboard and find out how to give a successful presentation. Present a perfect display to your team and make your presentation unforgettable. This slide depicts the performance tracking dashboard for green cloud computing. This slide aims to showcase the performance tracking report of green cloud computing by covering parameters such asPower Use Effectiveness PUE, high-density zone, history, consumption, and Average Propensity to Consume APC consumption.
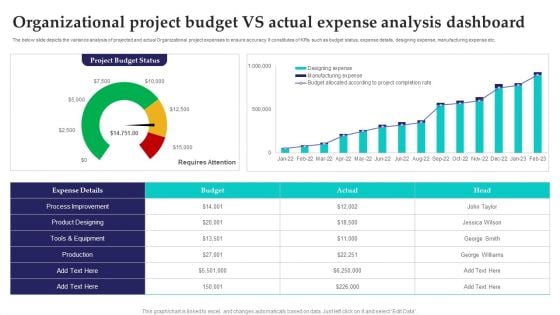
Organizational Project Budget Vs Actual Expense Analysis Dashboard Sample PDF
Showcasing this set of slides titled Organizational Project Budget Vs Actual Expense Analysis Dashboard Sample PDF. The topics addressed in these templates are Process Improvement, Equipment, Budget. All the content presented in this PPT design is completely editable. Download it and make adjustments in color, background, font etc. as per your unique business setting.
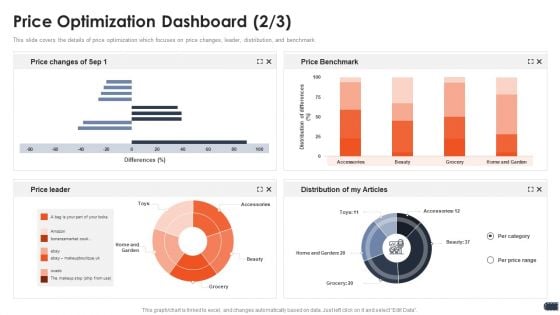
Business Pricing Model Price Optimization Dashboard Distribution Inspiration PDF
This slide covers the details of price optimization which focuses on price changes, leader, distribution, and benchmark. Deliver an awe inspiring pitch with this creative business pricing model price optimization dashboard distribution inspiration pdf bundle. Topics like price changes, leader, distribution, benchmark can be discussed with this completely editable template. It is available for immediate download depending on the needs and requirements of the user.
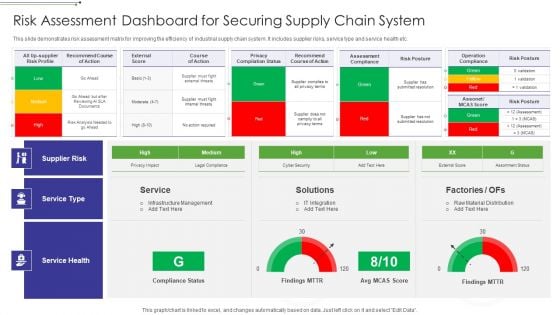
Risk Assessment Dashboard For Securing Supply Chain System Graphics PDF
This slide demonstrates risk assessment matrix for improving the efficiency of industrial supply chain system. It includes supplier risks, service type and service health etc.Showcasing this set of slides titled Risk Assessment Dashboard For Securing Supply Chain System Graphics PDF The topics addressed in these templates are Operation Compliance, Privacy Compilation, External Score All the content presented in this PPT design is completely editable. Download it and make adjustments in color, background, font etc. as per your unique business setting.
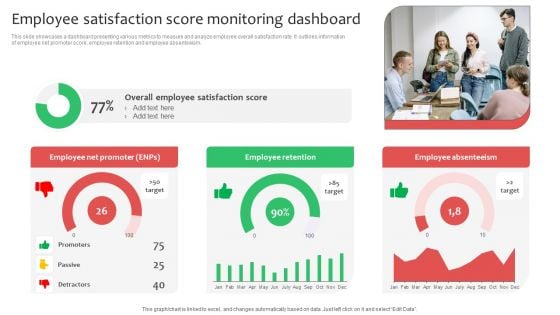
Employee Satisfaction Score Monitoring Dashboard Ppt Infographics Deck PDF
This slide showcases a dashboard presenting various metrics to measure and analyze employee overall satisfaction rate. It outlines information of employee net promoter score, employee retention and employee absenteeism. This Employee Satisfaction Score Monitoring Dashboard Ppt Infographics Deck PDF from Slidegeeks makes it easy to present information on your topic with precision. It provides customization options, so you can make changes to the colors, design, graphics, or any other component to create a unique layout. It is also available for immediate download, so you can begin using it right away. Slidegeeks has done good research to ensure that you have everything you need to make your presentation stand out. Make a name out there for a brilliant performance.
Nps Reports And Dashboard Circular Diagram Ppt Summary Guide PDF
This is a nps reports and dashboard circular diagram ppt summary guide pdf template with various stages. Focus and dispense information on six stages using this creative set, that comes with editable features. It contains large content boxes to add your information on topics like circular diagram. You can also showcase facts, figures, and other relevant content using this PPT layout. Grab it now.
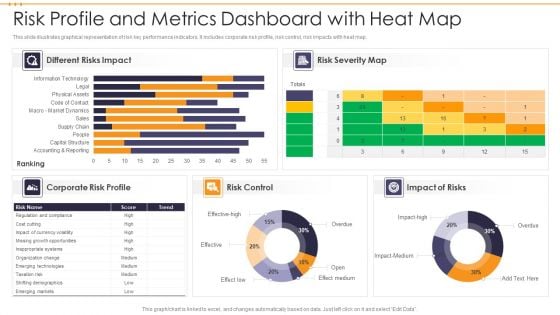
Risk Profile And Metrics Dashboard With Heat Map Brochure PDF
This slide illustrates graphical representation of risk key performance indicators. It includes corporate risk profile, risk control, risk impacts with heat map. Showcasing this set of slides titled Risk Profile And Metrics Dashboard With Heat Map Brochure PDF. The topics addressed in these templates are Risk Control, Impact Of Risks, Risk Severity Map. All the content presented in this PPT design is completely editable. Download it and make adjustments in color, background, font etc. as per your unique business setting.
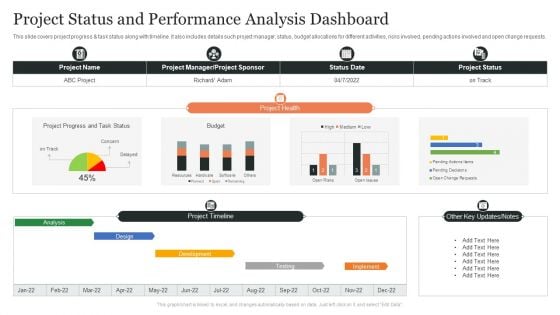
Project Status And Performance Analysis Dashboard Ppt Slides Brochure PDF
This slide covers project progress and task status along with timeline. It also includes details such project manager, status, budget allocations for different activities, risks involved, pending actions involved and open change requests. Showcasing this set of slides titled Project Status And Performance Analysis Dashboard Ppt Slides Brochure PDF. The topics addressed in these templates are Project Health, Design, Project Timeline, Other Key Updates, Notes. All the content presented in this PPT design is completely editable. Download it and make adjustments in color, background, font etc. as per your unique business setting.
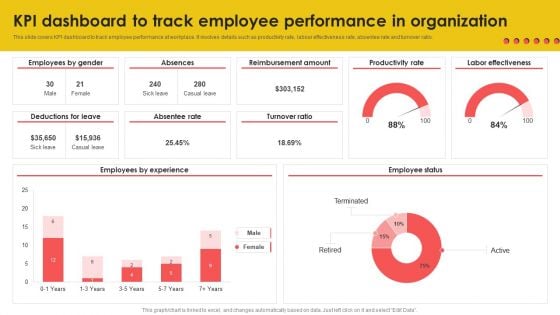
KPI Dashboard To Track Employee Performance In Organization Background PDF
This slide covers KPI dashboard to track employee performance at workplace. It involves details such as productivity rate, labour effectiveness rate, absentee rate and turnover ratio. This KPI Dashboard To Track Employee Performance In Organization Background PDF from Slidegeeks makes it easy to present information on your topic with precision. It provides customization options, so you can make changes to the colors, design, graphics, or any other component to create a unique layout. It is also available for immediate download, so you can begin using it right away. Slidegeeks has done good research to ensure that you have everything you need to make your presentation stand out. Make a name out there for a brilliant performance.
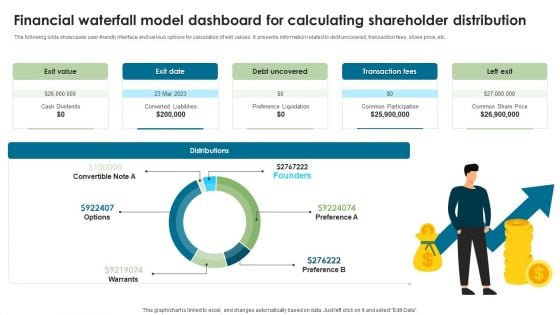
Financial Waterfall Model Dashboard For Calculating Shareholder Distribution Slides PDF
The following slide showcases user-friendly interface and various options for calculation of exit values. It presents information related to debt uncovered, transaction fees, share price, etc. Showcasing this set of slides titled Financial Waterfall Model Dashboard For Calculating Shareholder Distribution Slides PDF. The topics addressed in these templates are Exit Value, Exit Date, Debt Uncovered. All the content presented in this PPT design is completely editable. Download it and make adjustments in color, background, font etc. as per your unique business setting.
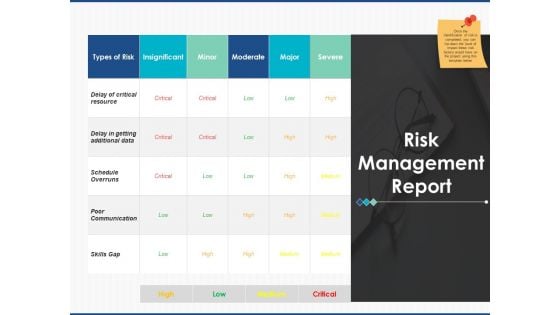
Risk Management Report Management Ppt PowerPoint Presentation Layouts Influencers
This is a risk management report management ppt powerpoint presentation layouts influencers. The topics discussed in this diagram are marketing, business, management, planning, strategy This is a completely editable PowerPoint presentation, and is available for immediate download.
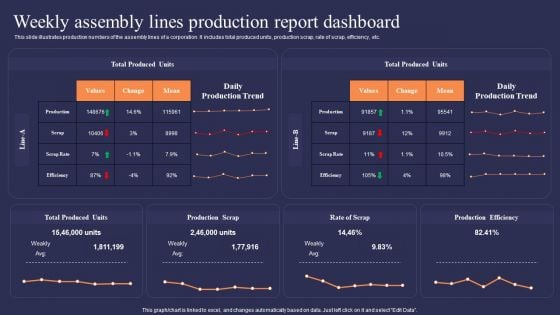
Weekly Assembly Lines Production Report Dashboard Demonstration PDF
This slide illustrates production numbers of the assembly lines of a corporation. It includes total produced units, production scrap, rate of scrap, efficiency, etc.Showcasing this set of slides titled Weekly Assembly Lines Production Report Dashboard Demonstration PDF. The topics addressed in these templates are Total Produced, Production Efficiency, Production Scrap. All the content presented in this PPT design is completely editable. Download it and make adjustments in color, background, font etc. as per your unique business setting.
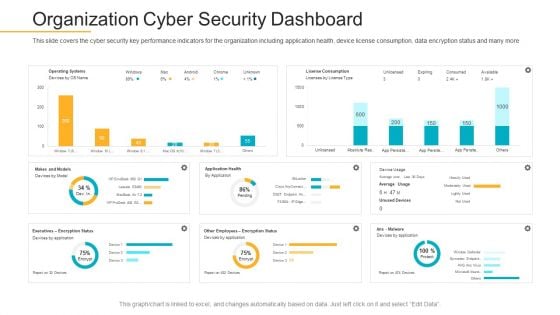
Data Breach Prevention Recognition Organization Cyber Security Dashboard Demonstration PDF
This slide covers the cyber security key performance indicators for the organization including application health, device license consumption, data encryption status and many more. Deliver and pitch your topic in the best possible manner with this data breach prevention recognition organization cyber security dashboard demonstration pdf. Use them to share invaluable insights on cyber security, key performance, organization and impress your audience. This template can be altered and modified as per your expectations. So, grab it now.
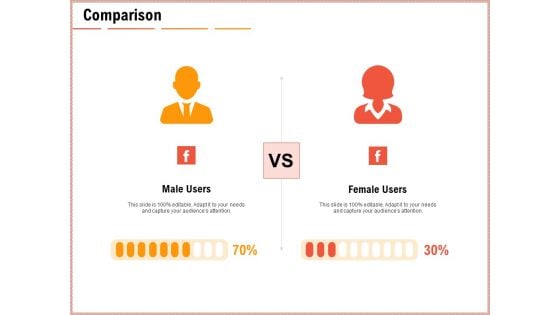
Net Promoter Score Dashboard Comparison Ppt Gallery Graphics Example PDF
This is a net promoter score dashboard comparison ppt gallery graphics example pdf template with various stages. Focus and dispense information on two stages using this creative set, that comes with editable features. It contains large content boxes to add your information on topics like comparison, male, female. You can also showcase facts, figures, and other relevant content using this PPT layout. Grab it now.
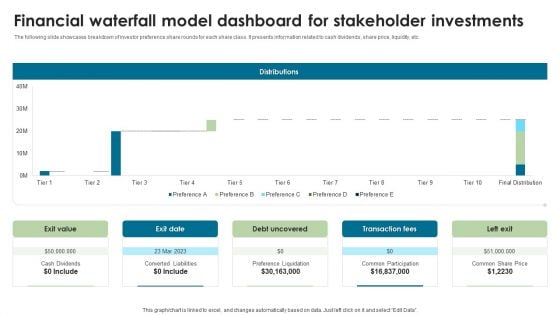
Financial Waterfall Model Dashboard For Stakeholder Investments Graphics PDF
The following slide showcases breakdown of investor preference share rounds for each share class. It presents information related to cash dividends, share price, liquidity, etc. Showcasing this set of slides titled Financial Waterfall Model Dashboard For Stakeholder Investments Graphics PDF. The topics addressed in these templates are Distributions, Transaction Fees, Left Exit. All the content presented in this PPT design is completely editable. Download it and make adjustments in color, background, font etc. as per your unique business setting.
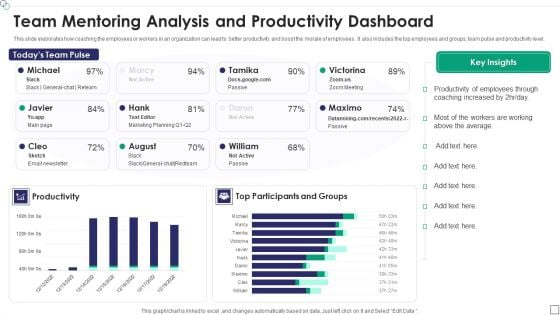
Team Mentoring Analysis And Productivity Dashboard Template PDF
This slide elaborates how coaching the employees or workers in an organization can lead to better productivity and boost the morale of employees . It also includes the top employees and groups, team pulse and productivity level.Showcasing this set of slides titled Team Mentoring Analysis And Productivity Dashboard Template PDF The topics addressed in these templates are Productivity Of Employees, Coaching Increased, Productivity All the content presented in this PPT design is completely editable. Download it and make adjustments in color, background, font etc. as per your unique business setting.
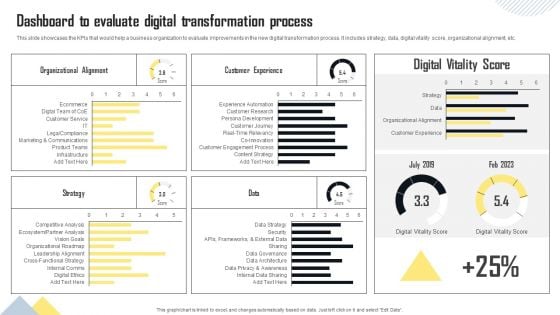
Dashboard To Evaluate Digital Transformation Process Graphics PDF
This slide showcases the KPIs that would help a business organization to evaluate improvements in the new digital transformation process. It includes strategy, data, digital vitality score, organizational alignment, etc. Here you can discover an assortment of the finest PowerPoint and Google Slides templates. With these templates, you can create presentations for a variety of purposes while simultaneously providing your audience with an eye catching visual experience. Download Dashboard To Evaluate Digital Transformation Process Graphics PDF to deliver an impeccable presentation. These templates will make your job of preparing presentations much quicker, yet still, maintain a high level of quality. Slidegeeks has experienced researchers who prepare these templates and write high quality content for you. Later on, you can personalize the content by editing the Dashboard To Evaluate Digital Transformation Process Graphics PDF.

Net Promoter Score Dashboard Roadmap Ppt Styles Designs PDF
This is a net promoter score dashboard roadmap ppt styles designs pdf template with various stages. Focus and dispense information on five stages using this creative set, that comes with editable features. It contains large content boxes to add your information on topics like roadmap, 2017 to 2021. You can also showcase facts, figures, and other relevant content using this PPT layout. Grab it now.
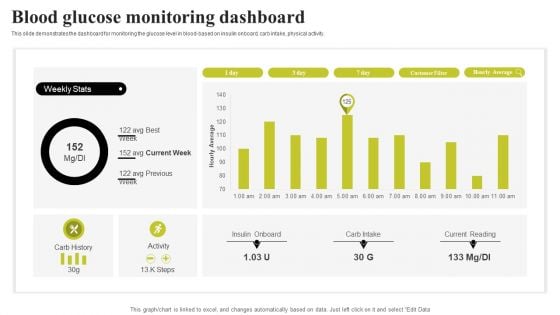
Biochip Technology Blood Glucose Monitoring Dashboard Infographics PDF
This slide demonstrates the dashboard for monitoring the glucose level in blood based on insulin onboard, carb intake, physical activity. Are you in need of a template that can accommodate all of your creative concepts This one is crafted professionally and can be altered to fit any style. Use it with Google Slides or PowerPoint. Include striking photographs, symbols, depictions, and other visuals. Fill, move around, or remove text boxes as desired. Test out color palettes and font mixtures. Edit and save your work, or work with colleagues. Download Biochip Technology Blood Glucose Monitoring Dashboard Infographics PDF and observe how to make your presentation outstanding. Give an impeccable presentation to your group and make your presentation unforgettable.
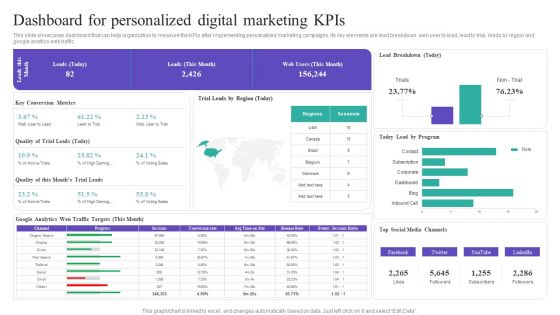
Dashboard For Personalized Digital Marketing Kpis Rules PDF
This slide showcases dashboard that can help organization to measure the KPIs after implementing personalized marketing campaigns. Its key elements are lead breakdown, web user to lead, lead to trial, leads by region and google analtics web traffic. This Dashboard For Personalized Digital Marketing Kpis Rules PDF from Slidegeeks makes it easy to present information on your topic with precision. It provides customization options, so you can make changes to the colors, design, graphics, or any other component to create a unique layout. It is also available for immediate download, so you can begin using it right away. Slidegeeks has done good research to ensure that you have everything you need to make your presentation stand out. Make a name out there for a brilliant performance.
Optimize Marketing Pricing Price Optimization Dashboard Distribution Icons PDF
This slide covers the details of price optimization which focuses on price changes, leader, distribution, and benchmark. Deliver an awe inspiring pitch with this creative optimize marketing pricing price optimization dashboard distribution icons pdf bundle. Topics like price benchmark, price leader, distribution of my articles, price changes of sep 1 can be discussed with this completely editable template. It is available for immediate download depending on the needs and requirements of the user.


 Continue with Email

 Home
Home


