Program Management Plan
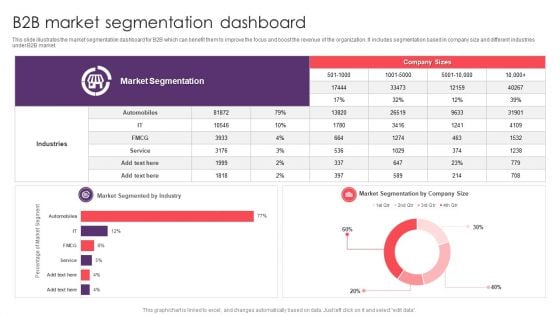
B2B Market Segmentation Dashboard Microsoft PDF
This slide illustrates the market segmentation dashboard for B2B which can benefit them to improve the focus and boost the revenue of the organization. It includes segmentation based in company size and different industries under B2B market. Pitch your topic with ease and precision using this B2B Market Segmentation Dashboard Microsoft PDF. This layout presents information on Industries, Market Segmentation, Service. It is also available for immediate download and adjustment. So, changes can be made in the color, design, graphics or any other component to create a unique layout.
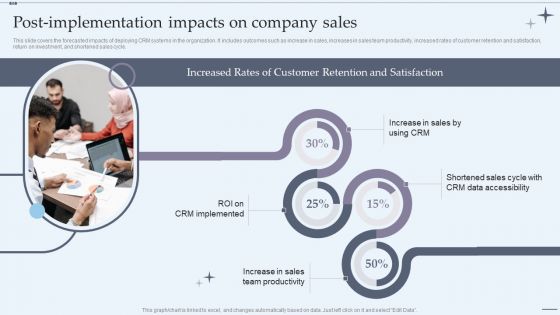
CRM System Implementation Stages Postimplementation Impacts On Company Sales Graphics PDF
This slide covers the forecasted impacts of deploying CRM systems in the organization. It includes outcomes such as increase in sales, increases in sales team productivity, increased rates of customer retention and satisfaction, return on investment, and shortened sales cycle. Deliver an awe inspiring pitch with this creative CRM System Implementation Stages Postimplementation Impacts On Company Sales Graphics PDF bundle. Topics like Data Accessibility, Team Productivity, Increase In Sales can be discussed with this completely editable template. It is available for immediate download depending on the needs and requirements of the user.
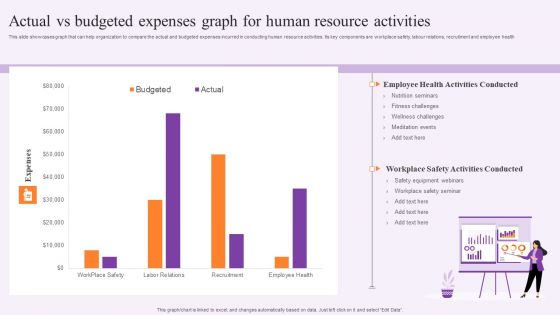
Actual Vs Budgeted Expenses Graph For Human Resource Activities Guidelines PDF
This slide showcases graph that can help organization to compare the actual and budgeted expenses incurred in conducting human resource activities. Its key components are workplace safety, labour relations, recruitment and employee health. Showcasing this set of slides titled Actual Vs Budgeted Expenses Graph For Human Resource Activities Guidelines PDF. The topics addressed in these templates are Safety Equipment Webinars, Employee, Expenses. All the content presented in this PPT design is completely editable. Download it and make adjustments in color, background, font etc. as per your unique business setting.
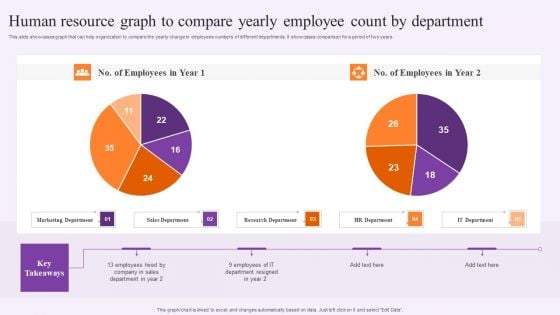
Human Resource Graph To Compare Yearly Employee Count By Department Professional PDF
This slide showcases graph that can help organization to compare the yearly change in employees numbers of different departments. It showcases comparison for a period of two years. Showcasing this set of slides titled Human Resource Graph To Compare Yearly Employee Count By Department Professional PDF. The topics addressed in these templates are Marketing Department, Sales Department, Research Department. All the content presented in this PPT design is completely editable. Download it and make adjustments in color, background, font etc. as per your unique business setting.
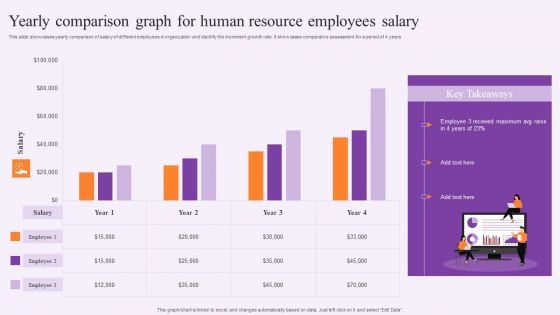
Yearly Comparison Graph For Human Resource Employees Salary Template PDF
This slide showcases yearly comparison of salary of different employees in organization and identify the increment growth rate. It showcases comparative assessment for a period of 4 years. Pitch your topic with ease and precision using this Yearly Comparison Graph For Human Resource Employees Salary Template PDF. This layout presents information on Human Resource, Employees Salary. It is also available for immediate download and adjustment. So, changes can be made in the color, design, graphics or any other component to create a unique layout.
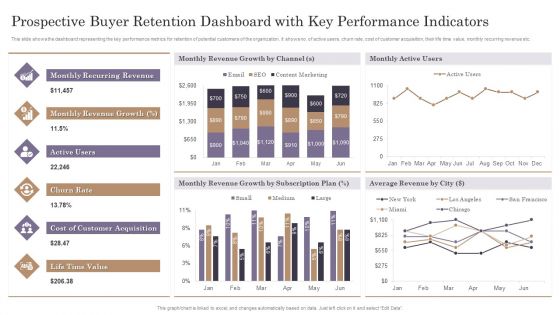
Prospective Buyer Retention Dashboard With Key Performance Indicators Themes PDF
This slide shows the dashboard representing the key performance metrics for retention of potential customers of the organization. It shows no. of active users, churn rate, cost of customer acquisition, their life time value, monthly recurring revenue etc.Pitch your topic with ease and precision using this Prospective Buyer Retention Dashboard With Key Performance Indicators Themes PDF. This layout presents information on Recurring Revenue, Revenue Growth, Customer Acquisition. It is also available for immediate download and adjustment. So, changes can be made in the color, design, graphics or any other component to create a unique layout.
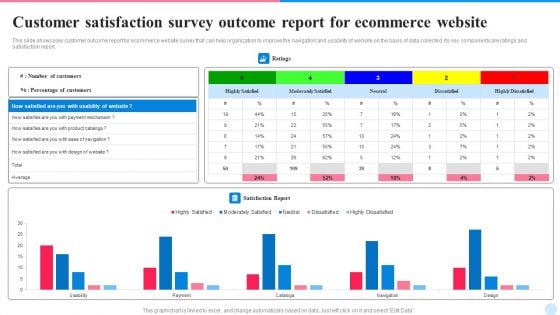
Customer Satisfaction Survey Outcome Report For Ecommerce Website Themes PDF
This slide showcases customer outcome report for ecommerce website survey that can help organization to improve the navigation and usability of website on the basis of data collected. Its key components are ratings and satisfaction report. Pitch your topic with ease and precision using this Customer Satisfaction Survey Outcome Report For Ecommerce Website Themes PDF. This layout presents information on Customer Satisfaction, Survey Outcome Report, Ecommerce Website. It is also available for immediate download and adjustment. So, changes can be made in the color, design, graphics or any other component to create a unique layout.
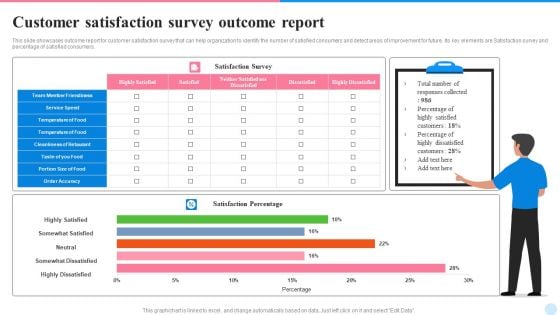
Customer Satisfaction Survey Outcome Report Template PDF
This slide showcases outcome report for customer satisfaction survey that can help organization to identify the number of satisfied consumers and detect areas of improvement for future. Its key elements are Satisfaction survey and percentage of satisfied consumers. Showcasing this set of slides titled Customer Satisfaction Survey Outcome Report Template PDF. The topics addressed in these templates are Customers, Satisfaction Survey, Service Speed. All the content presented in this PPT design is completely editable. Download it and make adjustments in color, background, font etc. as per your unique business setting.
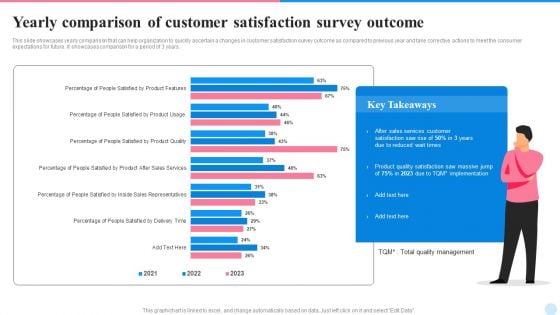
Yearly Comparison Of Customer Satisfaction Survey Outcome Demonstration PDF
This slide showcases yearly comparison that can help organization to quickly ascertain a changes in customer satisfaction survey outcome as compared to previous year and take corrective actions to meet the consumer expectations for future. It showcases comparison for a period of 3 years. Showcasing this set of slides titled Yearly Comparison Of Customer Satisfaction Survey Outcome Demonstration PDF. The topics addressed in these templates are Sales Services Customer, Implementation, Product Quality Satisfaction. All the content presented in this PPT design is completely editable. Download it and make adjustments in color, background, font etc. as per your unique business setting.
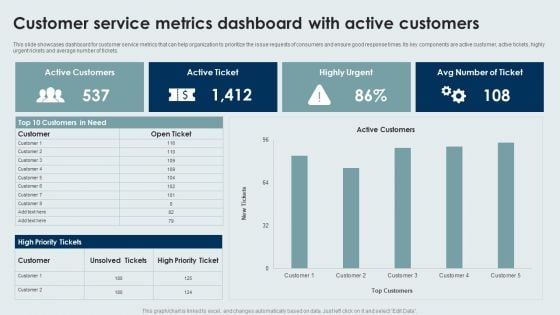
Customer Service Metrics Dashboard With Active Customers Ideas PDF
This slide showcases dashboard for customer service metrics that can help organization to prioritize the issue requests of consumers and ensure good response times. Its key components are active customer, active tickets, highly urgent rickets and average number of tickets. Showcasing this set of slides titled Customer Service Metrics Dashboard With Active Customers Ideas PDF. The topics addressed in these templates are Customer Service, Metrics Dashboard, Active Customers. All the content presented in this PPT design is completely editable. Download it and make adjustments in color, background, font etc. as per your unique business setting.
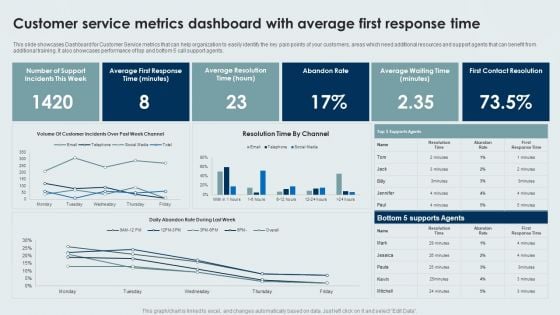
Customer Service Metrics Dashboard With Average First Response Time Background PDF
This slide showcases Dashboard for Customer Service metrics that can help organization to easily identify the key pain points of your customers, areas which need additional resources and support agents that can benefit from additional training. It also showcases performance of top and bottom 5 call support agents. Pitch your topic with ease and precision using this Customer Service Metrics Dashboard With Average First Response Time Background PDF. This layout presents information on Average, Abandon Rate, Contact Resolution. It is also available for immediate download and adjustment. So, changes can be made in the color, design, graphics or any other component to create a unique layout.
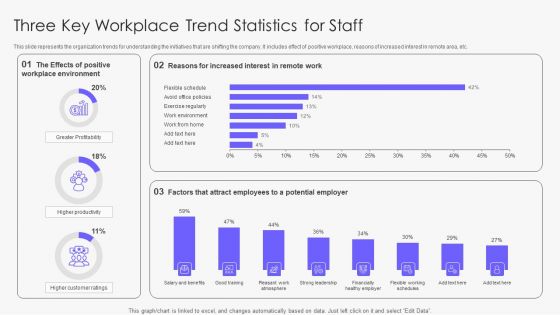
Three Key Workplace Trend Statistics For Staff Slides PDF
This slide represents the organization trends for understanding the initiatives that are shifting the company. It includes effect of positive workplace, reasons of increased interest in remote area, etc. Pitch your topic with ease and precision using this Three Key Workplace Trend Statistics For Staff Slides PDF. This layout presents information on Workplace Environment, Greater Profitability, Customer. It is also available for immediate download and adjustment. So, changes can be made in the color, design, graphics or any other component to create a unique layout.
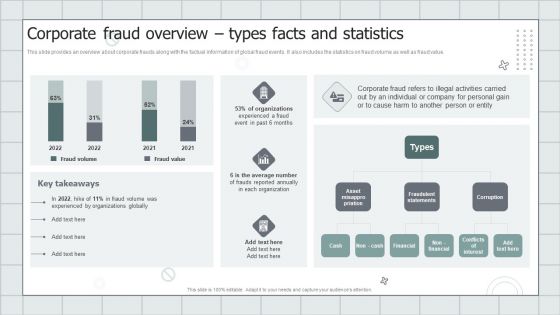
Fraud Avoidance Playbook Corporate Fraud Overview Types Facts And Statistics Introduction PDF
This slide provides an overview about corporate frauds along with the factual information of global fraud events. It also includes the statistics on fraud volume as well as fraud value. Deliver and pitch your topic in the best possible manner with this Fraud Avoidance Playbook Corporate Fraud Overview Types Facts And Statistics Introduction PDF. Use them to share invaluable insights on Organizations, Average, Fraudulent Statements and impress your audience. This template can be altered and modified as per your expectations. So, grab it now.
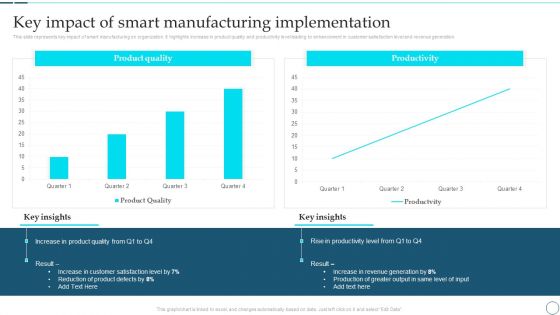
Deployment Of Smart Factory Solutions Key Impact Of Smart Manufacturing Implementation Download PDF
This slide represents key impact of smart manufacturing on organization. It highlights increase in product quality and productivity level leading to enhancement in customer satisfaction level and revenue generation. Deliver and pitch your topic in the best possible manner with this Deployment Of Smart Factory Solutions Key Impact Of Smart Manufacturing Implementation Download PDF. Use them to share invaluable insights on Product Quality, Customer Satisfaction, Product Defects, Revenue and impress your audience. This template can be altered and modified as per your expectations. So, grab it now.
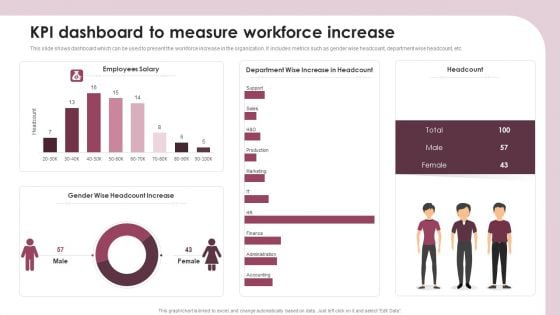
KPI Dashboard To Measure Workforce Increase Ppt Slides Elements PDF
This slide shows dashboard which can be used to present the workforce increase in the organization. It includes metrics such as gender wise headcount, department wise headcount, etc. Showcasing this set of slides titled KPI Dashboard To Measure Workforce Increase Ppt Slides Elements PDF. The topics addressed in these templates are Employees Salary, Headcount, Gender Wise, Headcount Increase. All the content presented in this PPT design is completely editable. Download it and make adjustments in color, background, font etc. as per your unique business setting.
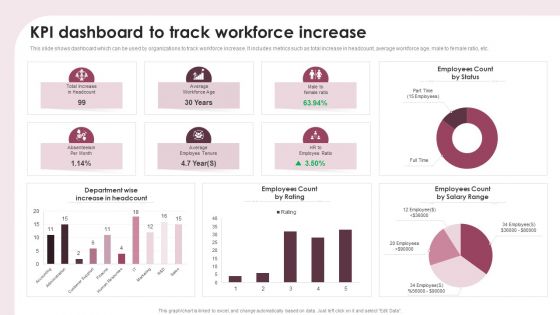
KPI Dashboard To Track Workforce Increase Ppt Show Portfolio PDF
This slide shows dashboard which can be used by organizations to track workforce increase. It includes metrics such as total increase in headcount, average workforce age, male to female ratio, etc. Pitch your topic with ease and precision using this KPI Dashboard To Track Workforce Increase Ppt Show Portfolio PDF. This layout presents information on Department Wise, Increase Headcount, Employees Count Rating. It is also available for immediate download and adjustment. So, changes can be made in the color, design, graphics or any other component to create a unique layout.
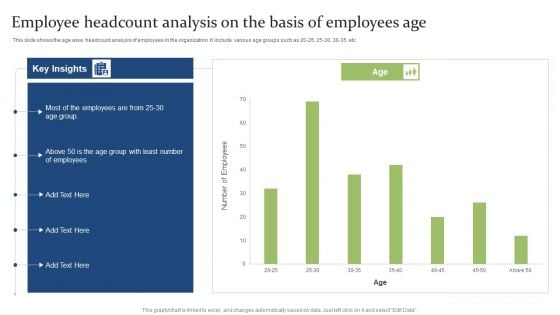
Employee Headcount Analysis On The Basis Of Employees Age Ppt PowerPoint Presentation Model Ideas PDF
This slide shows the age wise headcount analysis of employees in the organization. It include various age groups such as 20 25, 25 30, 30 35, etc.Pitch your topic with ease and precision using this Employee Headcount Analysis On The Basis Of Employees Age Ppt PowerPoint Presentation Model Ideas PDF. This layout presents information on Employee Headcount, Analysis Basis, Employees Age. It is also available for immediate download and adjustment. So, changes can be made in the color, design, graphics or any other component to create a unique layout.
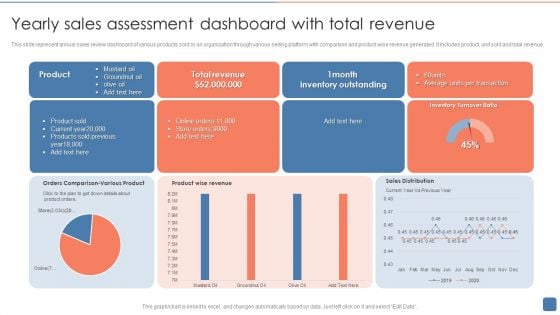
Yearly Sales Assessment Dashboard With Total Revenue Introduction PDF
This slide represent annual sales review dashboard of various products sold by an organization through various selling platform with comparison and product wise revenue generated .It includes product, unit sold and total revenue. Showcasing this set of slides titled Yearly Sales Assessment Dashboard With Total Revenue Introduction PDF. The topics addressed in these templates are Product Sold, Inventory Outstanding, Average. All the content presented in this PPT design is completely editable. Download it and make adjustments in color, background, font etc. as per your unique business setting.
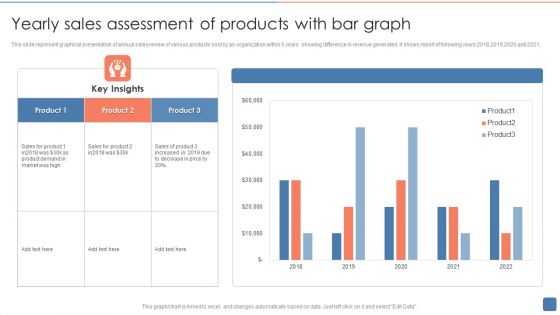
Yearly Sales Assessment Of Products With Bar Graph Structure PDF
This slide represent graphical presentation of annual sales review of various products sold by an organization within 5 years showing difference in revenue generated .It shows report of following years 2018,2019,2020,and 2021. Showcasing this set of slides titled Yearly Sales Assessment Of Products With Bar Graph Structure PDF. The topics addressed in these templates are Product, Sales Of Product, Product Demand. All the content presented in this PPT design is completely editable. Download it and make adjustments in color, background, font etc. as per your unique business setting.
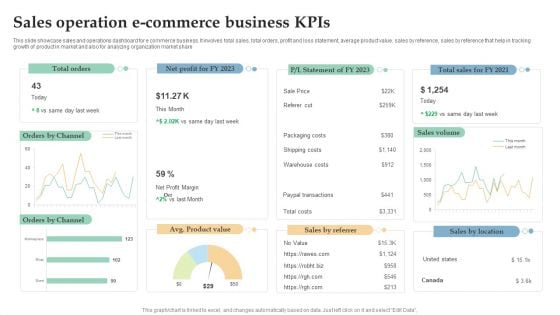
Sales Operation E Commerce Business Kpis Ppt Infographics Design Templates PDF
This slide showcase sales and operations dashboard for e commerce business. It involves total sales, total orders, profit and loss statement, average product value, sales by reference, sales by reference that help in tracking growth of product in market and also for analyzing organization market share. Pitch your topic with ease and precision using this Sales Operation E Commerce Business Kpis Ppt Infographics Design Templates PDF. This layout presents information on Total Orders, Sales Volume, Orders Channel. It is also available for immediate download and adjustment. So, changes can be made in the color, design, graphics or any other component to create a unique layout.
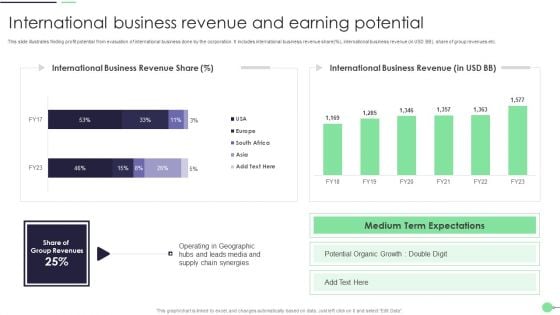
International Business Revenue And Earning Potential Guidelines PDF
This slide illustrates finding profit potential from evaluation of international business done by the corporation. It includes international business revenue share percent, international business revenue in USD BB, share of group revenues etc. Pitch your topic with ease and precision using this International Business Revenue And Earning Potential Guidelines PDF. This layout presents information on Potential Organic Growth, Supply Chain. It is also available for immediate download and adjustment. So, changes can be made in the color, design, graphics or any other component to create a unique layout.
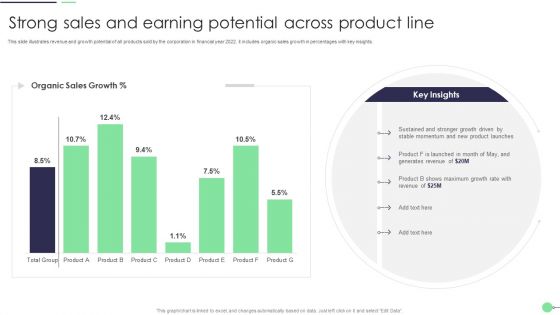
Strong Sales And Earning Potential Across Product Line Professional PDF
This slide illustrates revenue and growth potential of all products sold by the corporation in financial year 2022. it includes organic sales growth in percentages with key insights. Showcasing this set of slides titled Strong Sales And Earning Potential Across Product Line Professional PDF. The topics addressed in these templates are Product Launches, Generates Revenue, Growth Rate. All the content presented in this PPT design is completely editable. Download it and make adjustments in color, background, font etc. as per your unique business setting.
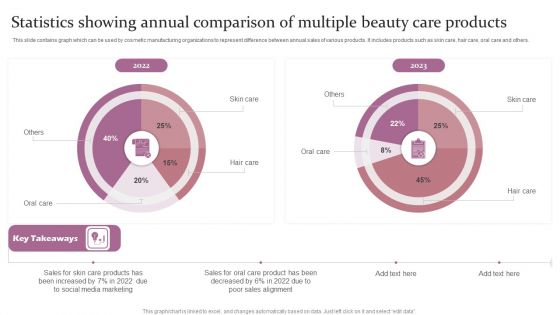
Statistics Showing Annual Comparison Of Multiple Beauty Care Products Ppt Infographics Objects PDF
This slide contains graph which can be used by cosmetic manufacturing organizations to represent difference between annual sales of various products. It includes products such as skin care, hair care, oral care and others. Showcasing this set of slides titled Statistics Showing Annual Comparison Of Multiple Beauty Care Products Ppt Infographics Objects PDF. The topics addressed in these templates are Skin Care, Hair Care, 2022 To 2023. All the content presented in this PPT design is completely editable. Download it and make adjustments in color, background, font etc. as per your unique business setting.
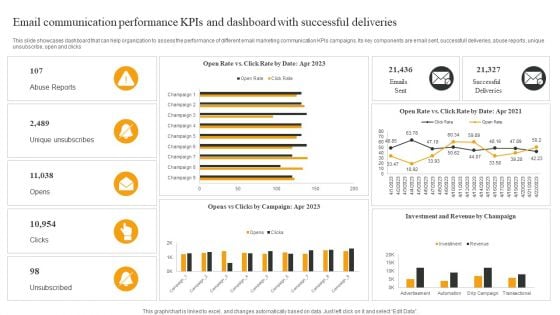
Email Communication Performance Kpis And Dashboard With Successful Deliveries Elements PDF
This slide showcases dashboard that can help organization to assess the performance of different email marketing communication KPIs campaigns. Its key components are email sent, successfull deliveries, abuse reports, unique unsubscribe, open and clicks. Showcasing this set of slides titled Email Communication Performance Kpis And Dashboard With Successful Deliveries Elements PDF. The topics addressed in these templates are Abuse Reports, Unique Unsubscribes, Opens. All the content presented in this PPT design is completely editable. Download it and make adjustments in color, background, font etc. as per your unique business setting.
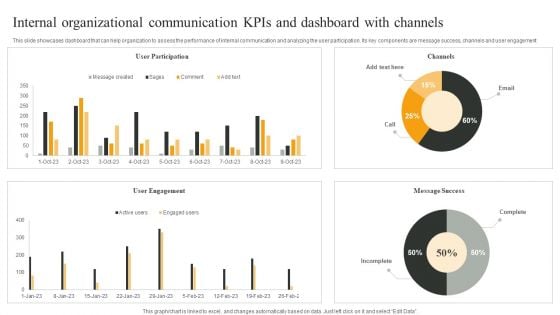
Internal Organizational Communication Kpis And Dashboard With Channels Infographics PDF
This slide showcases dashboard that can help organization to assess the performance of internal communication and analyzing the user participation. Its key components are message success, channels and user engagement. Pitch your topic with ease and precision using this Internal Organizational Communication Kpis And Dashboard With Channels Infographics PDF. This layout presents information on User Participation, User Engagement, Message Success. It is also available for immediate download and adjustment. So, changes can be made in the color, design, graphics or any other component to create a unique layout.
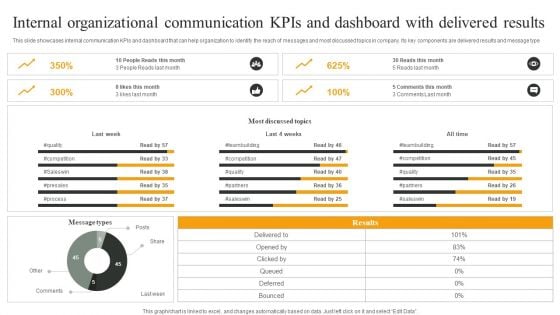
Internal Organizational Communication Kpis And Dashboard With Delivered Results Designs PDF
This slide showcases internal communication KPIs and dashboard that can help organization to identify the reach of messages and most discussed topics in company. Its key components are delivered results and message type. Showcasing this set of slides titled Internal Organizational Communication Kpis And Dashboard With Delivered Results Designs PDF. The topics addressed in these templates are Most Discussed Topics, All Time, Last Week. All the content presented in this PPT design is completely editable. Download it and make adjustments in color, background, font etc. as per your unique business setting.
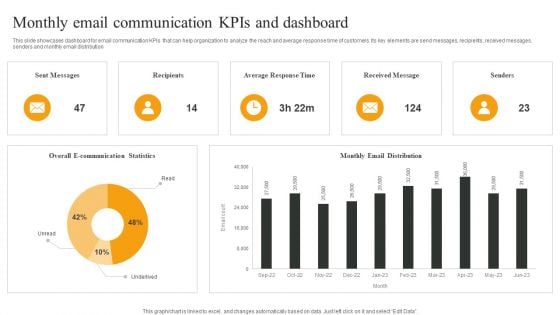
Monthly Email Communication Kpis And Dashboard Download PDF
This slide showcases dashboard for email communication KPIs that can help organization to analyze the reach and average response time of customers. Its key elements are send messages, recipients, received messages, senders and monthly email distribution. Pitch your topic with ease and precision using this Monthly Email Communication Kpis And Dashboard Download PDF. This layout presents information on Sent Messages, Recipients, Average Response Time, Received Message. It is also available for immediate download and adjustment. So, changes can be made in the color, design, graphics or any other component to create a unique layout.
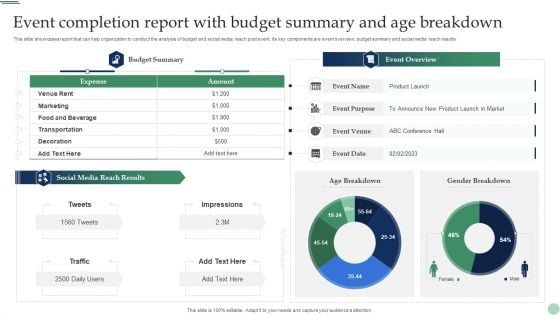
Event Completion Report With Budget Summary And Age Breakdown Elements PDF
This slide showcases report that can help organization to conduct the analysis of budget and social media reach post event. Its key components are event overview, budget summary and social media reach results. Showcasing this set of slides titled Event Completion Report With Budget Summary And Age Breakdown Elements PDF. The topics addressed in these templates are Social Media Reach Results, Event Overview, Age Breakdown. All the content presented in this PPT design is completely editable. Download it and make adjustments in color, background, font etc. as per your unique business setting.
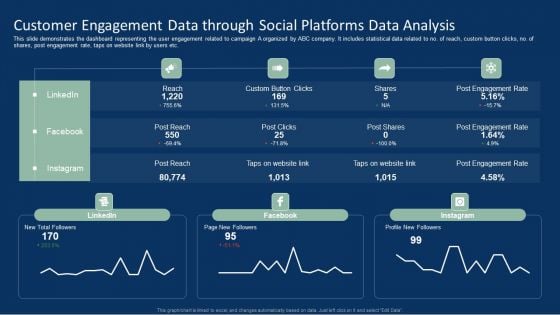
Customer Engagement Data Through Social Platforms Data Analysis Brochure PDF
This slide demonstrates the dashboard representing the user engagement related to campaign A organized by ABC company. It includes statistical data related to no. of reach, custom button clicks, no. of shares, post engagement rate, taps on website link by users etc. Showcasing this set of slides titled Customer Engagement Data Through Social Platforms Data Analysis Brochure PDF. The topics addressed in these templates are Customer Engagement Data, Social Platforms Data Analysis. All the content presented in this PPT design is completely editable. Download it and make adjustments in color, background, font etc. as per your unique business setting.
Business Operational Expenditure Monitoring Dashboard With Budget Analysis Icons PDF
This slide shows operating expenses OPEX monitoring dashboard with budget analysis assisting companies in evaluating funds useful until end of the year. It visually present the organizations operating expenses by time period and sector. Showcasing this set of slides titled Business Operational Expenditure Monitoring Dashboard With Budget Analysis Icons PDF. The topics addressed in these templates are Business Operational, Budget Analysis, Monitoring Dashboard. All the content presented in this PPT design is completely editable. Download it and make adjustments in color, background, font etc. as per your unique business setting.
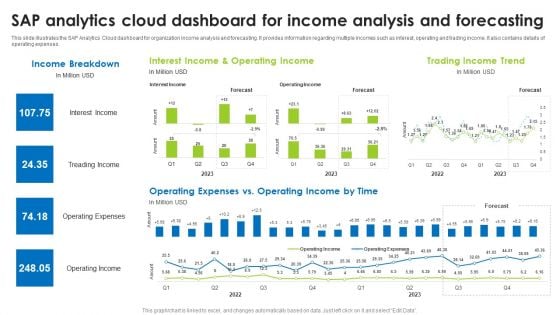
Sap Analytics Cloud Dashboard For Income Analysis And Forecasting Formats PDF
This slide illustrates the SAP Analytics Cloud dashboard for organization income analysis and forecasting. It provides information regarding multiple incomes such as interest, operating and trading income. It also contains details of operating expenses. The best PPT templates are a great way to save time, energy, and resources. Slidegeeks have 100 percent editable powerpoint slides making them incredibly versatile. With these quality presentation templates, you can create a captivating and memorable presentation by combining visually appealing slides and effectively communicating your message. Download Sap Analytics Cloud Dashboard To Asses Digital Marketing Campaigns Performance Ideas PDF from Slidegeeks and deliver a wonderful presentation.
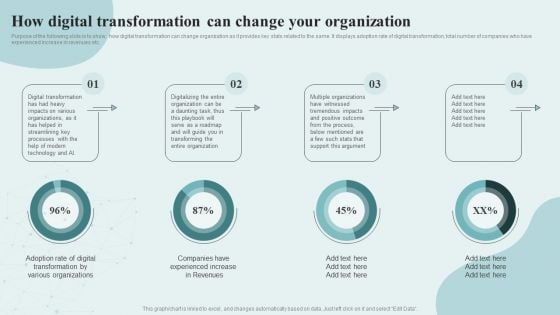
Digital Competency Evaluation And Modification How Digital Transformation Can Change Your Formats PDF
Purpose of the following slide is to show, how digital transformation can change organization as it provides key stats related to the same. It displays adoption rate of digital transformation, total number of companies who have experienced increase in revenues etc. There are so many reasons you need a Digital Competency Evaluation And Modification How Digital Transformation Can Change Your Formats PDF. The first reason is you cant spend time making everything from scratch, Thus, Slidegeeks has made presentation templates for you too. You can easily download these templates from our website easily.
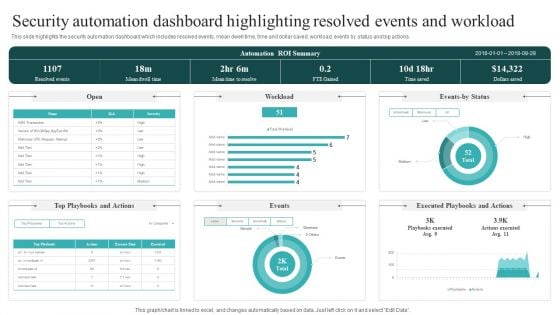
Security Automation Dashboard Highlighting Resolved Events And Workload Guidelines PDF
This slide highlights the security automation dashboard which includes resolved events, mean dwell time, time and dollar saved, workload, events by status and top actions. This Security Automation Dashboard Highlighting Resolved Events And Workload Guidelines PDF is perfect for any presentation, be it in front of clients or colleagues. It is a versatile and stylish solution for organizing your meetings. The Security Automation Dashboard Highlighting Resolved Events And Workload Guidelines PDF features a modern design for your presentation meetings. The adjustable and customizable slides provide unlimited possibilities for acing up your presentation. Slidegeeks has done all the homework before launching the product for you. So, don not wait, grab the presentation templates today.
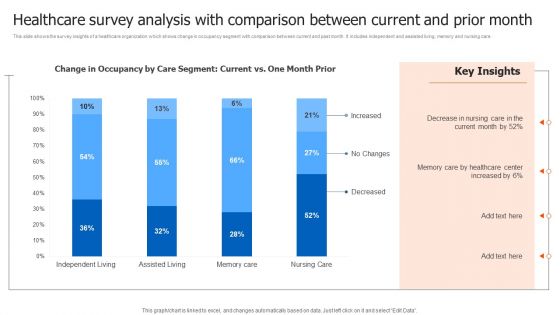
Healthcare Survey Analysis With Comparison Between Current And Prior Month Infographics PDF
This slide shows the survey insights of a healthcare organization which shows change in occupancy segment with comparison between current and past month. It includes independent and assisted living, memory and nursing care. Showcasing this set of slides titled Healthcare Survey Analysis With Comparison Between Current And Prior Month Infographics PDF. The topics addressed in these templates are Healthcare Survey Analysis, Comparison Between Current. All the content presented in this PPT design is completely editable. Download it and make adjustments in color, background, font etc. as per your unique business setting.
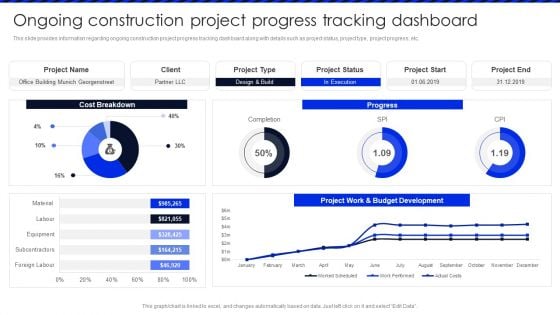
Embracing Construction Project Playbook Ongoing Construction Project Progress Clipart PDF
This slide provides information regarding ongoing construction project progress tracking dashboard along with details such as project status, project type, project progress, etc. This Embracing Construction Project Playbook Ongoing Construction Project Progress Clipart PDF is perfect for any presentation, be it in front of clients or colleagues. It is a versatile and stylish solution for organizing your meetings. The Embracing Construction Project Playbook Ongoing Construction Project Progress Clipart PDF features a modern design for your presentation meetings. The adjustable and customizable slides provide unlimited possibilities for acing up your presentation. Slidegeeks has done all the homework before launching the product for you. So, dont wait, grab the presentation templates today.
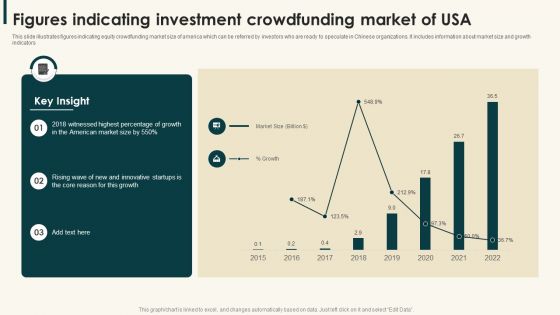
Figures Indicating Investment Crowdfunding Market Of Usa Information PDF
This slide illustrates figures indicating equity crowdfunding market size of america which can be referred by investors who are ready to speculate in Chinese organizations. It includes information about market size and growth indicators,Pitch your topic with ease and precision using this Figures Indicating Investment Crowdfunding Market Of Usa Information PDF. This layout presents information on Witnessed Highest, American Market, Innovative Startups. It is also available for immediate download and adjustment. So, changes can be made in the color, design, graphics or any other component to create a unique layout.
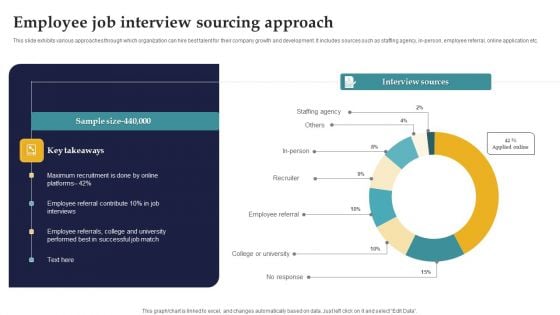
Employee Job Interview Sourcing Approach Ppt Model Layouts PDF
This slide exhibits various approaches through which organization can hire best talent for their company growth and development. It includes sources such as staffing agency, in-person, employee referral, online application etc. Showcasing this set of slides titled Employee Job Interview Sourcing Approach Ppt Model Layouts PDF. The topics addressed in these templates are Interview Sources, Staffing Agency, Employee Referral. All the content presented in this PPT design is completely editable. Download it and make adjustments in color, background, font etc. as per your unique business setting.
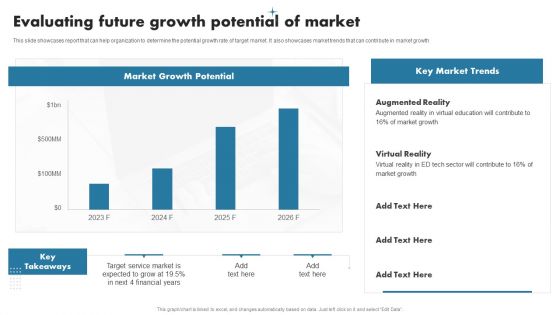
Enhancing Customer Outreach Evaluating Future Growth Potential Of Market Pictures PDF
This slide showcases report that can help organization to determine the potential growth rate of target market. It also showcases market trends that can contribute in market growth. Slidegeeks is one of the best resources for PowerPoint templates. You can download easily and regulate Enhancing Customer Outreach Evaluating Future Growth Potential Of Market Pictures PDF for your personal presentations from our wonderful collection. A few clicks is all it takes to discover and get the most relevant and appropriate templates. Use our Templates to add a unique zing and appeal to your presentation and meetings. All the slides are easy to edit and you can use them even for advertisement purposes.
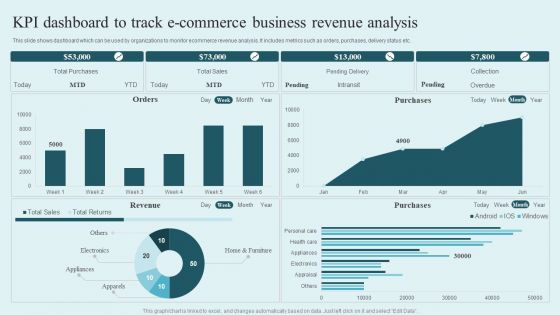
KPI Dashboard To Track E Commerce Business Revenue Analysis Rules PDF
This slide shows dashboard which can be used by organizations to monitor ecommerce revenue analysis. It includes metrics such as orders, purchases, delivery status etc. Pitch your topic with ease and precision using this KPI Dashboard To Track E Commerce Business Revenue Analysis Rules PDF. This layout presents information on Total Purchases, Total Sales, Pending Delivery, Collection. It is also available for immediate download and adjustment. So, changes can be made in the color, design, graphics or any other component to create a unique layout.
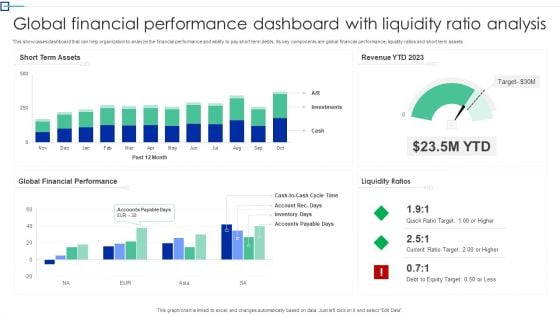
Global Financial Performance Dashboard With Liquidity Ratio Analysis Information PDF
This showcases dashboard that can help organization to analyze the financial performance and ability to pay short term debts. Its key components are global financial performance, liquidity ratios and short term assets. Pitch your topic with ease and precision using this Global Financial Performance Dashboard With Liquidity Ratio Analysis Information PDF. This layout presents information on Short Term Assets, Global Financial Performance, Liquidity Ratios. It is also available for immediate download and adjustment. So, changes can be made in the color, design, graphics or any other component to create a unique layout.
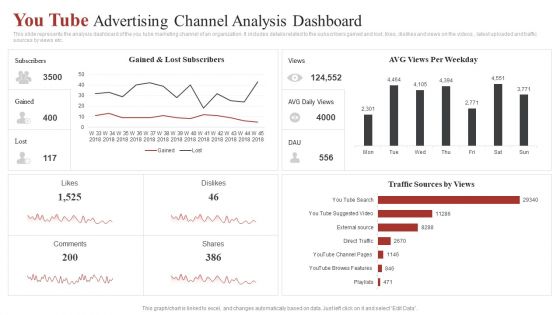
You Tube Advertising Channel Analysis Dashboard Ppt Gallery Clipart Images PDF
This slide represents the analysis dashboard of the you tube marketing channel of an organization. It includes details related to the subscribers gained and lost, likes, dislikes and views on the videos , latest uploaded and traffic sources by views etc. Pitch your topic with ease and precision using this You Tube Advertising Channel Analysis Dashboard Ppt Gallery Clipart Images PDF. This layout presents information on AVG Views, Per Weekday, Traffic Sources Views . It is also available for immediate download and adjustment. So, changes can be made in the color, design, graphics or any other component to create a unique layout.
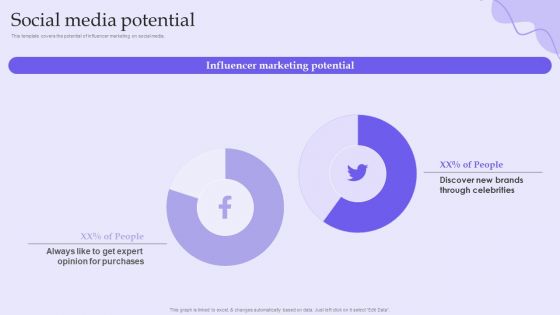
Online Marketing And Social Media Platforms Pitch Deck Social Media Potential Introduction PDF
This template covers the potential of influencer marketing on social media. This Online Marketing And Social Media Platforms Pitch Deck Social Media Potential Introduction PDF is perfect for any presentation, be it in front of clients or colleagues. It is a versatile and stylish solution for organizing your meetings. The Online Marketing And Social Media Platforms Pitch Deck Social Media Potential Introduction PDF features a modern design for your presentation meetings. The adjustable and customizable slides provide unlimited possibilities for acing up your presentation. Slidegeeks has done all the homework before launching the product for you. So, do not wait, grab the presentation templates today.
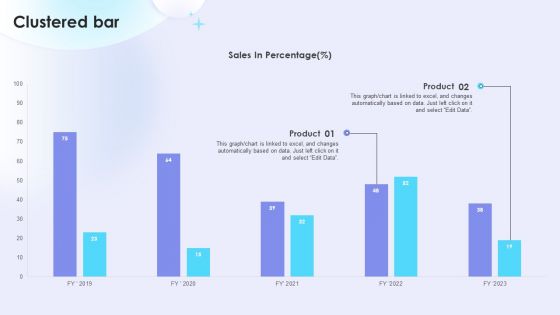
Dual Branding Campaign To Boost Sales Of Product Or Services Clustered Bar Mockup PDF
This Dual Branding Campaign To Boost Sales Of Product Or Services Clustered Bar Mockup PDF is perfect for any presentation, be it in front of clients or colleagues. It is a versatile and stylish solution for organizing your meetings. TheDual Branding Campaign To Boost Sales Of Product Or Services Clustered Bar Mockup PDF features a modern design for your presentation meetings. The adjustable and customizable slides provide unlimited possibilities for acing up your presentation. Slidegeeks has done all the homework before launching the product for you. So, do not wait, grab the presentation templates today
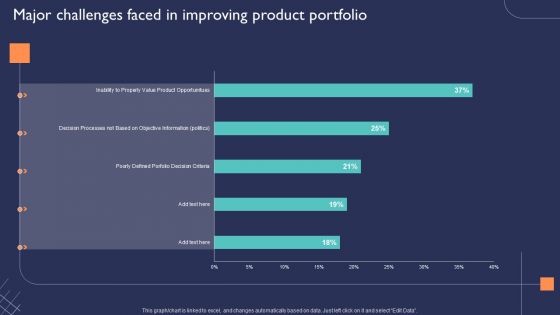
Introduction To New Product Portfolio Major Challenges Faced In Improving Product Portfolio Ppt Styles Layouts PDF
This Introduction To New Product Portfolio Major Challenges Faced In Improving Product Portfolio Ppt Styles Layouts PDF is perfect for any presentation, be it in front of clients or colleagues. It is a versatile and stylish solution for organizing your meetings. The Introduction To New Product Portfolio Major Challenges Faced In Improving Product Portfolio Ppt Styles Layouts PDF features a modern design for your presentation meetings. The adjustable and customizable slides provide unlimited possibilities for acing up your presentation. Slidegeeks has done all the homework before launching the product for you. So, do not wait, grab the presentation templates today.
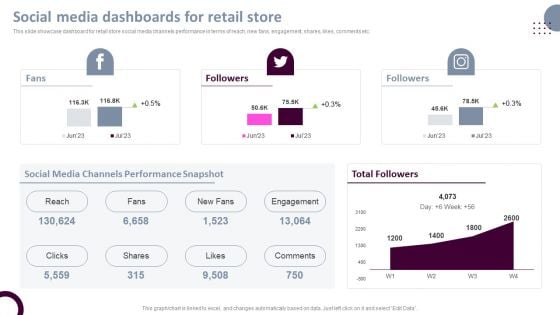
Retail Store Operations Social Media Dashboards For Retail Store Demonstration PDF
This slide showcase dashboard for retail store social media channels performance in terms of reach, new fans, engagement, shares, likes, comments etc. This Retail Store Operations Social Media Dashboards For Retail Store Demonstration PDF is perfect for any presentation, be it in front of clients or colleagues. It is a versatile and stylish solution for organizing your meetings. The Retail Store Operations Social Media Dashboards For Retail Store Demonstration PDF features a modern design for your presentation meetings. The adjustable and customizable slides provide unlimited possibilities for acing up your presentation. Slidegeeks has done all the homework before launching the product for you. So, dont wait, grab the presentation templates today
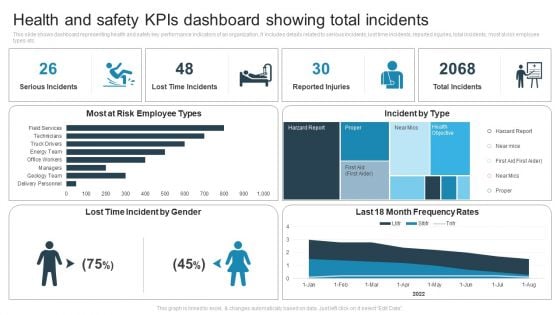
Health And Safety Kpis Dashboard Showing Total Incidents Pictures PDF
This slide shows dashboard representing health and safety key performance indicators of an organization. It includes details related to serious incidents, lost time incidents, reported injuries, total incidents, most at risk employee types etc. Showcasing this set of slides titled Health And Safety Kpis Dashboard Showing Total Incidents Pictures PDF. The topics addressed in these templates are Lost Time Incident, Most At Risk Employee, Incident By Type. All the content presented in this PPT design is completely editable. Download it and make adjustments in color, background, font etc. as per your unique business setting.
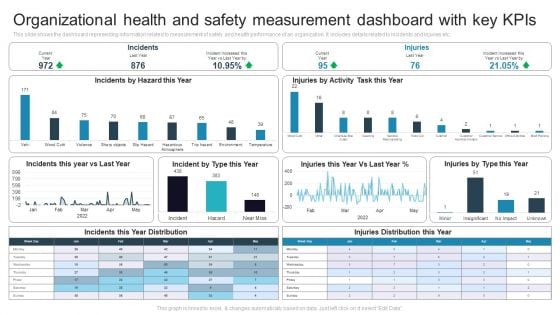
Organizational Health And Safety Measurement Dashboard With Key Kpis Microsoft PDF
This slide shows the dashboard representing information related to measurement of safety and health performance of an organization. It includes details related to incidents and injuries etc. Showcasing this set of slides titled Organizational Health And Safety Measurement Dashboard With Key Kpis Microsoft PDF. The topics addressed in these templates are Hazard This Year, Injuries By Activity, Task This Year. All the content presented in this PPT design is completely editable. Download it and make adjustments in color, background, font etc. as per your unique business setting.

Manufactured Products Sales Performance Monitoring Dashboard Information PDF
This slide shows the dashboard the data related to the sales performance of the products manufactured by the organization in order to effectively measure and monitor the performance of the sales team. It shows details related to revenue generated and units sold etc.Pitch your topic with ease and precision using this Manufactured Products Sales Performance Monitoring Dashboard Information PDF. This layout presents information on Monthly Revenue, Manufactured Products, Sales Performance Monitoring. It is also available for immediate download and adjustment. So, changes can be made in the color, design, graphics or any other component to create a unique layout.
Manufacturing Company Stock Level Performance Monitoring Dashboard Icons PDF
This slide shows the dashboard for monitoring the inventory level of the manufacturing organization. It shows details related to total stock units, total stock value, capacity and positions of stock, inventory turnover, slow moving stock etc.Showcasing this set of slides titled Manufacturing Company Stock Level Performance Monitoring Dashboard Icons PDF. The topics addressed in these templates are Stock Positions, Stock Volume, Moving Stock. All the content presented in this PPT design is completely editable. Download it and make adjustments in color, background, font etc. as per your unique business setting.
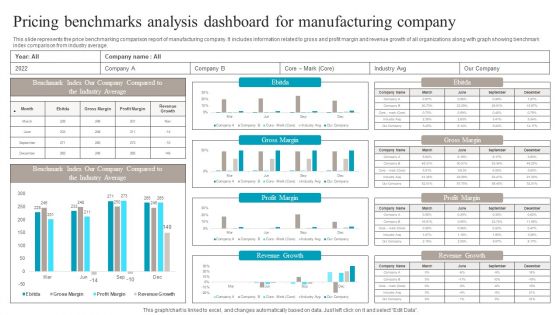
Pricing Benchmarks Analysis Dashboard For Manufacturing Company Structure PDF
This slide represents the price benchmarking comparison report of manufacturing company. It includes information related to gross and profit margin and revenue growth of all organizations along with graph showing benchmark index comparison from industry average. Pitch your topic with ease and precision using this Pricing Benchmarks Analysis Dashboard For Manufacturing Company Structure PDF. This layout presents information on Pricing Benchmarks Analysis, Dashboard For Manufacturing Company. It is also available for immediate download and adjustment. So, changes can be made in the color, design, graphics or any other component to create a unique layout.
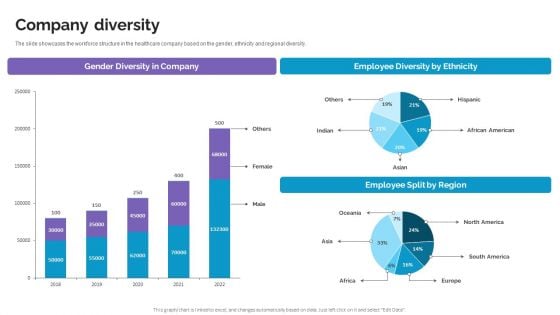
Company Diversity Life Science And Healthcare Solutions Company Profile Structure PDF
The slide showcases the workforce structure in the healthcare company based on the gender, ethnicity and regional diversity. This Company Diversity Life Science And Healthcare Solutions Company Profile Structure PDF is perfect for any presentation, be it in front of clients or colleagues. It is a versatile and stylish solution for organizing your meetings. The Company Diversity Life Science And Healthcare Solutions Company Profile Structure PDF features a modern design for your presentation meetings. The adjustable and customizable slides provide unlimited possibilities for acing up your presentation. Slidegeeks has done all the homework before launching the product for you. So, do not wait, grab the presentation templates today
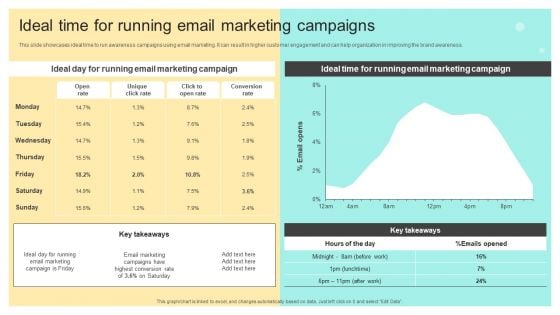
Ideal Time For Running Email Marketing Campaigns Online And Offline Brand Guidelines PDF
This slide showcases ideal time to run awareness campaigns using email marketing. It can result in higher customer engagement and can help organization in improving the brand awareness.The Ideal Time For Running Email Marketing Campaigns Online And Offline Brand Guidelines PDF is a compilation of the most recent design trends as a series of slides. It is suitable for any subject or industry presentation, containing attractive visuals and photo spots for businesses to clearly express their messages. This template contains a variety of slides for the user to input data, such as structures to contrast two elements, bullet points, and slides for written information. Slidegeeks is prepared to create an impression.
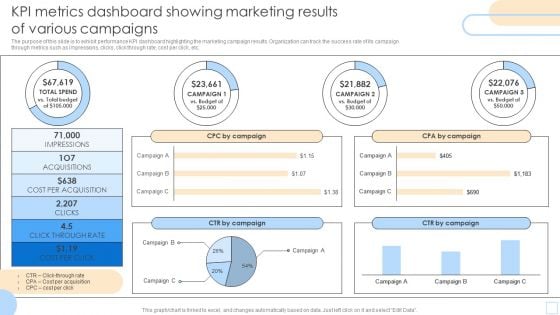
KPI Metrics Dashboard Showing Marketing Results Of Various Campaigns Pictures PDF
The purpose of this slide is to exhibit performance KPI dashboard highlighting the marketing campaign results. Organization can track the success rate of its campaign through metrics such as impressions, clicks, click through rate, cost per click, etc. Pitch your topic with ease and precision using this KPI Metrics Dashboard Showing Marketing Results Of Various Campaigns Pictures PDF. This layout presents information on Impressions, Acquisitions, CPA By Campaign. It is also available for immediate download and adjustment. So, changes can be made in the color, design, graphics or any other component to create a unique layout.
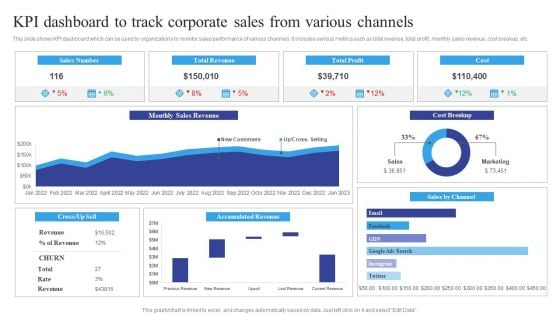
KPI Dashboard To Track Corporate Sales From Various Channels Information PDF
This slide shows KPI dashboard which can be used by organizations to monitor sales performance of various channels. It includes various metrics such as total revenue, total profit, monthly sales revenue, cost breakup, etc. Showcasing this set of slides titled KPI Dashboard To Track Corporate Sales From Various Channels Information PDF. The topics addressed in these templates are Track Corporate Sales, Various Channels. All the content presented in this PPT design is completely editable. Download it and make adjustments in color, background, font etc. as per your unique business setting.
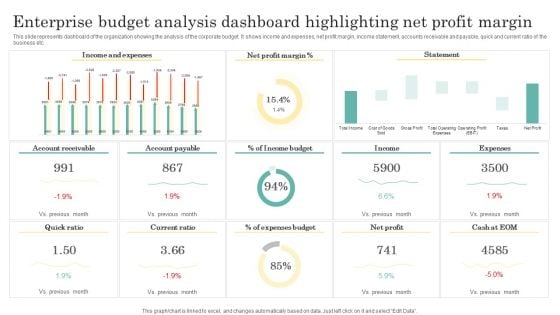
Enterprise Budget Analysis Dashboard Highlighting Net Profit Margin Clipart PDF
This slide represents dashboard of the organization showing the analysis of the corporate budget. It shows income and expenses, net profit margin, income statement, accounts receivable and payable, quick and current ratio of the business etc. Showcasing this set of slides titled Enterprise Budget Analysis Dashboard Highlighting Net Profit Margin Clipart PDF. The topics addressed in these templates are Income And Expenses, Net Profit Margin, Income Budget. All the content presented in this PPT design is completely editable. Download it and make adjustments in color, background, font etc. as per your unique business setting.
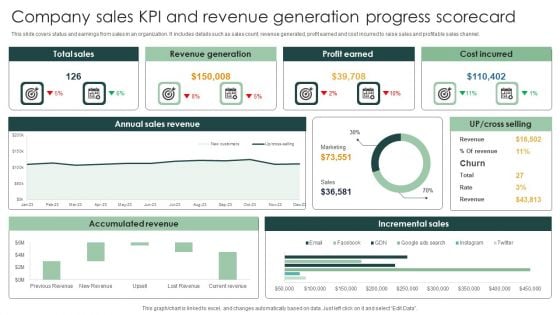
Company Sales KPI And Revenue Generation Progress Scorecard Formats PDF
This slide covers status and earnings from sales in an organization. It includes details such as sales count, revenue generated, profit earned and cost incurred to raise sales and profitable sales channel.Showcasing this set of slides titled Company Sales KPI And Revenue Generation Progress Scorecard Formats PDF. The topics addressed in these templates are Accumulated Revenue, Annual Sales Revenue, Incremental Sales. All the content presented in this PPT design is completely editable. Download it and make adjustments in color, background, font etc. as per your unique business setting.
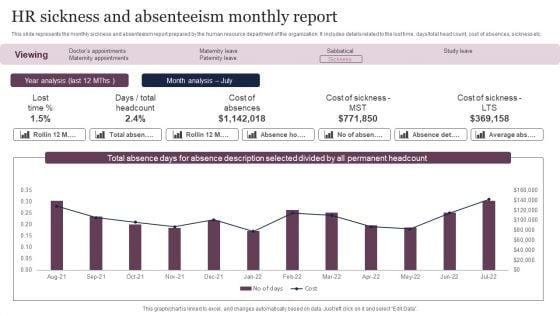
HR Sickness And Absenteeism Monthly Report Sample PDF
This slide represents the monthly sickness and absenteeism report prepared by the human resource department of the organization. It includes details related to the lost time, days or total head count, cost of absences, sickness etc. Showcasing this set of slides titled HR Sickness And Absenteeism Monthly Report Sample PDF. The topics addressed in these templates are Analysis, Cost, Hr Sickness. All the content presented in this PPT design is completely editable. Download it and make adjustments in color, background, font etc. as per your unique business setting.
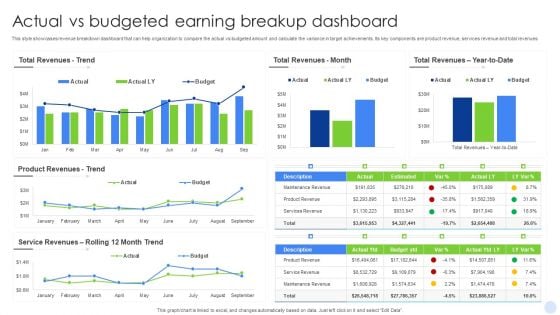
Actual Vs Budgeted Earning Breakup Dashboard Inspiration PDF
This style showcases revenue breakdown dashboard that can help organization to compare the actual vs budgeted amount and calculate the variance in target achievements. Its key components are product revenue, services revenue and total revenues. Showcasing this set of slides titled Actual Vs Budgeted Earning Breakup Dashboard Inspiration PDF. The topics addressed in these templates are Actual Vs Budgeted, Earning Breakup Dashboard. All the content presented in this PPT design is completely editable. Download it and make adjustments in color, background, font etc. as per your unique business setting.
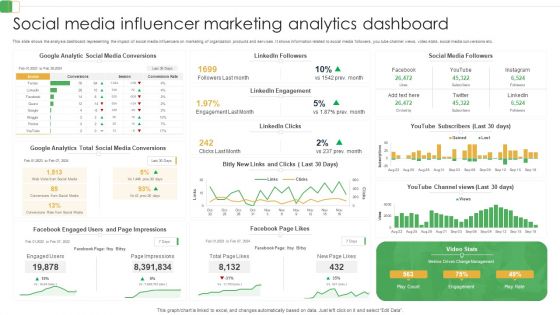
Social Media Influencer Marketing Analytics Dashboard Ppt PowerPoint Presentation File Inspiration PDF
This slide shows the analysis dashboard representing the impact of social media influencers on marketing of organization products and services. It shows information related to social media followers, you tube channel views, video stats, social media conversions etc.Showcasing this set of slides titled Social Media Influencer Marketing Analytics Dashboard Ppt PowerPoint Presentation File Inspiration PDF. The topics addressed in these templates are Linkedin Engagement, Media Conversions, Facebook Engaged. All the content presented in this PPT design is completely editable. Download it and make adjustments in color, background, font etc. as per your unique business setting.
Social Media Influencer Marketing Campaign Performance Tracking Report Ppt PowerPoint Presentation File Backgrounds PDF
This slide represents the dashboard representing the lead generation through the social media influencer marketing campaign carried out by the organization. It shows measurement of performance through key metrics of post impressions, engagements, clicks and video views etc.Showcasing this set of slides titled Social Media Influencer Marketing Campaign Performance Tracking Report Ppt PowerPoint Presentation File Backgrounds PDF. The topics addressed in these templates are Post Impressions, Post Engagements, Massages During Publishing. All the content presented in this PPT design is completely editable. Download it and make adjustments in color, background, font etc. as per your unique business setting.


 Continue with Email

 Home
Home


