Progress Dashboard
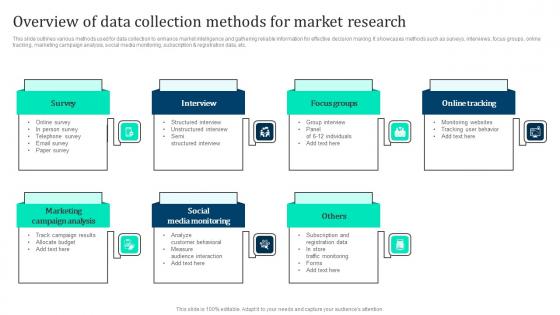
Overview Of Data Collection Methods Marketing Intelligence Guide Data Gathering Diagrams Pdf
This slide outlines various methods used for data collection to enhance market intelligence and gathering reliable information for effective decision making. It showcases methods such as surveys, interviews, focus groups, online tracking, marketing campaign analysis, social media monitoring, subscription and registration data, etc. Take your projects to the next level with our ultimate collection of Overview Of Data Collection Methods Marketing Intelligence Guide Data Gathering Diagrams Pdf. Slidegeeks has designed a range of layouts that are perfect for representing task or activity duration, keeping track of all your deadlines at a glance. Tailor these designs to your exact needs and give them a truly corporate look with your own brand colors they will make your projects stand out from the rest This slide outlines various methods used for data collection to enhance market intelligence and gathering reliable information for effective decision making. It showcases methods such as surveys, interviews, focus groups, online tracking, marketing campaign analysis, social media monitoring, subscription and registration data, etc.
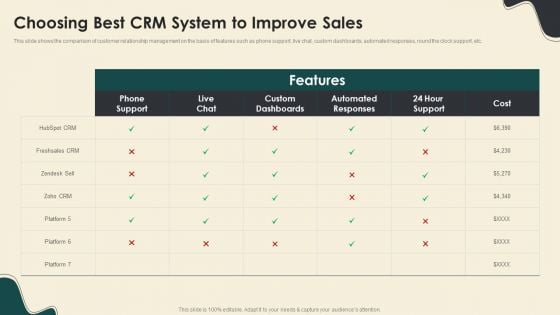
Digitally Streamline Automation Sales Operations Choosing Best CRM System To Improve Sales Background PDF
This slide shows the comparison of customer relationship management on the basis of features such as phone support, live chat, custom dashboards, automated responses, round the clock support, etc. Deliver an awe inspiring pitch with this creative Digitally Streamline Automation Sales Operations Choosing Best CRM System To Improve Sales Background PDF bundle. Topics like Custom Dashboards, Automated Responses, Cost can be discussed with this completely editable template. It is available for immediate download depending on the needs and requirements of the user.

Table Of Contents For Data Integration Strategies For Business Success
Do you have an important presentation coming up Are you looking for something that will make your presentation stand out from the rest Look no further than Table Of Contents For Data Integration Strategies For Business Success. With our professional designs, you can trust that your presentation will pop and make delivering it a smooth process. And with Slidegeeks, you can trust that your presentation will be unique and memorable. So why wait Grab Table Of Contents For Data Integration Strategies For Business Success today and make your presentation stand out from the rest Our Table Of Contents For Data Integration Strategies For Business Success are topically designed to provide an attractive backdrop to any subject. Use them to look like a presentation pro.
Magnifying Glass Ppt PowerPoint Presentation Outline Clipart Images
This is a magnifying glass ppt powerpoint presentation outline clipart images. This is a one stage process. The stages in this process are business, marketing, success, data analysis, technology.
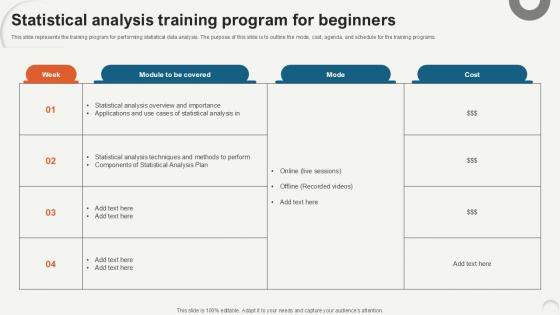
Statistical Analysis Training Program Data Analytics For Informed Decision Ppt Template
This slide represents the training program for performing statistical data analysis. The purpose of this slide is to outline the mode, cost, agenda, and schedule for the training programs. Take your projects to the next level with our ultimate collection of Statistical Analysis Training Program Data Analytics For Informed Decision Ppt Template. Slidegeeks has designed a range of layouts that are perfect for representing task or activity duration, keeping track of all your deadlines at a glance. Tailor these designs to your exact needs and give them a truly corporate look with your own brand colors they will make your projects stand out from the rest This slide represents the training program for performing statistical data analysis. The purpose of this slide is to outline the mode, cost, agenda, and schedule for the training programs.
Consumer Partition Analysis And Reporting Icon Graphics PDF
Presenting Consumer Partition Analysis And Reporting Icon Graphics PDF to dispense important information. This template comprises four stages. It also presents valuable insights into the topics including Consumer Partition Analysis, Reporting Icon. This is a completely customizable PowerPoint theme that can be put to use immediately. So, download it and address the topic impactfully.
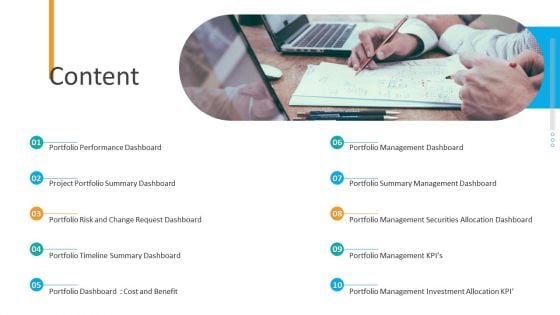
Organizational Financial Assets Assessment Content Formats PDF
This is a organizational financial assets assessment content formats pdf. template with various stages. Focus and dispense information on ten stages using this creative set, that comes with editable features. It contains large content boxes to add your information on topics like portfolio performance dashboard, project portfolio summary dashboard. You can also showcase facts, figures, and other relevant content using this PPT layout. Grab it now.
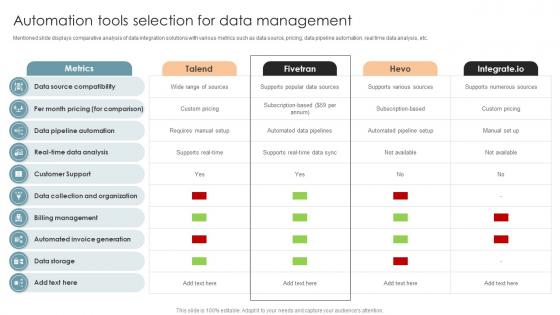
Automation Tools Selection For Data Management Office Process Optimization To Increase Cost Efficiency
Mentioned slide displays comparative analysis of data integration solutions with various metrics such as data source, pricing, data pipeline automation, real time data analysis, etc.There are so many reasons you need a Automation Tools Selection For Data Management Office Process Optimization To Increase Cost Efficiency. The first reason is you can not spend time making everything from scratch, Thus, Slidegeeks has made presentation templates for you too. You can easily download these templates from our website easily. Mentioned slide displays comparative analysis of data integration solutions with various metrics such as data source, pricing, data pipeline automation, real time data analysis, etc.
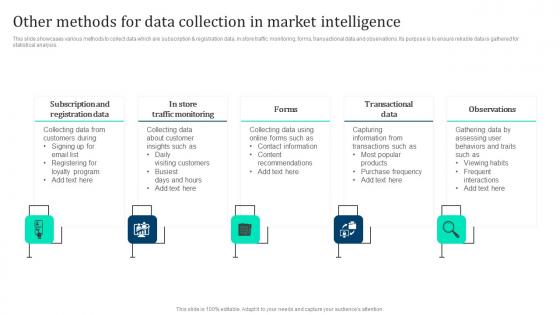
Other Methods Data Collection Marketing Intelligence Guide Data Gathering Graphics Pdf
This slide showcases various methods to collect data which are subscription and registration data, in store traffic monitoring, forms, transactional data and observations. Its purpose is to ensure reliable data is gathered for statistical analysis. Here you can discover an assortment of the finest PowerPoint and Google Slides templates. With these templates, you can create presentations for a variety of purposes while simultaneously providing your audience with an eye catching visual experience. Download Other Methods Data Collection Marketing Intelligence Guide Data Gathering Graphics Pdf to deliver an impeccable presentation. These templates will make your job of preparing presentations much quicker, yet still, maintain a high level of quality. Slidegeeks has experienced researchers who prepare these templates and write high quality content for you. Later on, you can personalize the content by editing the Other Methods Data Collection Marketing Intelligence Guide Data Gathering Graphics Pdf. This slide showcases various methods to collect data which are subscription and registration data, in store traffic monitoring, forms, transactional data and observations. Its purpose is to ensure reliable data is gathered for statistical analysis.
Recent BI Analysis Trends For Performance Enhancements Icons Pdf
This slide showcases the recent trends in BI analytics for business performance enhancement. This includes trends like augmented analytics, data discovery, data storytelling, Data quality management, etc. Pitch your topic with ease and precision using this Recent BI Analysis Trends For Performance Enhancements Icons Pdf. This layout presents information on Collaborative Business Intelligence, Embedded Analytics, Data Governance. It is also available for immediate download and adjustment. So, changes can be made in the color, design, graphics or any other component to create a unique layout. This slide showcases the recent trends in BI analytics for business performance enhancement. This includes trends like augmented analytics, data discovery, data storytelling, Data quality management, etc.

Table Of Contents Process Advancement Scheme Professional PDF
Presenting table of contents process advancement scheme professional pdf to provide visual cues and insights. Share and navigate important information on seven stages that need your due attention. This template can be used to pitch topics like current state analysis, challenges and solutions, impact project improvement, project improvement dashboard. In addtion, this PPT design contains high resolution images, graphics, etc, that are easily editable and available for immediate download.
Data And Analytics Ppt PowerPoint Presentation Icon Layouts Cpb
This is a data and analytics ppt powerpoint presentation icon layouts cpb. This is a five stage process. The stages in this process are data and analytics.
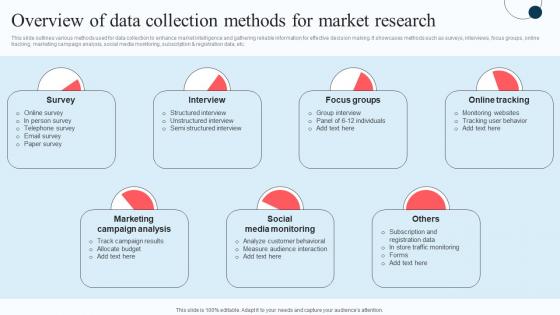
Overview Of Data Collection Methods For Execution Of Strategic Intelligence Clipart PDF
This slide outlines various methods used for data collection to enhance market intelligence and gathering reliable information for effective decision making. It showcases methods such as surveys, interviews, focus groups, online tracking, marketing campaign analysis, social media monitoring, subscription and registration data, etc. If your project calls for a presentation, then Slidegeeks is your go-to partner because we have professionally designed, easy-to-edit templates that are perfect for any presentation. After downloading, you can easily edit Overview Of Data Collection Methods For Execution Of Strategic Intelligence Clipart PDF and make the changes accordingly. You can rearrange slides or fill them with different images. Check out all the handy templates This slide outlines various methods used for data collection to enhance market intelligence and gathering reliable information for effective decision making. It showcases methods such as surveys, interviews, focus groups, online tracking, marketing campaign analysis, social media monitoring, subscription and registration data, etc.
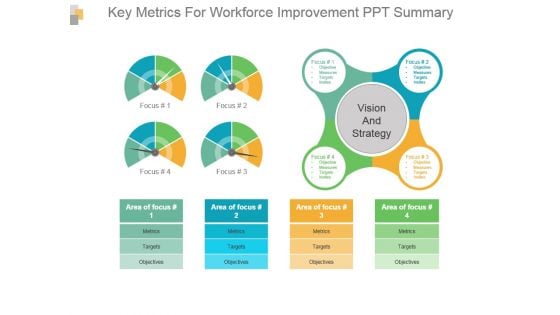
Key Metrics For Workforce Improvement Ppt Summary
This is a key metrics for workforce improvement ppt summary. This is a four stage process. The stages in this process are vision and strategy, metrics, targets, objectives, area of focus.
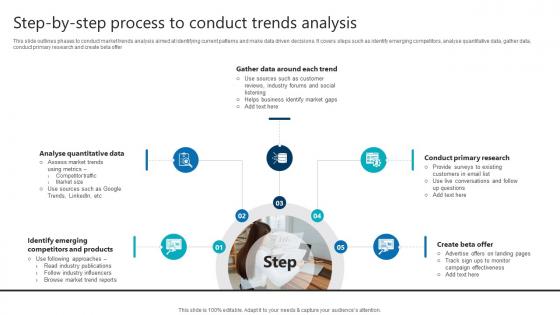
Step By Step Process To Conduct Trends Analysis Product Analytics Implementation Data Analytics V
This slide outlines phases to conduct market trends analysis aimed at identifying current patterns and make data driven decisions. It covers steps such as identify emerging competitors, analyse quantitative data, gather data, conduct primary research and create beta offerComing up with a presentation necessitates that the majority of the effort goes into the content and the message you intend to convey. The visuals of a PowerPoint presentation can only be effective if it supplements and supports the story that is being told. Keeping this in mind our experts created Step By Step Process To Conduct Trends Analysis Product Analytics Implementation Data Analytics V to reduce the time that goes into designing the presentation. This way, you can concentrate on the message while our designers take care of providing you with the right template for the situation. This slide outlines phases to conduct market trends analysis aimed at identifying current patterns and make data driven decisions. It covers steps such as identify emerging competitors, analyse quantitative data, gather data, conduct primary research and create beta offer
Data Analytics Vector Icon Ppt PowerPoint Presentation Professional
Presenting this set of slides with name data analytics vector icon ppt powerpoint presentation professional. This is a four stage process. The stages in this process are data visualization icon, research analysis, business focus. This is a completely editable PowerPoint presentation and is available for immediate download. Download now and impress your audience.
Magnifying Glass With Icons For Research Management Ppt PowerPoint Presentation Influencers
This is a magnifying glass with icons for research management ppt powerpoint presentation influencers. This is a one stage process. The stages in this process are magnifier, icons, search, business, analysis, strategy, success.
Projected Growth Data Analysis Vector Icon Ppt PowerPoint Presentation Layouts Portfolio PDF
Presenting projected growth data analysis vector icon ppt powerpoint presentation layouts portfolio pdf to dispense important information. This template comprises one stages. It also presents valuable insights into the topics including projected growth data analysis vector icon. This is a completely customizable PowerPoint theme that can be put to use immediately. So, download it and address the topic impactfully.
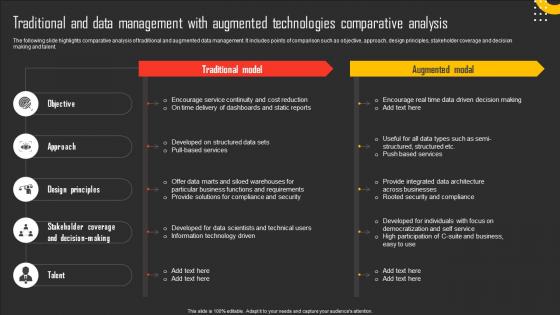
Traditional And Data Management With Augmented Technologies Comparative Analysis Professional Pdf
The following slide highlights comparative analysis of traditional and augmented data management. It includes points of comparison such as objective, approach, design principles, stakeholder coverage and decision making and talent. Pitch your topic with ease and precision using this Traditional And Data Management With Augmented Technologies Comparative Analysis Professional Pdf. This layout presents information on Objective, Approach, Design Principles. It is also available for immediate download and adjustment. So, changes can be made in the color, design, graphics or any other component to create a unique layout. The following slide highlights comparative analysis of traditional and augmented data management. It includes points of comparison such as objective, approach, design principles, stakeholder coverage and decision making and talent.
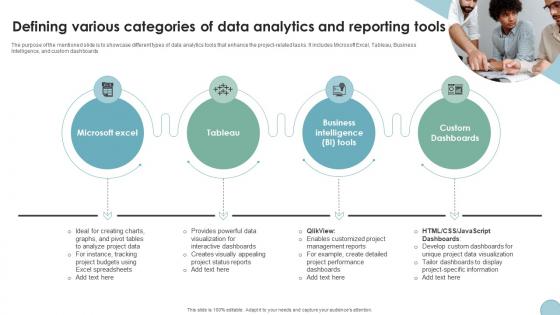
Defining Various Categories Of Data Analytics Digital Transformation In Project Management
The purpose of the mentioned slide is to showcase different types of data analytics tools that enhance the project-related tasks. It includes Microsoft Excel, Tableau, Business Intelligence, and custom dashboards. Slidegeeks is here to make your presentations a breeze with Defining Various Categories Of Data Analytics Digital Transformation In Project Management With our easy-to-use and customizable templates, you can focus on delivering your ideas rather than worrying about formatting. With a variety of designs to choose from, you are sure to find one that suits your needs. And with animations and unique photos, illustrations, and fonts, you can make your presentation pop. So whether you are giving a sales pitch or presenting to the board, make sure to check out Slidegeeks first The purpose of the mentioned slide is to showcase different types of data analytics tools that enhance the project-related tasks. It includes Microsoft Excel, Tableau, Business Intelligence, and custom dashboards.
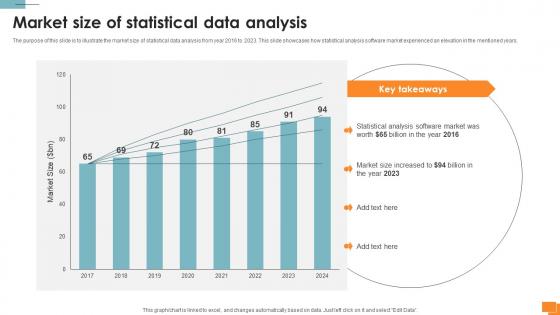
Statistical Tools For Evidence Market Size Of Statistical Data Analysis
The purpose of this slide is to illustrate the market size of statistical data analysis from year 2016 to 2023. This slide showcases how statistical analysis software market experienced an elevation in the mentioned years. Retrieve professionally designed Statistical Tools For Evidence Market Size Of Statistical Data Analysis to effectively convey your message and captivate your listeners. Save time by selecting pre-made slideshows that are appropriate for various topics, from business to educational purposes. These themes come in many different styles, from creative to corporate, and all of them are easily adjustable and can be edited quickly. Access them as PowerPoint templates or as Google Slides themes. You do not have to go on a hunt for the perfect presentation because Slidegeeks got you covered from everywhere. The purpose of this slide is to illustrate the market size of statistical data analysis from year 2016 to 2023. This slide showcases how statistical analysis software market experienced an elevation in the mentioned years.
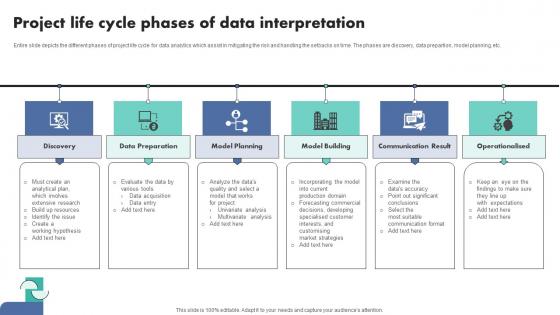
Project Life Cycle Phases Of Data Interpretation Demonstration Pdf
Entire slide depicts the different phases of project life cycle for data analytics which assist in mitigating the risk and handling the setbacks on time. The phases are discovery, data prepartion, model planning, etc.Pitch your topic with ease and precision using this Project Life Cycle Phases Of Data Interpretation Demonstration Pdf This layout presents information on Data Preparation, Model Planning, Model Building It is also available for immediate download and adjustment. So, changes can be made in the color, design, graphics or any other component to create a unique layout. Entire slide depicts the different phases of project life cycle for data analytics which assist in mitigating the risk and handling the setbacks on time. The phases are discovery, data prepartion, model planning, etc.
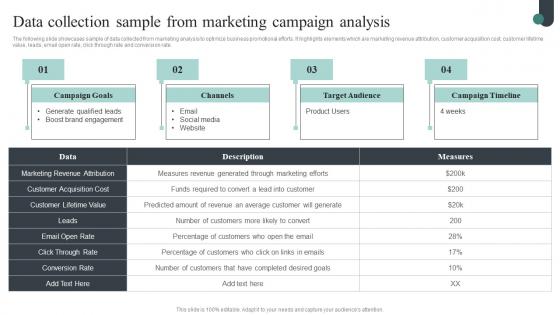
Data Collection Sample From Marketing Competitive Intelligence Guide To Determine Market Topics Pdf
The following slide showcases sample of data collected from marketing analysis to optimize business promotional efforts. It highlights elements which are marketing revenue attribution, customer acquisition cost, customer lifetime value, leads, email open rate, click through rate and conversion rate. Here you can discover an assortment of the finest PowerPoint and Google Slides templates. With these templates, you can create presentations for a variety of purposes while simultaneously providing your audience with an eye-catching visual experience. Download Data Collection Sample From Marketing Competitive Intelligence Guide To Determine Market Topics Pdf to deliver an impeccable presentation. These templates will make your job of preparing presentations much quicker, yet still, maintain a high level of quality. Slidegeeks has experienced researchers who prepare these templates and write high-quality content for you. Later on, you can personalize the content by editing the Data Collection Sample From Marketing Competitive Intelligence Guide To Determine Market Topics Pdf. The following slide showcases sample of data collected from marketing analysis to optimize business promotional efforts. It highlights elements which are marketing revenue attribution, customer acquisition cost, customer lifetime value, leads, email open rate, click through rate and conversion rate.
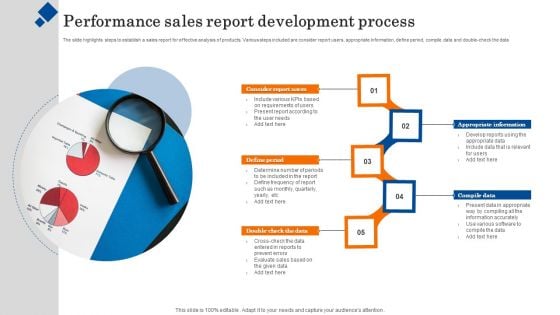
Performance Sales Report Development Process Portrait PDF
The slide highlights steps to establish a sales report for effective analysis of products. Various steps included are consider report users, appropriate information, define period, compile data and double-check the data. Persuade your audience using this Performance Sales Report Development Process Portrait PDF. This PPT design covers five stages, thus making it a great tool to use. It also caters to a variety of topics including Compile Data, Appropriate Information, Consider Report Users. Download this PPT design now to present a convincing pitch that not only emphasizes the topic but also showcases your presentation skills.
Magnifying Ppt PowerPoint Presentation Background Designs
This is a magnifying ppt powerpoint presentation background designs. This is a four stage process. The stages in this process are business, marketing, success, management, icons.
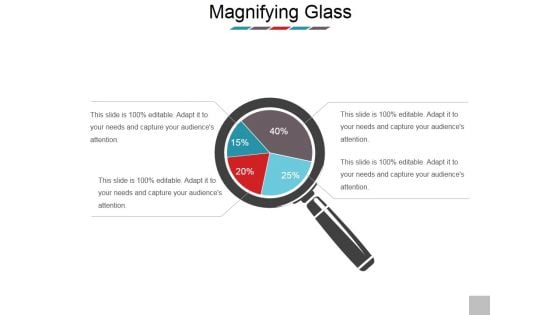
Magnifying Glass Ppt PowerPoint Presentation Guidelines
This is a magnifying glass ppt powerpoint presentation guidelines. This is a four stage process. The stages in this process are magnifying glass, business, technology, marketing, success.
Magnifying Glass Ppt PowerPoint Presentation Deck
This is a magnifying glass ppt powerpoint presentation deck. This is a five stage process. The stages in this process are magnifying, process, marketing, success, business.
Quality Management Is Ppt PowerPoint Presentation Tips
This is a quality management is ppt powerpoint presentation tips. This is a one stage process. The stages in this process are quality management, business, strategy, success.
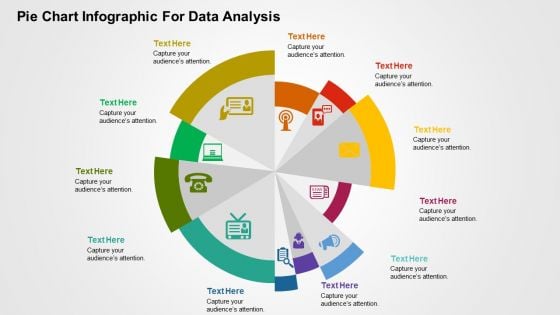
Pie Chart Infographic For Data Analysis PowerPoint Templates
This is one of the most downloaded PowerPoint template. This slide can be used for various purposes and to explain a number of processes. This can be included in your presentation to explain each step of a process and even include its relevance and importance in a single diagram. Using the uneven circular structure of the pie chart, the presenter can also explain random steps or highlight particular steps of process or parts of an organization or business that need special attention of any kind to the audience. Additionally, you can use this slide to show a transformation process or highlight key features of a product.
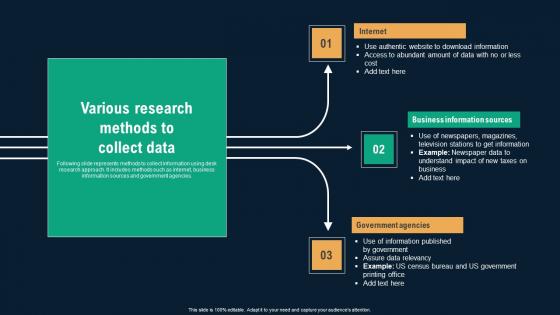
Various Research Methods To Collect Data Business Environmental Analysis Elements Pdf
Following slide represents methods to collect information using desk research approach. It includes methods such as internet, business information sources and government agencies. If your project calls for a presentation, then Slidegeeks is your go-to partner because we have professionally designed, easy-to-edit templates that are perfect for any presentation. After downloading, you can easily edit Various Research Methods To Collect Data Business Environmental Analysis Elements Pdf and make the changes accordingly. You can rearrange slides or fill them with different images. Check out all the handy templates Following slide represents methods to collect information using desk research approach. It includes methods such as internet, business information sources and government agencies.
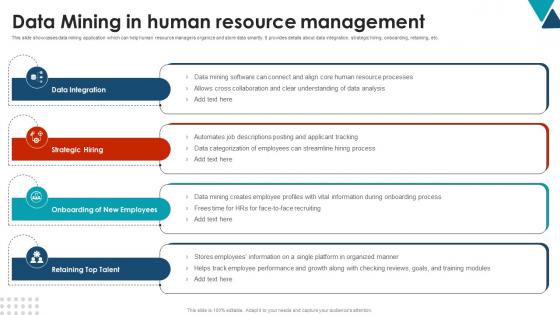
Data Mining In Human Resource Management Using Data Mining Tools To Optimize Processes AI SS V
This slide showcases data mining application which can help human resource managers organize and store data smartly. It provides details about data integration, strategic hiring, onboarding, retaining, etc. Are you in need of a template that can accommodate all of your creative concepts This one is crafted professionally and can be altered to fit any style. Use it with Google Slides or PowerPoint. Include striking photographs, symbols, depictions, and other visuals. Fill, move around, or remove text boxes as desired. Test out color palettes and font mixtures. Edit and save your work, or work with colleagues. Download Data Mining In Human Resource Management Using Data Mining Tools To Optimize Processes AI SS V and observe how to make your presentation outstanding. Give an impeccable presentation to your group and make your presentation unforgettable. This slide showcases data mining application which can help human resource managers organize and store data smartly. It provides details about data integration, strategic hiring, onboarding, retaining, etc.
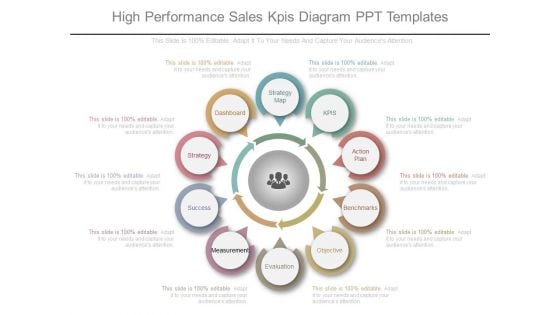
High Performance Sales Kpis Diagram Ppt Templates
This is a high performance sales kpis diagram ppt templates. This is a ten stage process. The stages in this process are strategy map, kpis, action plan, benchmarks, objective, evaluation, measurement, success, strategy, dashboard.
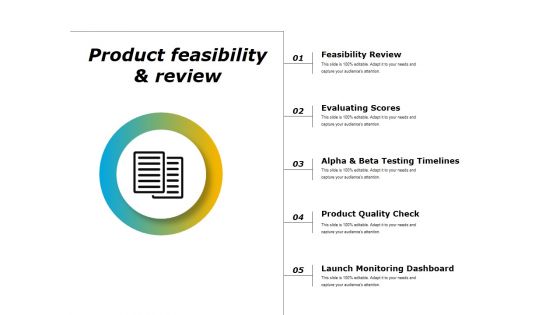
Product Feasibility And Review Ppt PowerPoint Presentation Infographics Design Inspiration
This is a product feasibility and review ppt powerpoint presentation infographics design inspiration. This is a five stage process. The stages in this process are feasibility review, evaluating scores, alpha and beta testing timelines, product quality check, launch monitoring dashboard.
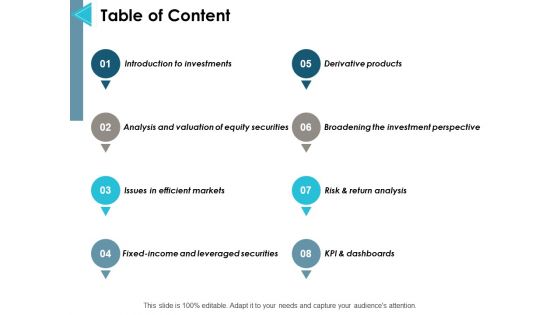
Table Of Content Ppt PowerPoint Presentation Gallery Graphic Tips
This is a table of content ppt powerpoint presentation gallery graphic tips. This is a eight stage process. The stages in this process are introduction to investments, risk and return analysis, issues in efficient markets, kpi and dashboards, management.
Magnifying Glass Ppt PowerPoint Presentation Clipart
This is a magnifying glass ppt powerpoint presentation clipart. This is a five stage process. The stages in this process are magnifying glass, business, marketing, success, management.
Magnify Glass Ppt PowerPoint Presentation Pictures Example
This is a magnify glass ppt powerpoint presentation pictures example. This is a one stage process. The stages in this process are magnify glass, business, marketing, success, technology.
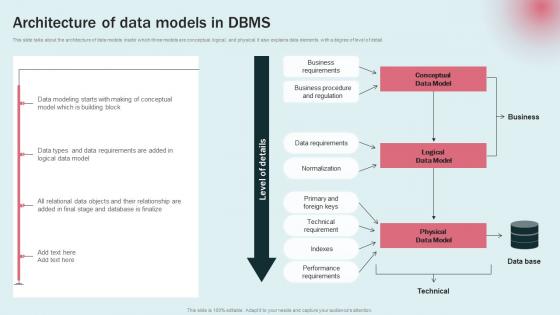
Architecture Data Models DBMS Data Modeling Approaches For Modern Analytics Microsoft Pdf
This slide talks about the architecture of data models inside which three models are conceptual, logical, and physical. It also explains data elements with a degree of level of detail. Are you in need of a template that can accommodate all of your creative concepts This one is crafted professionally and can be altered to fit any style. Use it with Google Slides or PowerPoint. Include striking photographs, symbols, depictions, and other visuals. Fill, move around, or remove text boxes as desired. Test out color palettes and font mixtures. Edit and save your work, or work with colleagues. Download Architecture Data Models DBMS Data Modeling Approaches For Modern Analytics Microsoft Pdf and observe how to make your presentation outstanding. Give an impeccable presentation to your group and make your presentation unforgettable. This slide talks about the architecture of data models inside which three models are conceptual, logical, and physical. It also explains data elements with a degree of level of detail.

Inventory KPI Powerpoint Ppt Template Bundles
This Inventory Key Performance Indicators, Stock KPIs, Stock Metrics, Supply Chain KPIs, Metrics-slide Inventory KPI Powerpoint Ppt Template Bundles is your content ready tool to impress the stakeholders with your business planning and its manner of execution. Showcase your ideas and how you plan to make them real in detail with this PPT Template Bundle. The slides have the conceptual bandwidth to present the crucial aspects of your plan, such as funding, marketing, resource allocation, timeline, roadmap, and more. When you present your plans with this PPT Layout, the stakeholders are sure to come on board because you will be able to present a succinct, thought-out, winning project. Download this Complete Deck now to take control into your hands. The 100 percent customizable offer is just too good to be resisted. Key performance indicators KPIs in inventory management are measures that assists to monitor and make choices about your stock. Our Inventory KPI Powerpoint PPT Template Bundles are topically designed to provide an attractive backdrop to any subject.
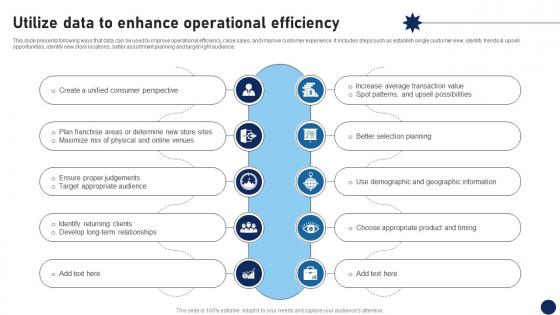
Utilize Data To Enhance Operational Efficiency DT SS V
This slide presents following ways that data can be used to improve operational efficiency, raise sales, and improve customer experience. It includes steps such as establish single customer view, identify trends and upsell opportunities, identify new store locations, better assortment planning and target right audience.From laying roadmaps to briefing everything in detail, our templates are perfect for you. You can set the stage with your presentation slides. All you have to do is download these easy-to-edit and customizable templates. Utilize Data To Enhance Operational Efficiency DT SS V will help you deliver an outstanding performance that everyone would remember and praise you for. Do download this presentation today. This slide presents following ways that data can be used to improve operational efficiency, raise sales, and improve customer experience. It includes steps such as establish single customer view, identify trends and upsell opportunities, identify new store locations, better assortment planning and target right audience.
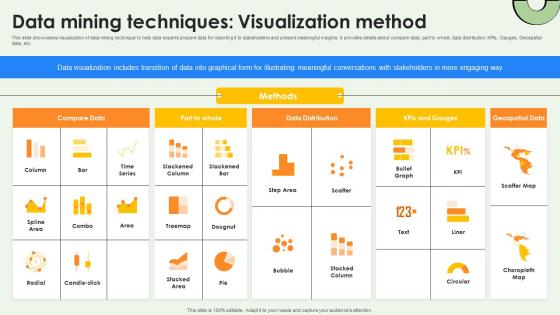
Data Warehousing And Data Mining Techniques Visualization Method AI SS V
This slide showcases visualization of data mining technique to help data experts prepare data for reporting it to stakeholders and present meaningful insights. It provides details about compare data, part to whole, data distribution, KPIs, Gauges, Geospatial data, etc. Find a pre-designed and impeccable Data Warehousing And Data Mining Techniques Visualization Method AI SS V. The templates can ace your presentation without additional effort. You can download these easy-to-edit presentation templates to make your presentation stand out from others. So, what are you waiting for Download the template from Slidegeeks today and give a unique touch to your presentation. This slide showcases visualization of data mining technique to help data experts prepare data for reporting it to stakeholders and present meaningful insights. It provides details about compare data, part to whole, data distribution, KPIs, Gauges, Geospatial data, etc.

Data Analysis Increases Effectiveness And Efficiency Ppt Powerpoint Show
This is a data analysis increases effectiveness and efficiency ppt powerpoint show. This is a five stage process. The stages in this process are is data rich report opportunistic, testing the entire populations versus sample, date analysis increases effectiveness and efficiency, effective for working remotely or on site, easier to share information electronically than via hardcopy reports.

Impact Of Hr Analysis On Organizational Cost Analysing Hr Data For Effective Decision Making
This slide graphically provides information about the impact of HR analysis on the cost that helps organizations to increase profits and improve competitiveness. It includes four quarters and a cost comparison of two years. Here you can discover an assortment of the finest PowerPoint and Google Slides templates. With these templates, you can create presentations for a variety of purposes while simultaneously providing your audience with an eye-catching visual experience. Download Impact Of Hr Analysis On Organizational Cost Analysing Hr Data For Effective Decision Making to deliver an impeccable presentation. These templates will make your job of preparing presentations much quicker, yet still, maintain a high level of quality. Slidegeeks has experienced researchers who prepare these templates and write high-quality content for you. Later on, you can personalize the content by editing the Impact Of Hr Analysis On Organizational Cost Analysing Hr Data For Effective Decision Making. This slide graphically provides information about the impact of HR analysis on the cost that helps organizations to increase profits and improve competitiveness. It includes four quarters and a cost comparison of two years.
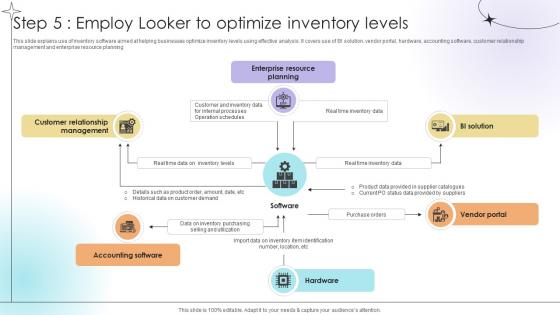
Step 5 Employ Looker To Optimize Inventory Levels Data Analytics SS V
This slide explains use of inventory software aimed at helping businesses optimize inventory levels using effective analysis. It covers use of BI solution, vendor portal, hardware, accounting software, customer relationship management and enterprise resource planning.This modern and well-arranged Step 5 Employ Looker To Optimize Inventory Levels Data Analytics SS V provides lots of creative possibilities. It is very simple to customize and edit with the Powerpoint Software. Just drag and drop your pictures into the shapes. All facets of this template can be edited with Powerpoint, no extra software is necessary. Add your own material, put your images in the places assigned for them, adjust the colors, and then you can show your slides to the world, with an animated slide included. This slide explains use of inventory software aimed at helping businesses optimize inventory levels using effective analysis. It covers use of BI solution, vendor portal, hardware, accounting software, customer relationship management and enterprise resource planning.

Approaches To Execute Data Integration ELT Pipeline Data Analytics SS V
This slide explains extract, load, transform pipeline aimed at helping businesses collect data and store it into warehouse. It covers description as well as illustration explaining working of ELT process.Are you in need of a template that can accommodate all of your creative concepts This one is crafted professionally and can be altered to fit any style. Use it with Google Slides or PowerPoint. Include striking photographs, symbols, depictions, and other visuals. Fill, move around, or remove text boxes as desired. Test out color palettes and font mixtures. Edit and save your work, or work with colleagues. Download Approaches To Execute Data Integration ELT Pipeline Data Analytics SS V and observe how to make your presentation outstanding. Give an impeccable presentation to your group and make your presentation unforgettable. This slide explains extract, load, transform pipeline aimed at helping businesses collect data and store it into warehouse. It covers description as well as illustration explaining working of ELT process.
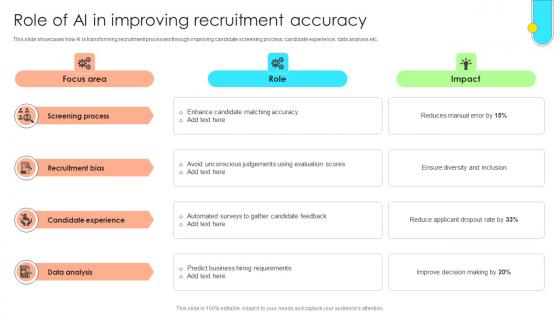
Data Driven Approach To Optimise Role Of Ai In Improving Recruitment Accuracy CRP SS V
This slide showcases how AI is transforming recruitment processes through improving candidate screening process, candidate experience, data analysis etc. Boost your pitch with our creative Data Driven Approach To Optimise Role Of Ai In Improving Recruitment Accuracy CRP SS V. Deliver an awe-inspiring pitch that will mesmerize everyone. Using these presentation templates you will surely catch everyones attention. You can browse the ppts collection on our website. We have researchers who are experts at creating the right content for the templates. So you do not have to invest time in any additional work. Just grab the template now and use them. This slide showcases how AI is transforming recruitment processes through improving candidate screening process, candidate experience, data analysis etc.
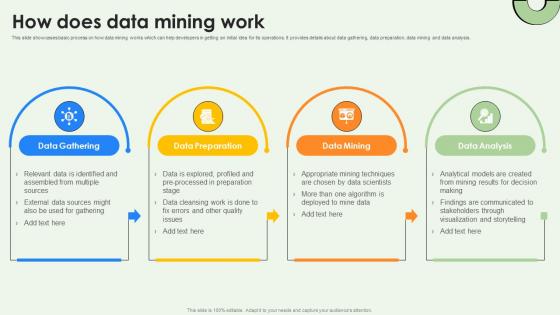
Data Warehousing And How Does Data Mining Work AI SS V
This slide showcases basic process on how data mining works which can help developers in getting an initial idea for its operations. It provides details about data gathering, data preparation, data mining and data analysis. Do you have to make sure that everyone on your team knows about any specific topic I yes, then you should give Data Warehousing And How Does Data Mining Work AI SS V a try. Our experts have put a lot of knowledge and effort into creating this impeccable Data Warehousing And How Does Data Mining Work AI SS V. You can use this template for your upcoming presentations, as the slides are perfect to represent even the tiniest detail. You can download these templates from the Slidegeeks website and these are easy to edit. So grab these today This slide showcases basic process on how data mining works which can help developers in getting an initial idea for its operations. It provides details about data gathering, data preparation, data mining and data analysis.
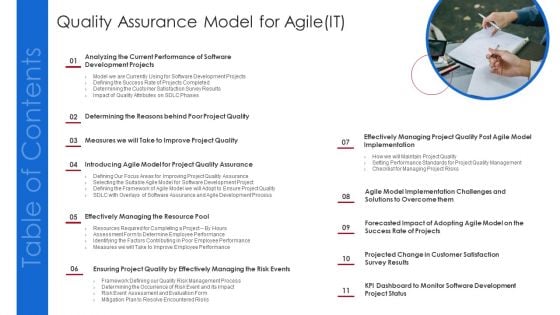
Table Of Contents Quality Assurance Model For Agile IT Formats PDF
Presenting table of contents quality assurance model for agile it formats pdf to provide visual cues and insights. Share and navigate important information on eleven stages that need your due attention. This template can be used to pitch topics like effectively managing, resource pool, kpi dashboard, monitor software development, project status, agile model implementation, challenges and solutions. In addtion, this PPT design contains high resolution images, graphics, etc, that are easily editable and available for immediate download.
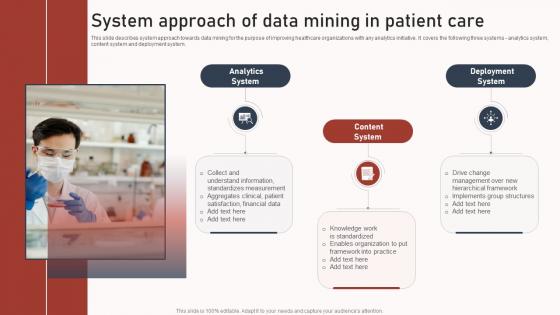
System Approach Of Data Mining In Patient Care Clipart Pdf
This slide describes system approach towards data mining for the purpose of improving healthcare organizations with any analytics initiative. It covers the following three systems analytics system, content system and deployment system. Pitch your topic with ease and precision using this System Approach Of Data Mining In Patient Care Clipart Pdf. This layout presents information on Analytics System, Content System, Deployment System. It is also available for immediate download and adjustment. So, changes can be made in the color, design, graphics or any other component to create a unique layout. This slide describes system approach towards data mining for the purpose of improving healthcare organizations with any analytics initiative. It covers the following three systems analytics system, content system and deployment system.
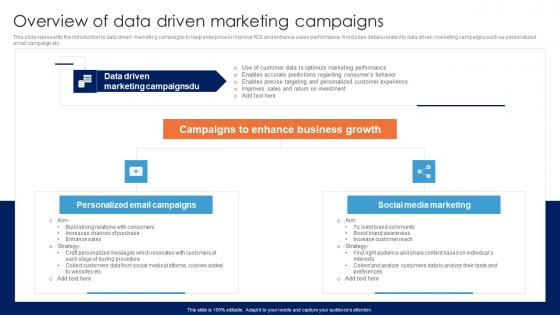
Overview Of Data Driven Marketing Campaigns Guide For Data Driven Advertising Structure Pdf
This slide represents the introduction to data driven marketing campaigns to help enterprise to improve ROI and enhance sales performance. It includes details related to data driven marketing campaigns such as personalized email campaign etc.Crafting an eye-catching presentation has never been more straightforward. Let your presentation shine with this tasteful yet straightforward Overview Of Data Driven Marketing Campaigns Guide For Data Driven Advertising Structure Pdf template. It offers a minimalistic and classy look that is great for making a statement. The colors have been employed intelligently to add a bit of playfulness while still remaining professional. Construct the ideal Overview Of Data Driven Marketing Campaigns Guide For Data Driven Advertising Structure Pdf that effortlessly grabs the attention of your audience. Begin now and be certain to wow your customers. This slide represents the introduction to data driven marketing campaigns to help enterprise to improve ROI and enhance sales performance. It includes details related to data driven marketing campaigns such as personalized email campaign etc.

Applications Of Data Integration In Various Sectors Data Integration Strategies For Business
This slide discusses the application of data integration in the real world. The purpose of this slide is to highlight the various fields such as retail, marketing, finance, healthcare, and IoT where data integration plays a significant role. Do you have to make sure that everyone on your team knows about any specific topic I yes, then you should give Applications Of Data Integration In Various Sectors Data Integration Strategies For Business a try. Our experts have put a lot of knowledge and effort into creating this impeccable Applications Of Data Integration In Various Sectors Data Integration Strategies For Business. You can use this template for your upcoming presentations, as the slides are perfect to represent even the tiniest detail. You can download these templates from the Slidegeeks website and these are easy to edit. So grab these today This slide discusses the application of data integration in the real world. The purpose of this slide is to highlight the various fields such as retail, marketing, finance, healthcare, and IoT where data integration plays a significant role.
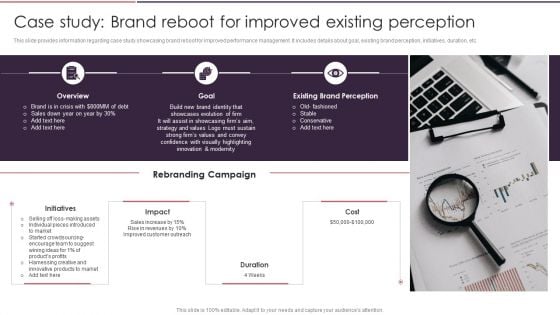
Rebranding Brand Fresh Face Development Case Study Brand Reboot For Improved Inspiration PDF
This slide provides information regarding case study showcasing brand reboot for improved performance management. It includes details about goal, existing brand perception, initiatives, duration, etc. Slidegeeks has constructed Rebranding Brand Fresh Face Development Case Study Brand Reboot For Improved Inspiration PDF after conducting extensive research and examination. These presentation templates are constantly being generated and modified based on user preferences and critiques from editors. Here, you will find the most attractive templates for a range of purposes while taking into account ratings and remarks from users regarding the content. This is an excellent jumping-off point to explore our content and will give new users an insight into our top-notch PowerPoint Templates.
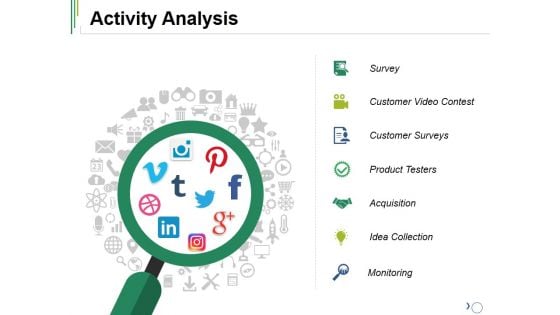
Activity Analysis Ppt PowerPoint Presentation Professional Picture
This is a activity analysis ppt powerpoint presentation professional picture. This is a one stage process. The stages in this process are survey, customer surveys, product testers, acquisition, idea collection.
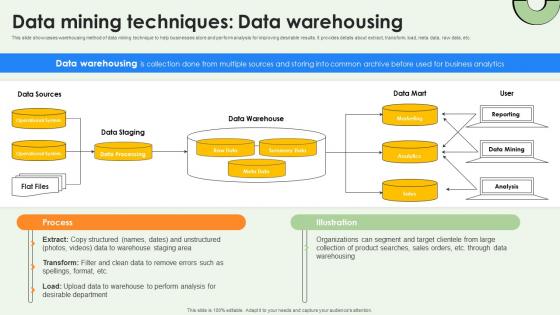
Data Mining Techniques Data Warehousing Data Warehousing And Data Mining Guide AI SS V
This slide showcases warehousing method of data mining technique to help businesses store and perform analysis for improving desirable results. It provides details about extract, transform, load, meta data, raw data, etc. Are you in need of a template that can accommodate all of your creative concepts This one is crafted professionally and can be altered to fit any style. Use it with Google Slides or PowerPoint. Include striking photographs, symbols, depictions, and other visuals. Fill, move around, or remove text boxes as desired. Test out color palettes and font mixtures. Edit and save your work, or work with colleagues. Download Data Mining Techniques Data Warehousing Data Warehousing And Data Mining Guide AI SS V and observe how to make your presentation outstanding. Give an impeccable presentation to your group and make your presentation unforgettable. This slide showcases warehousing method of data mining technique to help businesses store and perform analysis for improving desirable results. It provides details about extract, transform, load, meta data, raw data, etc.
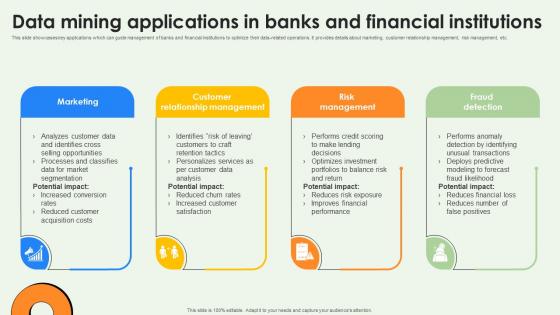
Data Warehousing And Data Mining Applications In Banks And Financial Institutions AI SS V
This slide showcases key applications which can guide management of banks and financial institutions to optimize their data-related operations. It provides details about marketing, customer relationship management, risk management, etc. Here you can discover an assortment of the finest PowerPoint and Google Slides templates. With these templates, you can create presentations for a variety of purposes while simultaneously providing your audience with an eye-catching visual experience. Download Data Warehousing And Data Mining Applications In Banks And Financial Institutions AI SS V to deliver an impeccable presentation. These templates will make your job of preparing presentations much quicker, yet still, maintain a high level of quality. Slidegeeks has experienced researchers who prepare these templates and write high-quality content for you. Later on, you can personalize the content by editing the Data Warehousing And Data Mining Applications In Banks And Financial Institutions AI SS V. This slide showcases key applications which can guide management of banks and financial institutions to optimize their data-related operations. It provides details about marketing, customer relationship management, risk management, etc.

Trend Line Technical Analysis Powerpoint Themes
This is a trend line technical analysis powerpoint themes. This is a five stage process. The stages in this process are complex systems, statistical modeling, uncertainty, lateral thinking, mathematical analysis.
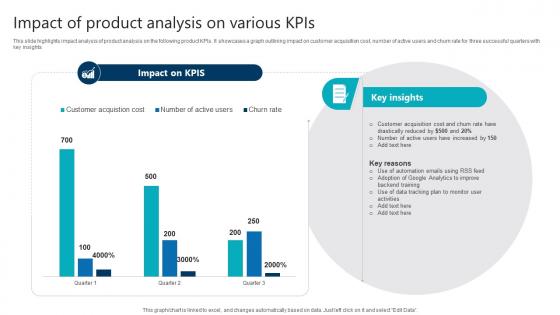
Impact Of Product Analysis On Various Kpis Product Analytics Implementation Data Analytics V
This slide highlights impact analysis of product analysis on the following product KPIs. It showcases a graph outlining impact on customer acquisition cost, number of active users and churn rate for three successful quarters with key insights Are you searching for a Impact Of Product Analysis On Various Kpis Product Analytics Implementation Data Analytics V that is uncluttered, straightforward, and original Its easy to edit, and you can change the colors to suit your personal or business branding. For a presentation that expresses how much effort you have put in, this template is ideal With all of its features, including tables, diagrams, statistics, and lists, its perfect for a business plan presentation. Make your ideas more appealing with these professional slides. Download Impact Of Product Analysis On Various Kpis Product Analytics Implementation Data Analytics V from Slidegeeks today. This slide highlights impact analysis of product analysis on the following product KPIs. It showcases a graph outlining impact on customer acquisition cost, number of active users and churn rate for three successful quarters with key insights
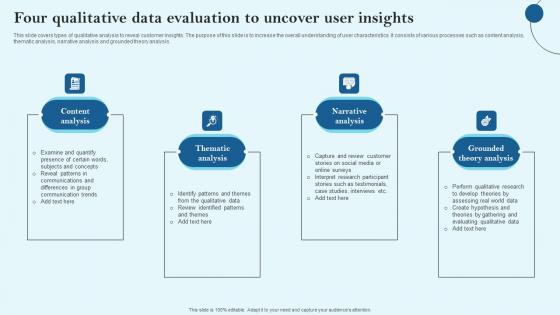
Four Qualitative Data Evaluation To Uncover User Insights Infographics Pdf
This slide covers types of qualitative analysis to reveal customer insights. The purpose of this slide is to increase the overall understanding of user characteristics. It consists of various processes such as content analysis, thematic analysis, narrative analysis and grounded theory analysis. Pitch your topic with ease and precision using this Four Qualitative Data Evaluation To Uncover User Insights Infographics Pdf This layout presents information on Content Analysis, Thematic Analysis, Narrative Analysis It is also available for immediate download and adjustment. So, changes can be made in the color, design, graphics or any other component to create a unique layout. This slide covers types of qualitative analysis to reveal customer insights. The purpose of this slide is to increase the overall understanding of user characteristics. It consists of various processes such as content analysis, thematic analysis, narrative analysis and grounded theory analysis.
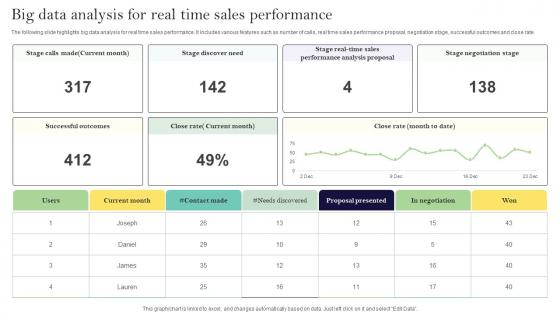
Big Data Analysis For Real Time Sales Performance Ppt Show Format Ideas Pdf
The following slide highlights big data analysis for real time sales performance. It includes various features such as number of calls, real time sales performance proposal, negotiation stage, successful outcomes and close rate. Showcasing this set of slides titled Big Data Analysis For Real Time Sales Performance Ppt Show Format Ideas Pdf. The topics addressed in these templates are Negotiation Stage, Successful Outcomes, Close Rate. All the content presented in this PPT design is completely editable. Download it and make adjustments in color, background, font etc. as per your unique business setting. The following slide highlights big data analysis for real time sales performance. It includes various features such as number of calls, real time sales performance proposal, negotiation stage, successful outcomes and close rate.
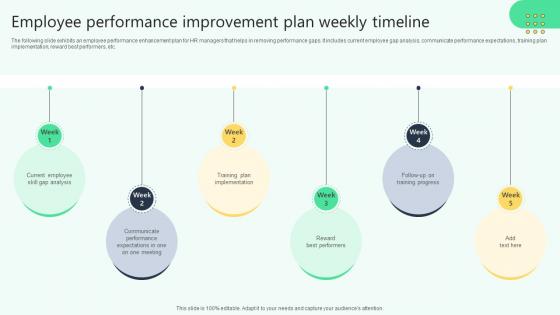
Employee Performance Improvement Plan Weekly Analysing Hr Data For Effective Decision Making
The following slide exhibits an employee performance enhancement plan for HR managers that helps in removing performance gaps. It includes current employee gap analysis, communicate performance expectations, training plan implementation, reward best performers, etc. Coming up with a presentation necessitates that the majority of the effort goes into the content and the message you intend to convey. The visuals of a PowerPoint presentation can only be effective if it supplements and supports the story that is being told. Keeping this in mind our experts created Employee Performance Improvement Plan Weekly Analysing Hr Data For Effective Decision Making to reduce the time that goes into designing the presentation. This way, you can concentrate on the message while our designers take care of providing you with the right template for the situation. The following slide exhibits an employee performance enhancement plan for HR managers that helps in removing performance gaps. It includes current employee gap analysis, communicate performance expectations, training plan implementation, reward best performers, etc.
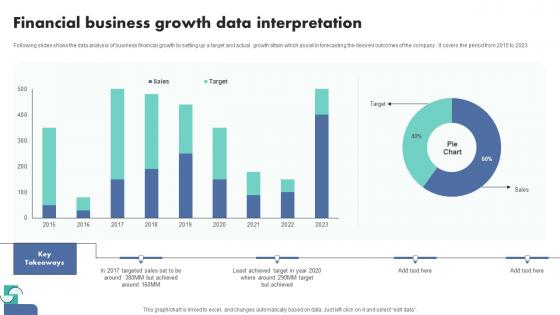
Financial Business Growth Data Interpretation Themes Pdf
Following slides shows the data analysis of business financial growth by setting up a target and actual growth attain which assist in forecasting the desired outcomes of the company . It covers the period from 2015 to 2023.Pitch your topic with ease and precision using this Financial Business Growth Data Interpretation Themes Pdf This layout presents information on Financial Business, Growth Data Interpretation It is also available for immediate download and adjustment. So, changes can be made in the color, design, graphics or any other component to create a unique layout. Following slides shows the data analysis of business financial growth by setting up a target and actual growth attain which assist in forecasting the desired outcomes of the company . It covers the period from 2015 to 2023.


 Continue with Email

 Home
Home


