Progress Infographic
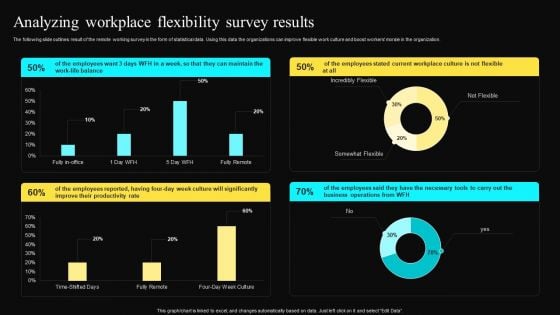
Analyzing Workplace Flexibility Survey Results Infographics PDF
The following slide outlines result of the remote working survey in the form of statistical data. Using this data the organizations can improve flexible work culture and boost workers morale in the organization. Slidegeeks is here to make your presentations a breeze with Analyzing Workplace Flexibility Survey Results Infographics PDF With our easy to use and customizable templates, you can focus on delivering your ideas rather than worrying about formatting. With a variety of designs to choose from, you are sure to find one that suits your needs. And with animations and unique photos, illustrations, and fonts, you can make your presentation pop. So whether you are giving a sales pitch or presenting to the board, make sure to check out Slidegeeks first.
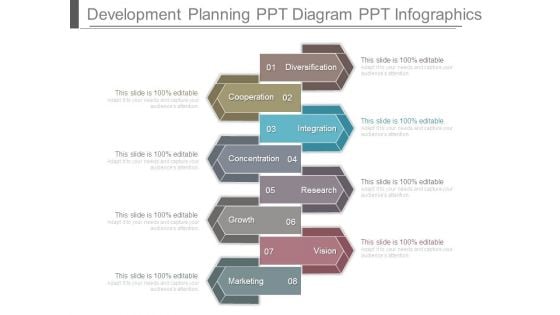
Development Planning Ppt Diagram Ppt Infographics
This is a development planning ppt diagram ppt infographics. This is a eight stage process. The stages in this process are diversification, cooperation, integration, concentration, research, growth, vision, marketing.
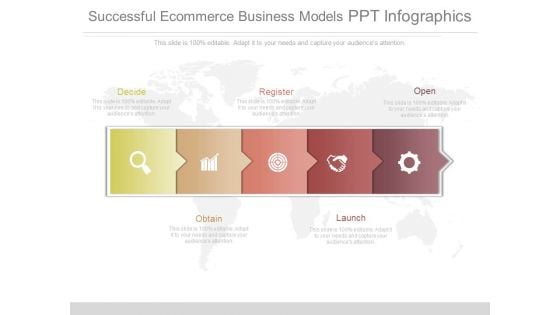
Successful Ecommerce Business Models Ppt Infographics
This is a successful ecommerce business models ppt infographics. This is a five stage process. The stages in this process are decide, register, open, obtain, launch.
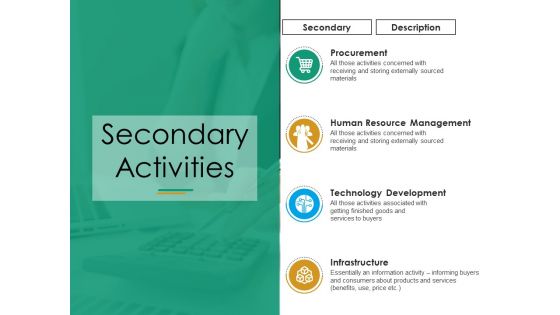
Secondary Activities Ppt PowerPoint Presentation File Infographics
This is a secondary activities ppt powerpoint presentation file infographics. This is a four stage process. The stages in this process are procurement, human resource management, technology development, infrastructure, business.
About Us Ppt PowerPoint Presentation Infographics
This is a about us ppt powerpoint presentation infographics. This is a one stage process. The stages in this process are business, strategy, analysis, about us, icons.
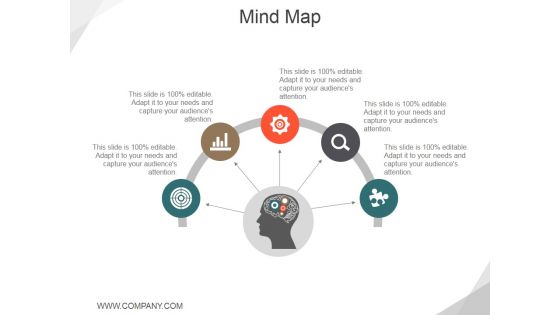
Mind Map Ppt PowerPoint Presentation File Infographics
This is a mind map ppt powerpoint presentation file infographics. This is a five stage process. The stages in this process are semi, icons, management, strategy.
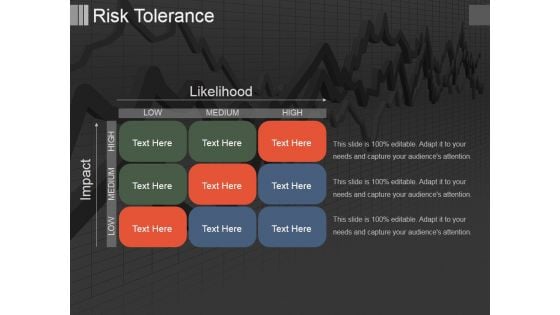
Risk Tolerance Ppt PowerPoint Presentation Summary Infographics
This is a risk tolerance ppt powerpoint presentation summary infographics. This is a three stage process. The stages in this process are high, medium, low.

Combo Chart Ppt PowerPoint Presentation Professional Infographics
This is a combo chart ppt powerpoint presentation professional infographics. This is a three stage process. The stages in this process are combo chart, market size, product.
Our Mission Ppt PowerPoint Presentation Show Infographics
This is a our mission ppt powerpoint presentation show infographics. This is a two stage process. The stages in this process are vision, mission.
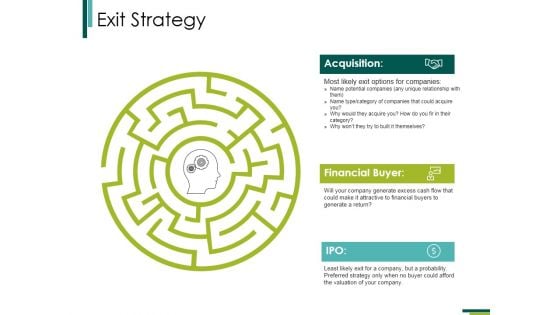
Exit Strategy Ppt PowerPoint Presentation Outline Infographics
This is a exit strategy ppt powerpoint presentation outline infographics. This is a one stage process. The stages in this process are acquisition, financial buyer, ipo.
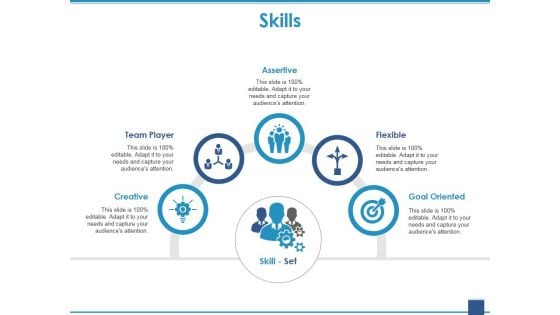
Skills Ppt PowerPoint Presentation Model Infographics
This is a skills ppt powerpoint presentation model infographics. This is a five stage process. The stages in this process are assertive, team player, creative, flexible, goal oriented.
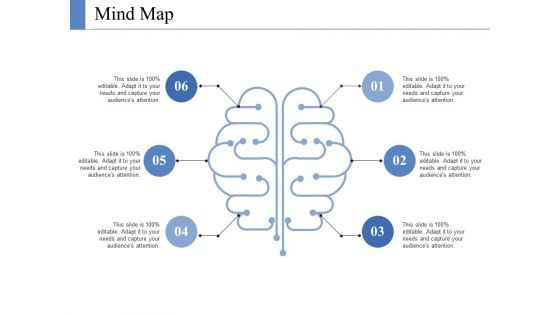
Mind Map Ppt PowerPoint Presentation Layouts Infographics
This is a mind map ppt powerpoint presentation layouts infographics. This is a six stage process. The stages in this process are mind map, marketing, strategy, planning, technology.

Training Evaluation Ppt PowerPoint Presentation File Infographics
This is a training evaluation ppt powerpoint presentation file infographics. This is a four stage process. The stages in this process are results, behavior, learning, reaction, business.
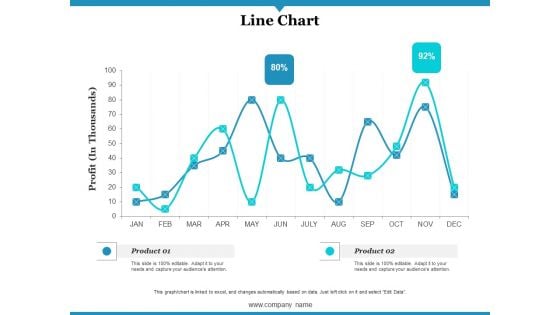
Line Chart Ppt PowerPoint Presentation Gallery Infographics
This is a line chart ppt powerpoint presentation gallery infographics. This is a two stage process. The stages in this process are profit, product, line chart.
Our Mission Ppt PowerPoint Presentation Gallery Infographics
This is a our mission ppt powerpoint presentation gallery infographics. This is a four stage process. The stages in this process are business, success, management, strategy, development.
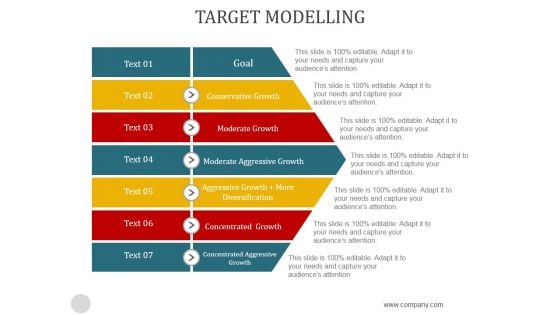
Target Modelling Ppt PowerPoint Presentation Infographics
This is a target modelling ppt powerpoint presentation infographics. This is a seven stage process. The stages in this process are conservative growth, moderate growth, moderate aggressive growth, aggressive growth more diversification, concentrated growth, concentrated aggressive, growth, goal.
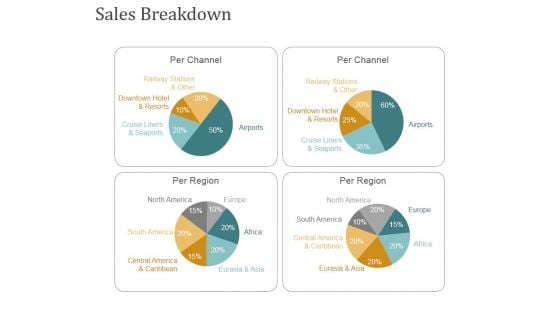
Sales Breakdown Ppt PowerPoint Presentation Summary Infographics
This is a sales breakdown ppt powerpoint presentation summary infographics. This is a four stage process. The stages in this process are per channel, per region.
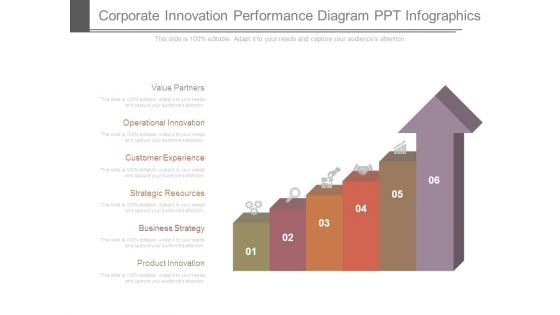
Corporate Innovation Performance Diagram Ppt Infographics
This is a corporate innovation performance diagram ppt infographics. This is a six stage process. The stages in this process are value partners, operational innovation, customer experience, strategic resources, business strategy, product innovation.
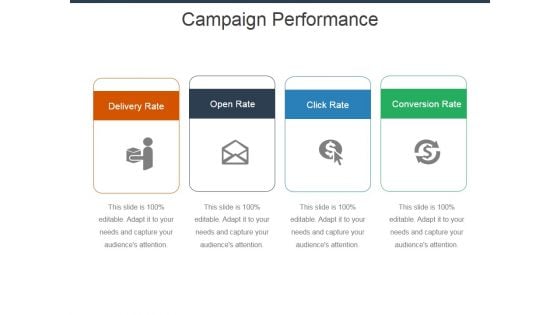
Campaign Performance Ppt Powerpoint Presentation Summary Infographics
This is a campaign performance ppt powerpoint presentation summary infographics. This is a four stage process. The stages in this process are delivery rate, open rate, click rate, conversion rate.

Financial Measures Ppt PowerPoint Presentation Model Infographics
This is a financial measures ppt powerpoint presentation model infographics. This is a seven stage process. The stages in this process are cost of raw material, revenue from goods sold, inventory holding cost, transportation cost, cost of expired perishable goods.
Brand Pricing Ppt PowerPoint Presentation Icon Infographics
This is a brand pricing ppt powerpoint presentation icon infographics. This is a four stage process. The stages in this process are superior quality, brand, value for money, economical.
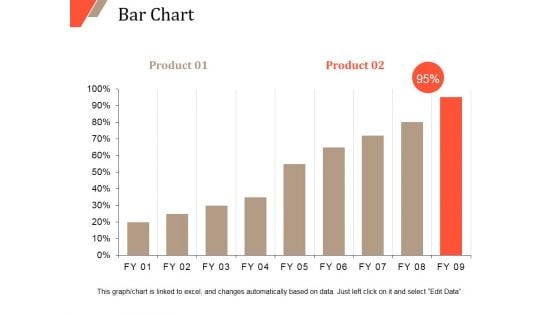
Bar Chart Ppt PowerPoint Presentation Outline Infographics
This is a bar chart ppt powerpoint presentation outline infographics. This is a two stage process. The stages in this process are bar chart, finance, marketing, strategy, analysis, business.
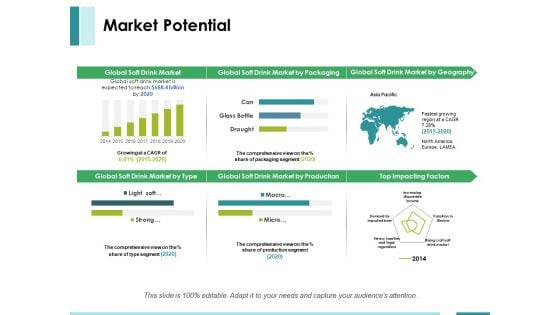
Market Potential Ppt PowerPoint Presentation Pictures Infographics
This is a market potential ppt powerpoint presentation pictures infographics. This is a two stage process. The stages in this process are top impacting factors, asia pacific, global soft drink market by type, global soft drink market.
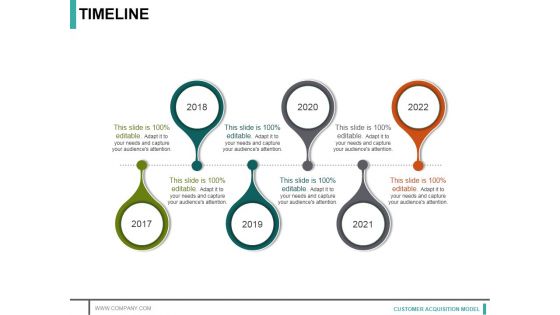
Timeline Ppt PowerPoint Presentation Model Infographics
This is a timeline ppt powerpoint presentation model infographics. This is a six stage process. The stages in this process are year, growth, success, time planning, business.
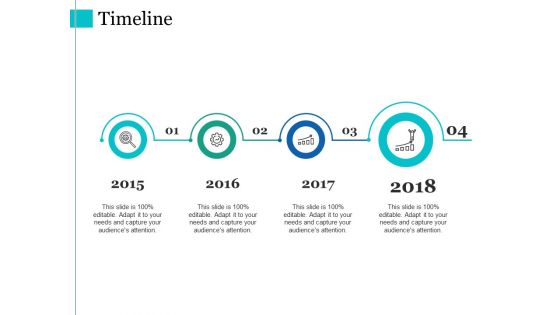
Timeline Ppt PowerPoint Presentation Styles Infographics
This is a timeline ppt powerpoint presentation styles infographics. This is a four stage process. The stages in this process are year, growth, success, time planning, business.
Timeline Template 1 Ppt PowerPoint Presentation Infographics
This is a timeline template 1 ppt powerpoint presentation infographics. This is a three stage process. The stages in this process are year, time planning, growth, success.
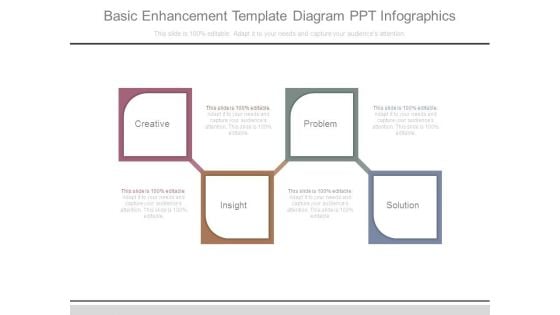
Basic Enhancement Template Diagram Ppt Infographics
This is a basic enhancement template diagram ppt infographics. This is a four stage process. The stages in this process are creative, problem, insight, solution.
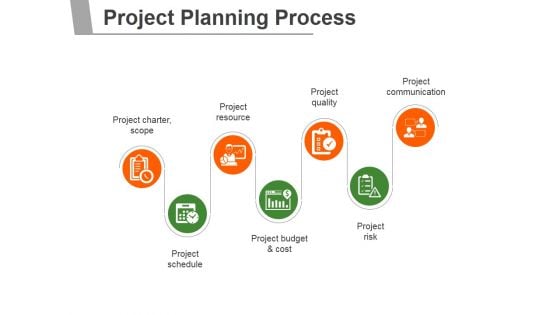
Project Planning Process Ppt PowerPoint Presentation Infographics
This is a project planning process ppt powerpoint presentation infographics. This is a seven stage process. The stages in this process are project charter scope, project resource, project quality, project communication, project schedule, project budget and cost, project risk.
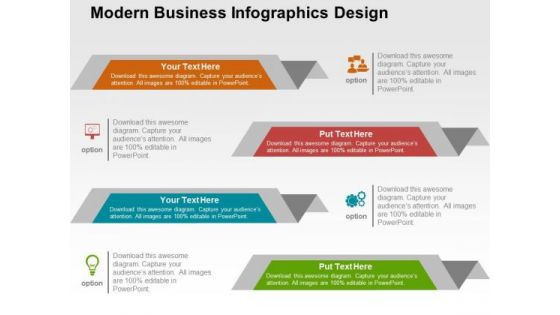
Modern Business Infographics Design PowerPoint Templates
Use our above slide displays modern business Infographics. This template has been designed with text boxes and icons. Blend your views with this professional image.
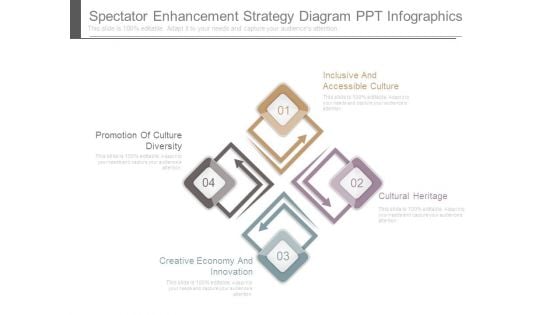
Spectator Enhancement Strategy Diagram Ppt Infographics
This is a spectator enhancement strategy diagram ppt infographics. This is a four stage process. The stages in this process are promotion of culture diversity, creative economy and innovation, cultural heritage, inclusive and accessible culture.
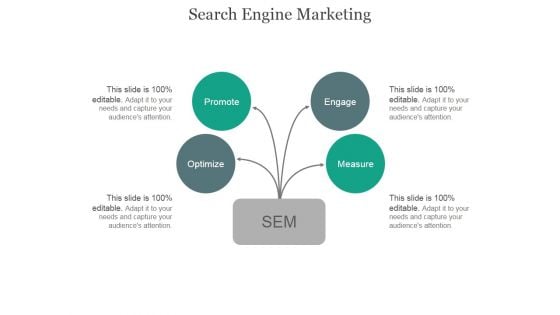
Search Engine Marketing Ppt PowerPoint Presentation Infographics
This is a search engine marketing ppt powerpoint presentation infographics. This is a four stage process. The stages in this process are optimize, promote, engage, measure.
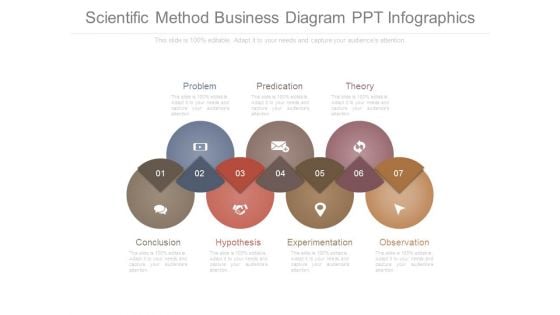
Scientific Method Business Diagram Ppt Infographics
This is a scientific method business diagram ppt infographics. This is a seven stage process. The stages in this process are conclusion, problem, hypothesis, predication, experimentation, theory, observation.
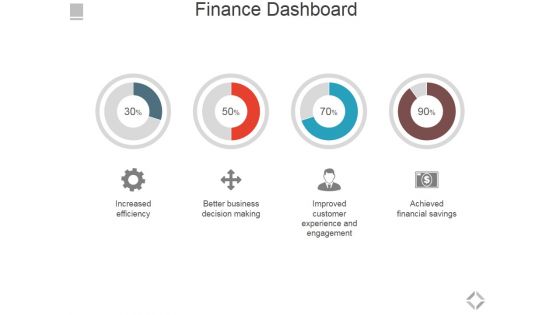
Finance Dashboard Ppt PowerPoint Presentation Layouts Infographics
This is a finance dashboard ppt powerpoint presentation layouts infographics. This is a four stage process. The stages in this process are increased efficiency, better business decision making, improved customer experience and engagement, achieved financial savings.
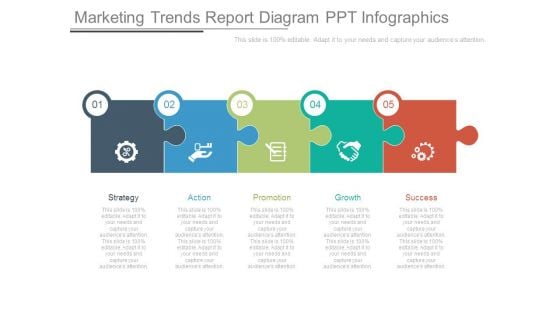
Marketing Trends Report Diagram Ppt Infographics
This is a marketing trends report diagram ppt infographics. This is a five stage process. The stages in this process are strategy, action, promotion, growth, success.
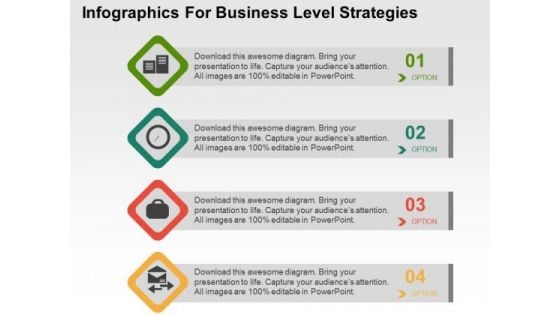
Infographics For Business Level Strategies PowerPoint Templates
This PowerPoint template contains four level Infographics. This diagram has been designed with four tags with icons to depict business level strategies. Use this diagram to set targets and to measure performance in your presentations.
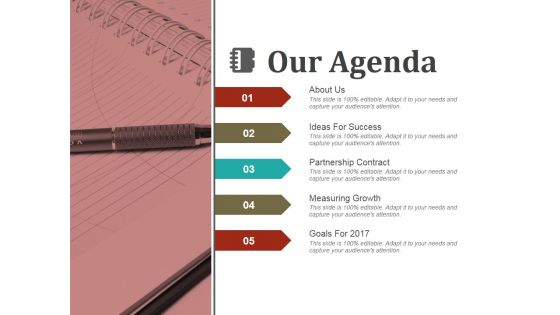
Our Agenda Ppt PowerPoint Presentation Infographics
This is a our agenda ppt powerpoint presentation infographics. This is a five stage process. The stages in this process are about us, ideas for success, partnership contract, measuring growth.
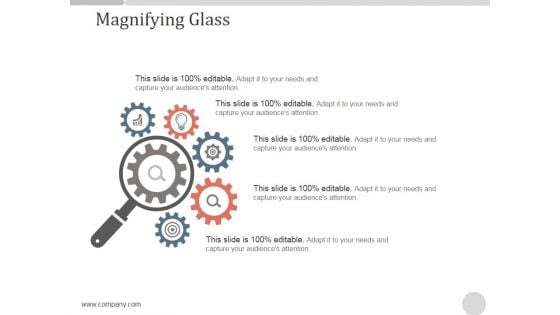
Magnifying Glass Ppt PowerPoint Presentation Infographics
This is a magnifying glass ppt powerpoint presentation infographics. This is a five stage process. The stages in this process are business, marketing, management, process, magnifier glass.
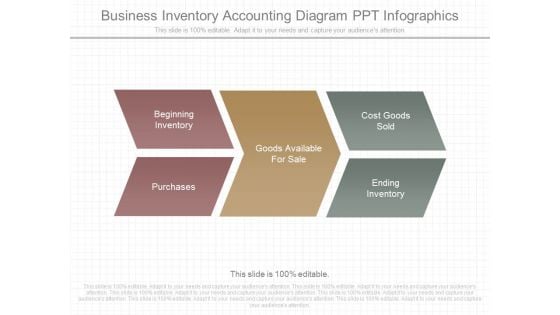
Business Inventory Accounting Diagram Ppt Infographics
This is a business inventory accounting diagram ppt infographics. This is a three stage process. The stages in this process are beginning inventory, purchases, goods available for sale, cost goods sold, ending inventory.
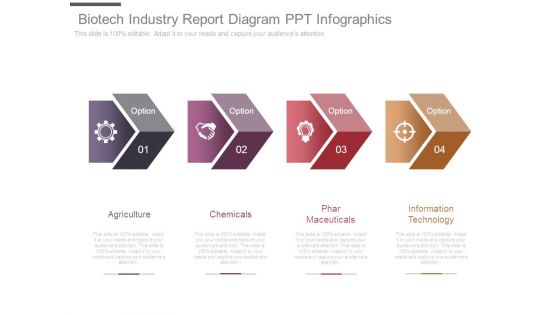
Biotech Industry Report Diagram Ppt Infographics
This is a biotech industry report diagram ppt infographics. This is a four stage process. The stages in this process are agriculture, chemicals, phar maceuticals, information technology.
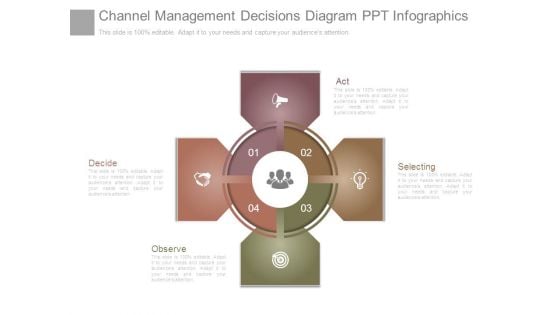
Channel Management Decisions Diagram Ppt Infographics
This is a channel management decisions diagram ppt infographics. This is a four stage process. The stages in this process are decide, observe, act, selecting.
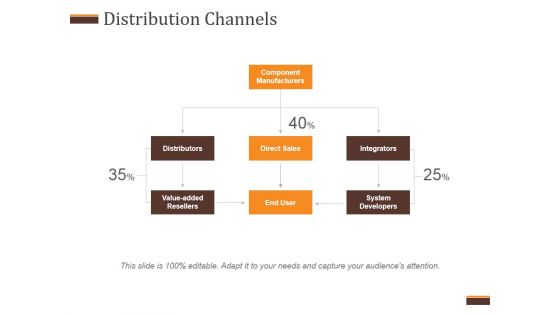
Distribution Channels Ppt PowerPoint Presentation Infographics
This is a distribution channels ppt powerpoint presentation infographics. This is a three stage process. The stages in this process are component manufacturers, distributors, direct sales, integrators, value added resellers, end user, system developers.
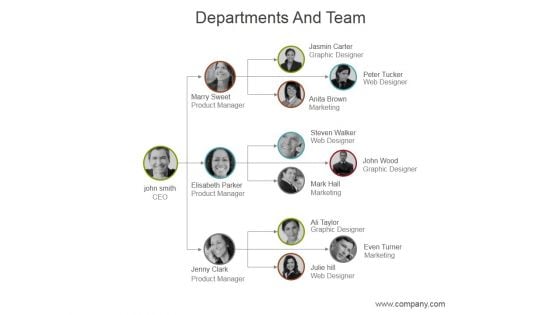
Departments And Team Ppt PowerPoint Presentation Infographics
This is a departments and team ppt powerpoint presentation infographics. This is a three stage process. The stages in this process are product manager, graphic designer, web designer, marketing, ceo.
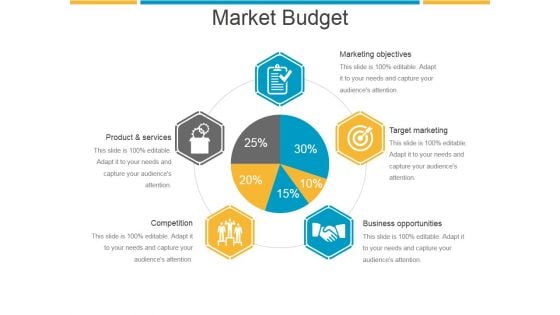
Market Budget Ppt PowerPoint Presentation Infographics
This is a market budget ppt powerpoint presentation infographics. This is a five stage process. The stages in this process are marketing objectives, target marketing, business opportunities, competition, product and services.
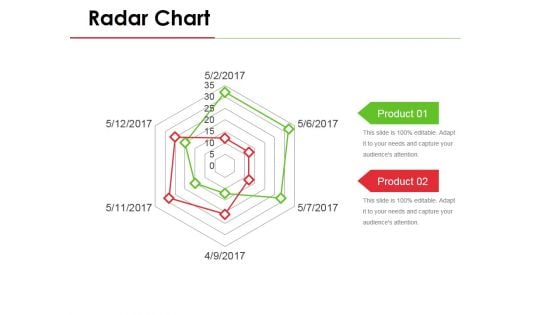
Radar Chart Ppt PowerPoint Presentation Styles Infographics
This is a radar chart ppt powerpoint presentation styles infographics. This is a six stage process. The stages in this process are business, marketing, product, radar chart, strategy.
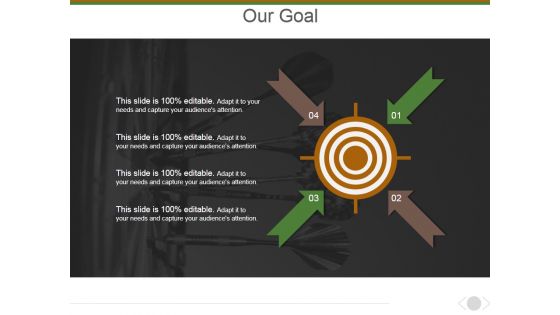
Our Goal Ppt PowerPoint Presentation Model Infographics
This is a our goal ppt powerpoint presentation model infographics. This is a four stage process. The stages in this process are goal, arrows, planning, process, business.

Company Name Template3 Ppt PowerPoint Presentation Infographics
This is a company name template3 ppt powerpoint presentation infographics. This is a three stage process. The stages in this process are vision, mission, goal.
Funnel Ppt PowerPoint Presentation Icon Infographics
This is a funnel ppt powerpoint presentation icon infographics. This is a four stage process. The stages in this process are business, marketing, funnel, process, planning.

Generate Idea Ppt PowerPoint Presentation Layouts Infographics
This is a generate idea ppt powerpoint presentation layouts infographics. This is a one stage process. The stages in this process are business, marketing, analysis, strategy, idea bulb.
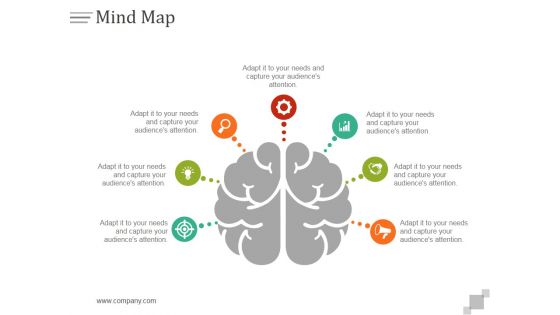
Mind Map Ppt PowerPoint Presentation Infographics
This is a mind map ppt powerpoint presentation infographics. This is a one stage process. The stages in this process are mind map, icons, memory, analysis, success, management.
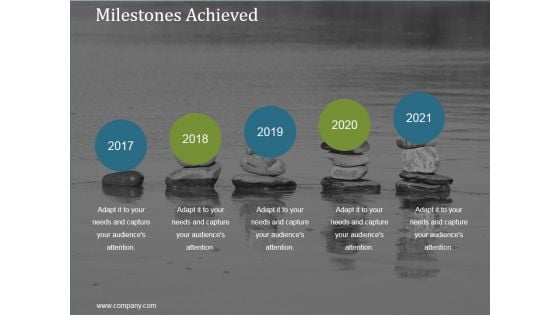
Milestones Achieved Ppt PowerPoint Presentation Infographics
This is a milestones achieved ppt powerpoint presentation infographics. This is a five stage process. The stages in this process are business, strategy, marketing, analysis, success, time line.
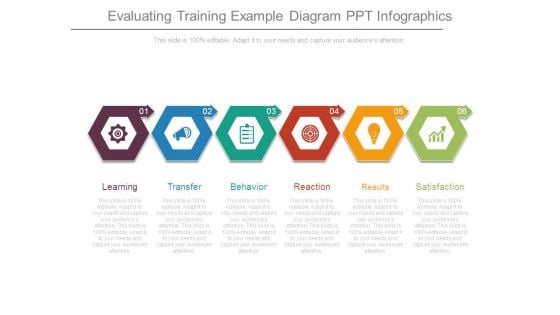
Evaluating Training Example Diagram Ppt Infographics
This is a evaluating training example diagram ppt infographics. This is a six stage process. The stages in this process are learning, transfer, behavior, reaction, results, satisfaction.
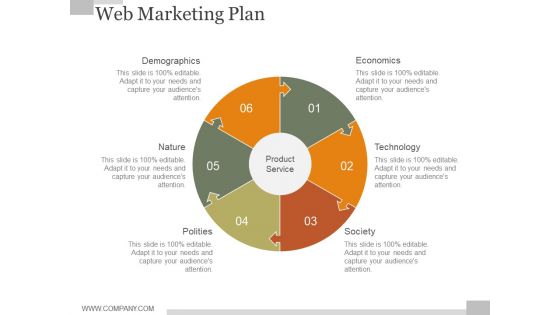
Web Marketing Plan Ppt PowerPoint Presentation Infographics
This is a web marketing plan ppt powerpoint presentation infographics. This is a six stage process. The stages in this process are demographics, nature, polities, economics, technology, society.
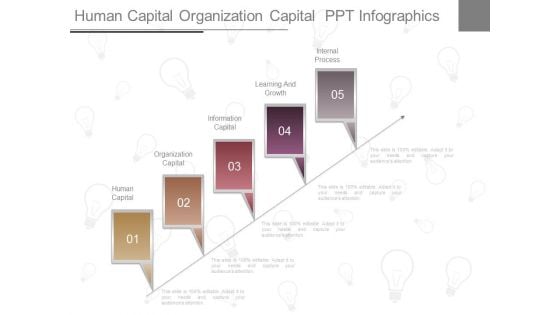
Human Capital Organization Capital Ppt Infographics
This is a human capital organization capital ppt infographics. This is a five stage process. The stages in this process are human capital, organization capital, information capital, learning and growth, internal process.
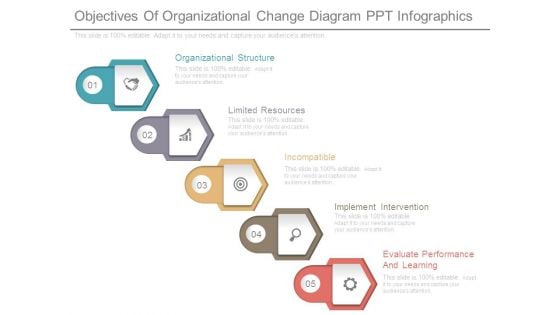
Objectives Of Organizational Change Diagram Ppt Infographics
This is a objectives of organizational change diagram ppt infographics. This is a five stage process. The stages in this process are organizational structure, limited resources, incompatible, implement intervention, evaluate performance and learning.
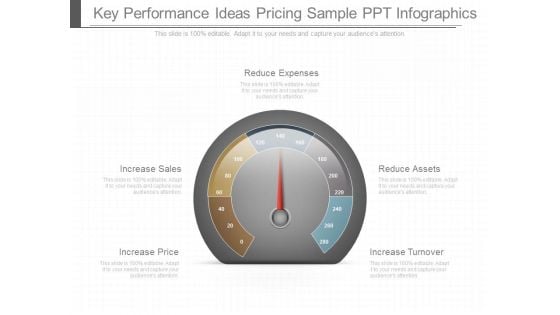
Key Performance Ideas Pricing Sample Ppt Infographics
This is a key performance ideas pricing sample ppt infographics. This is a five stage process. The stages in this process are increase price, increase sales, reduce expenses, reduce assets, increase turnover.
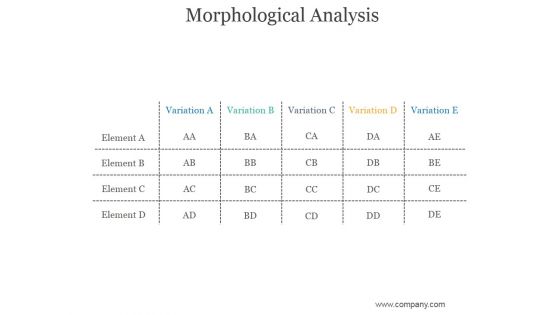
Morphological Analysis Ppt PowerPoint Presentation Infographics
This is a morphological analysis ppt powerpoint presentation infographics. This is a five stage process. The stages in this process are variation, element, business, marketing, success.
Timeline Ppt PowerPoint Presentation Icon Infographics
This is a timeline ppt powerpoint presentation icon infographics. This is a five stage process. The stages in this process are timeline, business, marketing, success, planning.
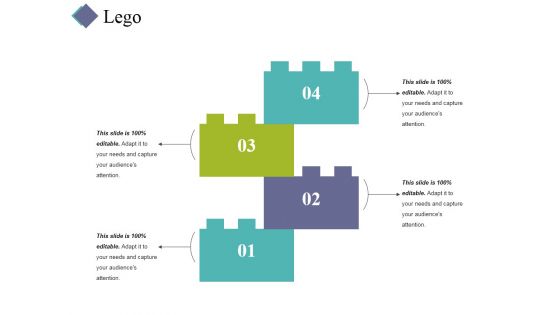
Lego Ppt PowerPoint Presentation Outline Infographics
This is a lego ppt powerpoint presentation outline infographics. This is a four stage process. The stages in this process are lego, sports, management, business, success.
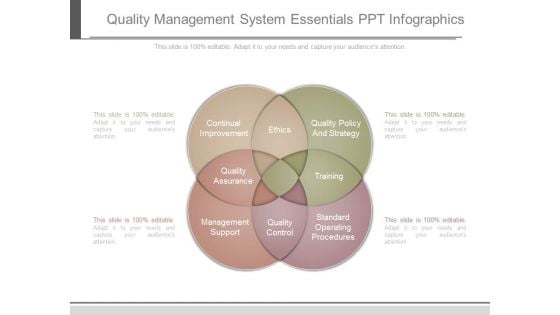
Quality Management System Essentials Ppt Infographics
This is a quality management system essentials ppt infographics. This is a four stage process. The stages in this process are continual improvement, ethics, quality policy and strategy, quality assurance, training, management support, quality control, standard operating procedures.
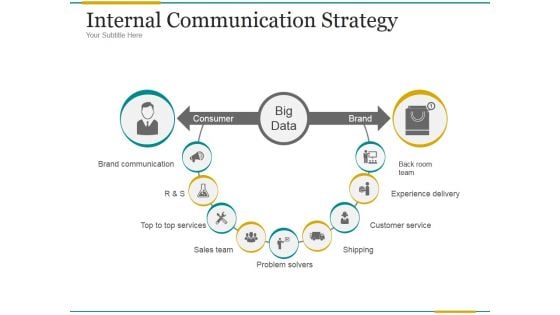
Internal Communication Strategy Ppt PowerPoint Presentation Infographics
This is a internal communication strategy ppt powerpoint presentation infographics. This is a nine stage process. The stages in this process are consumer brand, backroom team, experience delivery, customer service, shipping, problem solvers, sales team, top to top services, brand communication.


 Continue with Email

 Home
Home


