Project Dashboard
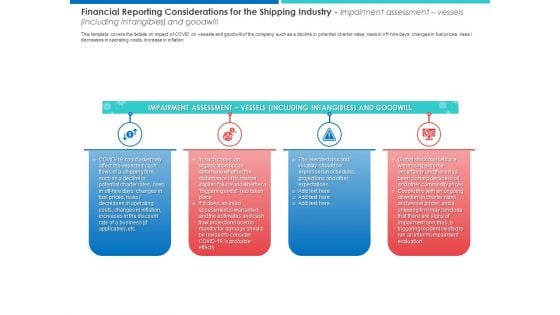
Financial Reporting Considerations For The Shipping Industry Impairment Download PDF
This template covers the details on impact of COVID on vessels and goodwill of the company such as a decline in potential charter rates, rises in off hire days, changes in fuel prices, rises decreases in operating costs, increase in inflation.This is a financial reporting considerations for the shipping industry impairment download pdf. template with various stages. Focus and dispense information on four stages using this creative set, that comes with editable features. It contains large content boxes to add your information on topics like volatility should be expressed in schedules, projections and other expectations, global stock markets are witnessing extreme, organization has to determine. You can also showcase facts, figures, and other relevant content using this PPT layout. Grab it now.

Key Steps To Conduct Heuristic Analysis Data Analytics SS V
This slide outlines major steps to conduct heuristics analysis aimed at helping businesses conduct evaluation and generate meaningful changes. It covers steps such as define analysis scope, end user knowledge, define heuristics, choose reporting style, set up scoring system and analyze.Do you have an important presentation coming up Are you looking for something that will make your presentation stand out from the rest Look no further than Key Steps To Conduct Heuristic Analysis Data Analytics SS V. With our professional designs, you can trust that your presentation will pop and make delivering it a smooth process. And with Slidegeeks, you can trust that your presentation will be unique and memorable. So why wait Grab Key Steps To Conduct Heuristic Analysis Data Analytics SS V today and make your presentation stand out from the rest This slide outlines major steps to conduct heuristics analysis aimed at helping businesses conduct evaluation and generate meaningful changes. It covers steps such as define analysis scope, end user knowledge, define heuristics, choose reporting style, set up scoring system and analyze.
Grow Capital Through Equity Debt Key Financials Historical And Forecasted Icons PDF
The slide provides the historical current and previous year and projected for next five years financials of the company. Key Data points include revenue, operating income, net income, cash flow, cash in hand, total assets etc.Present like a pro with Grow Capital Through Equity Debt Key Financials Historical And Forecasted Icons PDF Create beautiful presentations together with your team, using our easy-to-use presentation slides. Share your ideas in real-time and make changes on the fly by downloading our templates. So whether you are in the office, on the go, or in a remote location, you can stay in sync with your team and present your ideas with confidence. With Slidegeeks presentation got a whole lot easier. Grab these presentations today.
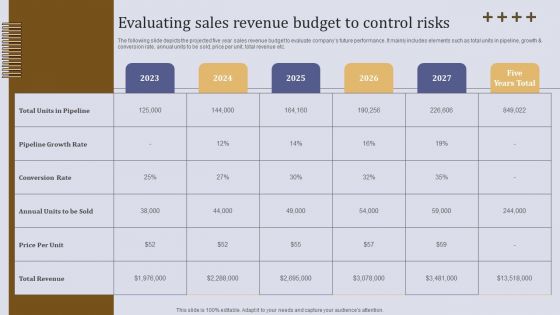
Evaluating Sales Revenue Budget To Control Risks Ppt Slides Infographics PDF
The following slide depicts the projected five year sales revenue budget to evaluate companys future performance. It mainly includes elements such as total units in pipeline, growth and conversion rate, annual units to be sold, price per unit, total revenue etc. Are you searching for a Evaluating Sales Revenue Budget To Control Risks Ppt Slides Infographics PDF that is uncluttered, straightforward, and original Its easy to edit, and you can change the colors to suit your personal or business branding. For a presentation that expresses how much effort you have put in, this template is ideal With all of its features, including tables, diagrams, statistics, and lists, its perfect for a business plan presentation. Make your ideas more appealing with these professional slides. Download Evaluating Sales Revenue Budget To Control Risks Ppt Slides Infographics PDF from Slidegeeks today.
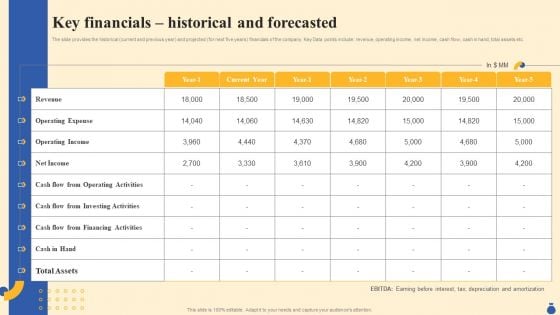
Equity Funding And Debt Financing Pitchbook Key Financials Historical And Forecasted Slides PDF
The slide provides the historical current and previous year and projected for next five years financials of the company. Key Data points include revenue, operating income, net income, cash flow, cash in hand, total assets etc. Are you in need of a template that can accommodate all of your creative concepts This one is crafted professionally and can be altered to fit any style. Use it with Google Slides or PowerPoint. Include striking photographs, symbols, depictions, and other visuals. Fill, move around, or remove text boxes as desired. Test out color palettes and font mixtures. Edit and save your work, or work with colleagues. Download Equity Funding And Debt Financing Pitchbook Key Financials Historical And Forecasted Slides PDF and observe how to make your presentation outstanding. Give an impeccable presentation to your group and make your presentation unforgettable.
Comparative Analysis Of Data Driven Marketing Tools Guide For Data Driven Advertising Icons Pdf
This slide represents the comparison between varied data driven marketing tools based on their key attributes to help marketers choose the best tool for optimizing their marketing strategy. It includes comparison based on features such as marketing attribution, real-time reporting etc.Coming up with a presentation necessitates that the majority of the effort goes into the content and the message you intend to convey. The visuals of a PowerPoint presentation can only be effective if it supplements and supports the story that is being told. Keeping this in mind our experts created Comparative Analysis Of Data Driven Marketing Tools Guide For Data Driven Advertising Icons Pdf to reduce the time that goes into designing the presentation. This way, you can concentrate on the message while our designers take care of providing you with the right template for the situation. This slide represents the comparison between varied data driven marketing tools based on their key attributes to help marketers choose the best tool for optimizing their marketing strategy. It includes comparison based on features such as marketing attribution, real-time reporting etc.
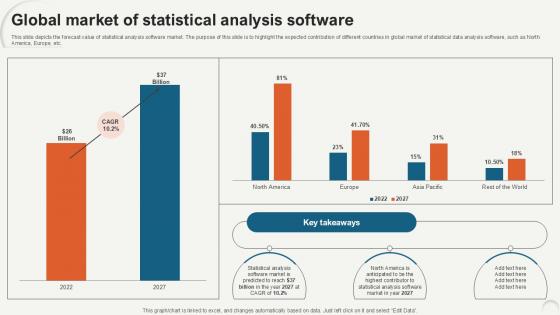
Global Market Of Statistical Data Analytics For Informed Decision Ppt PowerPoint
This slide depicts the forecast value of statistical analysis software market. The purpose of this slide is to highlight the expected contribution of different countries in global market of statistical data analysis software, such as North America, Europe, etc. Are you in need of a template that can accommodate all of your creative concepts This one is crafted professionally and can be altered to fit any style. Use it with Google Slides or PowerPoint. Include striking photographs, symbols, depictions, and other visuals. Fill, move around, or remove text boxes as desired. Test out color palettes and font mixtures. Edit and save your work, or work with colleagues. Download Global Market Of Statistical Data Analytics For Informed Decision Ppt PowerPoint and observe how to make your presentation outstanding. Give an impeccable presentation to your group and make your presentation unforgettable. This slide depicts the forecast value of statistical analysis software market. The purpose of this slide is to highlight the expected contribution of different countries in global market of statistical data analysis software, such as North America, Europe, etc.
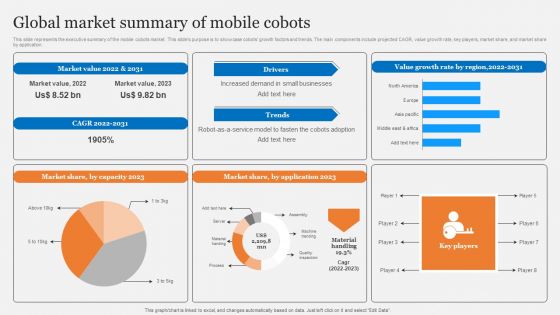
Cobots Usecases In Different Sectors Global Market Summary Of Mobile Cobots Structure PDF
This slide represents the executive summary of the mobile cobots market. This slides purpose is to showcase cobots growth factors and trends. The main components include projected CAGR, value growth rate, key players, market share, and market share by application. Do you have to make sure that everyone on your team knows about any specific topic I yes, then you should give Cobots Usecases In Different Sectors Global Market Summary Of Mobile Cobots Structure PDF a try. Our experts have put a lot of knowledge and effort into creating this impeccable Cobots Usecases In Different Sectors Global Market Summary Of Mobile Cobots Structure PDF. You can use this template for your upcoming presentations, as the slides are perfect to represent even the tiniest detail. You can download these templates from the Slidegeeks website and these are easy to edit. So grab these today.
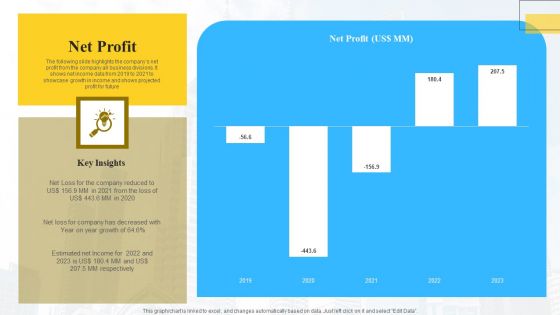
Marketing Insights Company Profile Net Profit Rules PDF
The following slide highlights the companys net profit from the company all business divisions. It shows net income data from 2019 to 2021 to showcase growth in income and shows projected profit for future Whether you have daily or monthly meetings, a brilliant presentation is necessary. Marketing Insights Company Profile Net Profit Rules PDF can be your best option for delivering a presentation. Represent everything in detail using Marketing Insights Company Profile Net Profit Rules PDF and make yourself stand out in meetings. The template is versatile and follows a structure that will cater to your requirements. All the templates prepared by Slidegeeks are easy to download and edit. Our research experts have taken care of the corporate themes as well. So, give it a try and see the results.
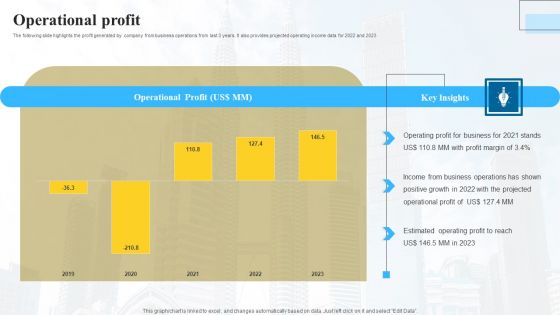
Marketing Insights Company Profile Operational Profit Download PDF
The following slide highlights the profit generated by company from business operations from last 3 years. It also provides projected operating income data for 2022 and 2023 Find highly impressive Marketing Insights Company Profile Operational Profit Download PDF on Slidegeeks to deliver a meaningful presentation. You can save an ample amount of time using these presentation templates. No need to worry to prepare everything from scratch because Slidegeeks experts have already done a huge research and work for you. You need to download Marketing Insights Company Profile Operational Profit Download PDF for your upcoming presentation. All the presentation templates are 100 percent editable and you can change the color and personalize the content accordingly. Download now.
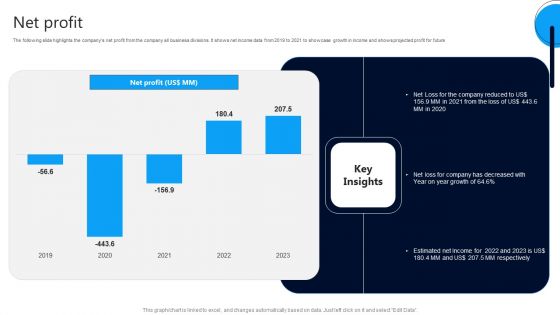
Market Research Evaluation Company Outline Net Profit Graphics PDF
The following slide highlights the companys net profit from the company all business divisions. It shows net income data from 2019 to 2021 to showcase growth in income and shows projected profit for future. Find highly impressive Market Research Evaluation Company Outline Net Profit Graphics PDF on Slidegeeks to deliver a meaningful presentation. You can save an ample amount of time using these presentation templates. No need to worry to prepare everything from scratch because Slidegeeks experts have already done a huge research and work for you. You need to download Market Research Evaluation Company Outline Net Profit Graphics PDF for your upcoming presentation. All the presentation templates are 100 percent editable and you can change the color and personalize the content accordingly. Download now.
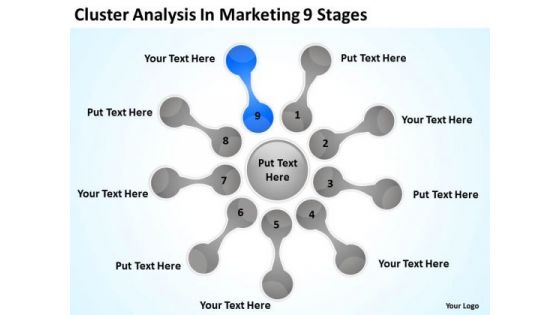
Cluster Analysis In Marketing 9 Stages Actual Business Plan Examples PowerPoint Slides
We present our cluster analysis in marketing 9 stages actual business plan examples PowerPoint Slides.Download and present our Business PowerPoint Templates because Our PowerPoint Templates and Slides are the chords of your song. String them along and provide the lilt to your views. Download and present our Flow Charts PowerPoint Templates because Our PowerPoint Templates and Slides will provide weight to your words. They will bring out the depth of your thought process. Download and present our Process and Flows PowerPoint Templates because Our PowerPoint Templates and Slides are conceived by a dedicated team. Use them and give form to your wondrous ideas. Download and present our Marketing PowerPoint Templates because Our PowerPoint Templates and Slides will give you great value for your money. Be assured of finding the best projection to highlight your words. Download and present our Shapes PowerPoint Templates because Our PowerPoint Templates and Slides will let you Illuminate the road ahead to Pinpoint the important landmarks along the way.Use these PowerPoint slides for presentations relating to Mapping, vector, chart, flow, flowchart, process, model, step, tool, blank, processdiagram, concept, topic, presentation, relate, circle, graphic, data, report, marketing, idea, circlepattern, team, management, graph, cycle, illustration, connection, processchart,direction, plans, color, text, phase, organization, control, connect, link, explanation, mapping, present. The prominent colors used in the PowerPoint template are Blue, Gray, Black. Map out your strategy with our Cluster Analysis In Marketing 9 Stages Actual Business Plan Examples PowerPoint Slides. Download without worries with our money back guaranteee.
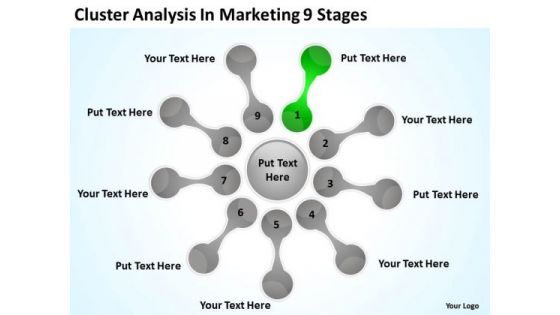
Cluster Analysis In Marketing 9 Stages Basic Business Plan Outline PowerPoint Templates
We present our cluster analysis in marketing 9 stages basic business plan outline PowerPoint templates.Present our Process and Flows PowerPoint Templates because It is Aesthetically crafted by artistic young minds. Our PowerPoint Templates and Slides are designed to display your dexterity. Download our Flow Charts PowerPoint Templates because Our PowerPoint Templates and Slides will give you great value for your money. Be assured of finding the best projection to highlight your words. Use our Marketing PowerPoint Templates because Our PowerPoint Templates and Slides will weave a web of your great ideas. They are gauranteed to attract even the most critical of your colleagues. Download our Shapes PowerPoint Templates because It will let you Set new benchmarks with our PowerPoint Templates and Slides. They will keep your prospects well above par. Use our Business PowerPoint Templates because They will Put your wonderful verbal artistry on display. Our PowerPoint Templates and Slides will provide you the necessary glam and glitter.Use these PowerPoint slides for presentations relating to Mapping, vector, chart, flow, flowchart, process, model, step, tool, blank, processdiagram, concept, topic, presentation, relate, circle, graphic, data, report, marketing, idea, circlepattern, team, management, graph, cycle, illustration, connection, processchart,direction, plans, color, text, phase, organization, control, connect, link, explanation, mapping, present. The prominent colors used in the PowerPoint template are Gray, Green, White. Our Cluster Analysis In Marketing 9 Stages Basic Business Plan Outline PowerPoint Templates create presentations that blow your audience away. With our money back guarantee you have nothing to lose.
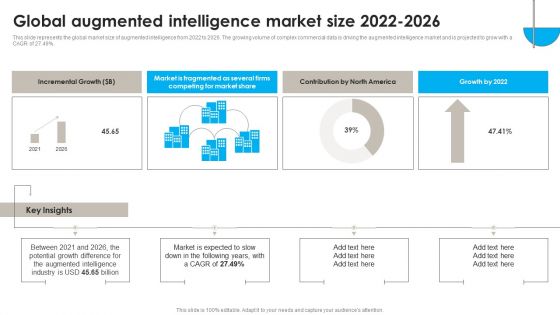
DSS Software Program Global Augmented Intelligence Market Size 2022 To 2026 Introduction PDF
This slide represents the global market size of augmented intelligence from 2022 to 2026. The growing volume of complex commercial data is driving the augmented intelligence market and is projected to grow with a CAGR of 27.49 percent. Find highly impressive DSS Software Program Global Augmented Intelligence Market Size 2022 To 2026 Introduction PDF on Slidegeeks to deliver a meaningful presentation. You can save an ample amount of time using these presentation templates. No need to worry to prepare everything from scratch because Slidegeeks experts have already done a huge research and work for you. You need to download DSS Software Program Global Augmented Intelligence Market Size 2022 To 2026 Introduction PDF for your upcoming presentation. All the presentation templates are 100 percent editable and you can change the color and personalize the content accordingly. Download now.
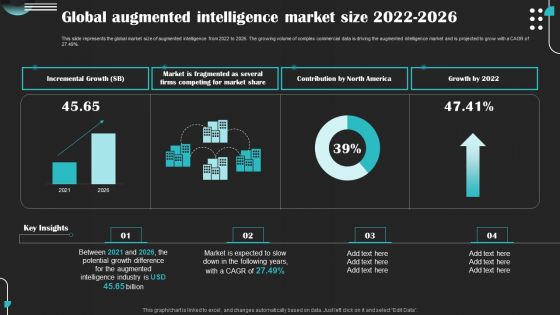
Intelligence Amplification IA IT Global Augmented Intelligence Market Size 2022 2026 Information PDF
This slide represents the global market size of augmented intelligence from 2022 to 2026. The growing volume of complex commercial data is driving the augmented intelligence market and is projected to grow with a CAGR of 27.49 percent. Get a simple yet stunning designed Intelligence Amplification IA IT Global Augmented Intelligence Market Size 2022 2026 Information PDF. It is the best one to establish the tone in your meetings. It is an excellent way to make your presentations highly effective. So, download this PPT today from Slidegeeks and see the positive impacts. Our easy-to-edit Intelligence Amplification IA IT Global Augmented Intelligence Market Size 2022 2026 Information PDF can be your go-to option for all upcoming conferences and meetings. So, what are you waiting for Grab this template today.
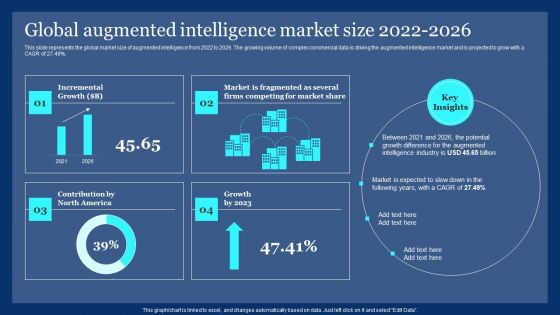
Global Augmented Intelligence Market Size 2022 2026 Ppt PowerPoint Presentation Diagram PDF
This slide represents the global market size of augmented intelligence from 2022 to 2026. The growing volume of complex commercial data is driving the augmented intelligence market and is projected to grow with a CAGR of 27.49 percent. This Global Augmented Intelligence Market Size 2022 2026 Ppt PowerPoint Presentation Diagram PDF from Slidegeeks makes it easy to present information on your topic with precision. It provides customization options, so you can make changes to the colors, design, graphics, or any other component to create a unique layout. It is also available for immediate download, so you can begin using it right away. Slidegeeks has done good research to ensure that you have everything you need to make your presentation stand out. Make a name out there for a brilliant performance.
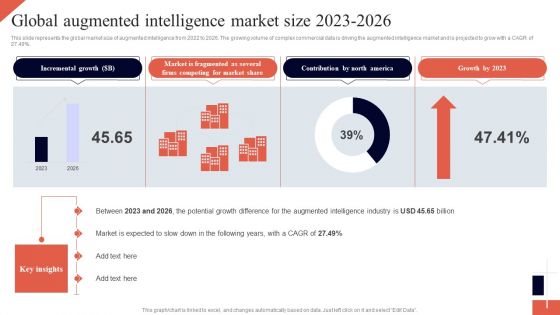
Cognitive Enhancement Global Augmented Intelligence Market Size 2023 2026 Graphics PDF
This slide represents the global market size of augmented intelligence from 2022 to 2026. The growing volume of complex commercial data is driving the augmented intelligence market and is projected to grow with a CAGR of 27.49 percent. Do you know about Slidesgeeks Cognitive Enhancement Global Augmented Intelligence Market Size 2023 2026 Graphics PDF. These are perfect for delivering any kind od presentation. Using it, create PowerPoint presentations that communicate your ideas and engage audiences. Save time and effort by using our pre designed presentation templates that are perfect for a wide range of topic. Our vast selection of designs covers a range of styles, from creative to business, and are all highly customizable and easy to edit. Download as a PowerPoint template or use them as Google Slides themes.
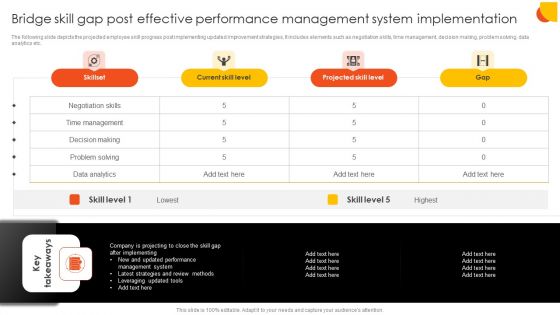
Bridge Skill Gap Post Effective Performance Management System Implementation Portrait PDF
The following slide depicts the projected employee skill progress post implementing updated improvement strategies, It includes elements such as negotiation skills, time management, decision making, problem solving, data analytics etc. Presenting this PowerPoint presentation, titled Bridge Skill Gap Post Effective Performance Management System Implementation Portrait PDF, with topics curated by our researchers after extensive research. This editable presentation is available for immediate download and provides attractive features when used. Download now and captivate your audience. Presenting this Bridge Skill Gap Post Effective Performance Management System Implementation Portrait PDF. Our researchers have carefully researched and created these slides with all aspects taken into consideration. This is a completely customizable Bridge Skill Gap Post Effective Performance Management System Implementation Portrait PDF that is available for immediate downloading. Download now and make an impact on your audience. Highlight the attractive features available with our PPTs.

Global Data Security Industry Report Comprehensive Swot Analysis For Cybersecurity Industry IR SS V
The slide covers the cybersecurity industrys strengths, weaknesses, opportunities, and threats. The slide aims to identify internal and external factors impacting the industrys functioning. It will help stakeholders to develop strategies to achieve their objectives and improve efficiency. Do you have to make sure that everyone on your team knows about any specific topic I yes, then you should give Global Data Security Industry Report Comprehensive Swot Analysis For Cybersecurity Industry IR SS V a try. Our experts have put a lot of knowledge and effort into creating this impeccable Global Data Security Industry Report Comprehensive Swot Analysis For Cybersecurity Industry IR SS V. You can use this template for your upcoming presentations, as the slides are perfect to represent even the tiniest detail. You can download these templates from the Slidegeeks website and these are easy to edit. So grab these today The slide covers the cybersecurity industrys strengths, weaknesses, opportunities, and threats. The slide aims to identify internal and external factors impacting the industrys functioning. It will help stakeholders to develop strategies to achieve their objectives and improve efficiency.
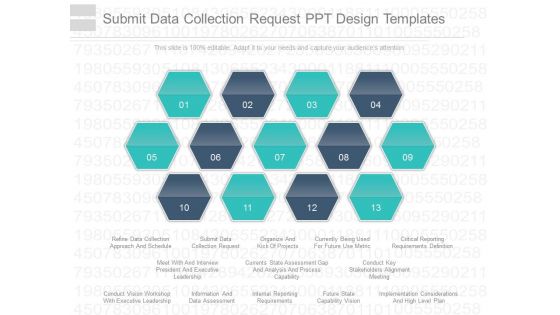
Submit Data Collection Request Ppt Design Templates
This is a submit data collection request ppt design templates. This is a thirteen stage process. The stages in this process are refine data collection approach and schedule, submit data collection request, organize and kick of projects, currently being used for future use metric, critical reporting requirements definition, meet with and interview president and executive leadership, currents state assessment gap and analysis and process capability, conduct key stakeholders alignment meeting, conduct vision workshop with executive leadership, information and data assessment, internal reporting requirements, future state capability vision, implementation considerations and high level plan.
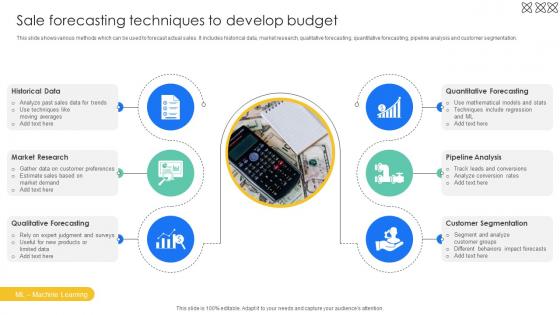
Sale Forecasting Techniques To Develop Effective And Efficient Tools To Develop Fin SS V
This slide shows various methods which can be used to forecast actual sales. It includes historical data, market research, qualitative forecasting, quantitative forecasting, pipeline analysis and customer segmentation. Coming up with a presentation necessitates that the majority of the effort goes into the content and the message you intend to convey. The visuals of a PowerPoint presentation can only be effective if it supplements and supports the story that is being told. Keeping this in mind our experts created Sale Forecasting Techniques To Develop Effective And Efficient Tools To Develop Fin SS V to reduce the time that goes into designing the presentation. This way, you can concentrate on the message while our designers take care of providing you with the right template for the situation. This slide shows various methods which can be used to forecast actual sales. It includes historical data, market research, qualitative forecasting, quantitative forecasting, pipeline analysis and customer segmentation.
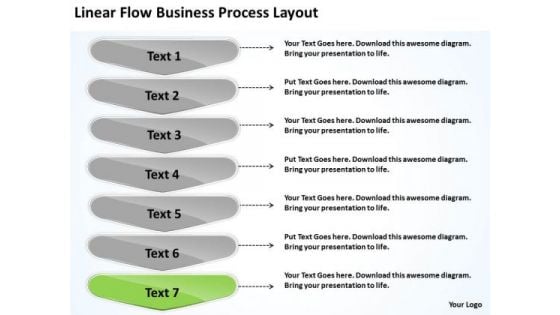
New Business PowerPoint Presentation Process Layout Flow Chart Maker Free Slides
We present our new business powerpoint presentation process layout flow chart maker free Slides.Use our Marketing PowerPoint Templates because this PPt slide helps you to measure key aspects of the current process and collect relevant data. Present our Business PowerPoint Templates because you are sure you have the right people for your plans. Present our Signs PowerPoint Templates because there is a vision, a need you can meet. Download and present our Arrows PowerPoint Templates because this structure meant to ensure smooth transition to the next level. Use our Arrows PowerPoint Templates because you can take it along a sure fire road to good profit.Use these PowerPoint slides for presentations relating to Abstract, Arrow, Arrows, Business, Chart, Design, Development, Diagram, Direction, Element, Flow, Flowchart, Graph, Linear, Management, Model, Motion, Organization, Plan, Process, Program, Section, Segment, Set, Sign, Solution, Strategy, Symbol, Technology. The prominent colors used in the PowerPoint template are Green, Gray, White. PowerPoint presentation experts tell us our new business powerpoint presentation process layout flow chart maker free Slides provide great value for your money. Be assured of finding the best projection to highlight your words. Customers tell us our Arrows PowerPoint templates and PPT Slides are Nice. Use our new business powerpoint presentation process layout flow chart maker free Slides are Tranquil. Use our Direction PowerPoint templates and PPT Slides provide you with a vast range of viable options. Select the appropriate ones and just fill in your text. We assure you our new business powerpoint presentation process layout flow chart maker free Slides provide great value for your money. Be assured of finding the best projection to highlight your words. People tell us our Chart PowerPoint templates and PPT Slides are Amazing. Join an elite group of presenters with our New Business PowerPoint Presentation Process Layout Flow Chart Maker Free Slides. Make sure your presentation gets the attention it deserves.
Data Analysis Reports Under Magnifying Glass Ppt PowerPoint Presentation Icon Graphic Tips
Presenting this set of slides with name data analysis reports under magnifying glass ppt powerpoint presentation icon graphic tips. This is a three stage process. The stages in this process are data visualization icon, research analysis, business focus. This is a completely editable PowerPoint presentation and is available for immediate download. Download now and impress your audience.

Benefits Of Leveraging Decision Tree Analysis Data Analytics SS V
This slide outlines key advantages of leveraging decision tree analysis aimed at identifying correct solutions to any problem. It covers the benefits such as depicts suitable project, easy classification, assistance for multiple tools, etc.Coming up with a presentation necessitates that the majority of the effort goes into the content and the message you intend to convey. The visuals of a PowerPoint presentation can only be effective if it supplements and supports the story that is being told. Keeping this in mind our experts created Benefits Of Leveraging Decision Tree Analysis Data Analytics SS V to reduce the time that goes into designing the presentation. This way, you can concentrate on the message while our designers take care of providing you with the right template for the situation. This slide outlines key advantages of leveraging decision tree analysis aimed at identifying correct solutions to any problem. It covers the benefits such as depicts suitable project, easy classification, assistance for multiple tools, etc.
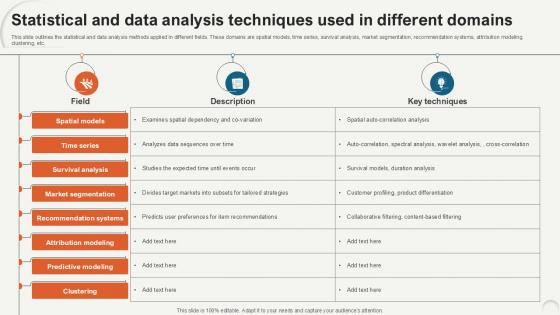
Statistical And Data Analysis Techniques Data Analytics For Informed Decision Ppt Sample
This slide outlines the statistical and data analysis methods applied in different fields. These domains are spatial models, time series, survival analysis, market segmentation, recommendation systems, attribution modeling, clustering, etc. Boost your pitch with our creative Statistical And Data Analysis Techniques Data Analytics For Informed Decision Ppt Sample. Deliver an awe-inspiring pitch that will mesmerize everyone. Using these presentation templates you will surely catch everyones attention. You can browse the ppts collection on our website. We have researchers who are experts at creating the right content for the templates. So you do not have to invest time in any additional work. Just grab the template now and use them. This slide outlines the statistical and data analysis methods applied in different fields. These domains are spatial models, time series, survival analysis, market segmentation, recommendation systems, attribution modeling, clustering, etc.
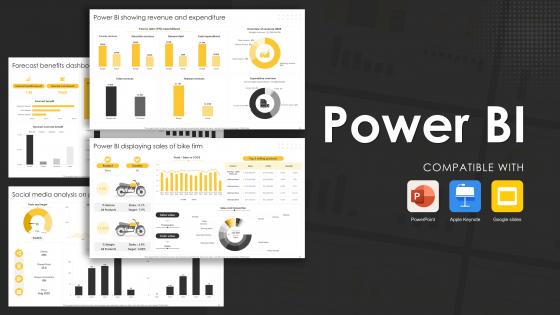
Power BI Powerpoint PPT Template Bundles
This Power BI Powerpoint PPT Template Bundles is a primer on how to capitalize on business opportunities through planning, innovation, and market intelligence. The content-ready format of the complete deck will make your job as a decision-maker a lot easier. Use this ready-made PowerPoint Template to help you outline an extensive and legible plan to capture markets and grow your company on the right path, at an exponential pace. What is even more amazing is that this presentation is completely editable and 100 percent customizable. This Data Visualization,Project Report,Business Intelligence,Data Model,Technology Project-slide complete deck helps you impress a roomful of people with your expertise in business and even presentation. Craft such a professional and appealing presentation for that amazing recall value. Download now. Our Power BI PowerPoint PPT Template Bundles are carefully crafted to provide a visually appealing and professional backdrop for any subject. These templates allow you to convey data insights and statistics with clarity and impact, making you appear professional and confident.
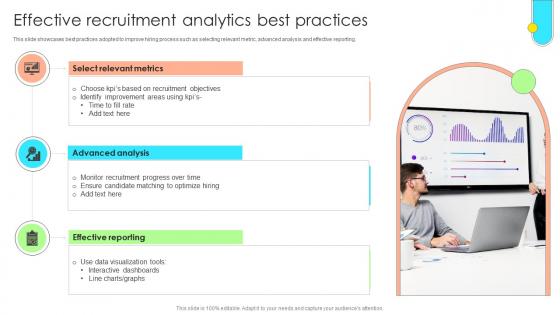
Data Driven Approach To Optimise Effective Recruitment Analytics Best Practices CRP SS V
This slide showcases best practices adopted to improve hiring process such as selecting relevant metric, advanced analysis and effective reporting. Crafting an eye-catching presentation has never been more straightforward. Let your presentation shine with this tasteful yet straightforward Data Driven Approach To Optimise Effective Recruitment Analytics Best Practices CRP SS V template. It offers a minimalistic and classy look that is great for making a statement. The colors have been employed intelligently to add a bit of playfulness while still remaining professional. Construct the ideal Data Driven Approach To Optimise Effective Recruitment Analytics Best Practices CRP SS V that effortlessly grabs the attention of your audience Begin now and be certain to wow your customers This slide showcases best practices adopted to improve hiring process such as selecting relevant metric, advanced analysis and effective reporting.
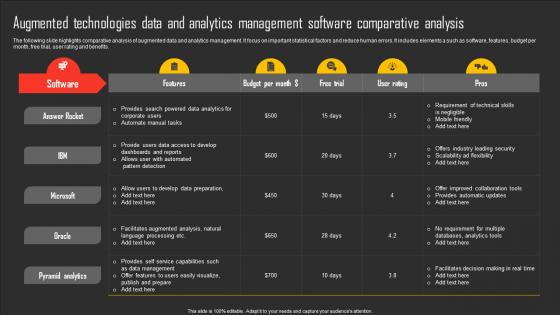
Augmented Technologies Data And Analytics Management Software Comparative Analysis Formats Pdf
The following slide highlights comparative analysis of augmented data and analytics management. It focus on important statistical factors and reduce human errors. It includes elements a such as software, features, budget per month, free trial, user rating and benefits. Showcasing this set of slides titled Augmented Technologies Data And Analytics Management Software Comparative Analysis Formats Pdf. The topics addressed in these templates are Answer Rocket, Microsoft, Pyramid Analytics . All the content presented in this PPT design is completely editable. Download it and make adjustments in color, background, font etc. as per your unique business setting. The following slide highlights comparative analysis of augmented data and analytics management. It focus on important statistical factors and reduce human errors. It includes elements a such as software, features, budget per month, free trial, user rating and benefits.
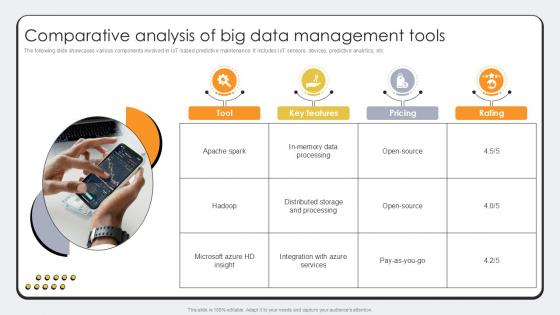
Comparative Analysis Of Big Data Revolutionizing Production IoT Ppt Slide
The following slide showcases various components involved in IoT-based predictive maintenance. It includes IoT sensors, devices, predictive analytics, etc. Slidegeeks is here to make your presentations a breeze with Comparative Analysis Of Big Data Revolutionizing Production IoT Ppt Slide With our easy-to-use and customizable templates, you can focus on delivering your ideas rather than worrying about formatting. With a variety of designs to choose from, you are sure to find one that suits your needs. And with animations and unique photos, illustrations, and fonts, you can make your presentation pop. So whether you are giving a sales pitch or presenting to the board, make sure to check out Slidegeeks first The following slide showcases various components involved in IoT-based predictive maintenance. It includes IoT sensors, devices, predictive analytics, etc.
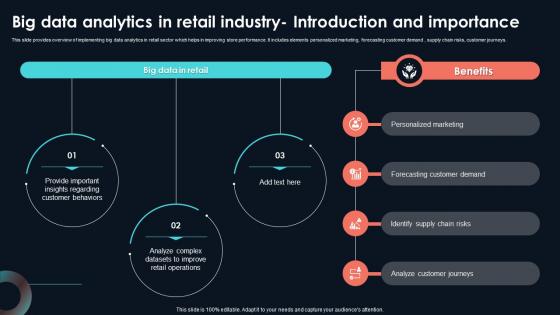
Big Data Analytics In Retail Industry Developing Strategic Insights Using Big Data Analytics SS V
This slide provides overview of implementing big data analytics in retail sector which helps in improving store performance. It includes elements personalized marketing, forecasting customer demand , supply chain risks, customer journeys. Are you in need of a template that can accommodate all of your creative concepts This one is crafted professionally and can be altered to fit any style. Use it with Google Slides or PowerPoint. Include striking photographs, symbols, depictions, and other visuals. Fill, move around, or remove text boxes as desired. Test out color palettes and font mixtures. Edit and save your work, or work with colleagues. Download Big Data Analytics In Retail Industry Developing Strategic Insights Using Big Data Analytics SS V and observe how to make your presentation outstanding. Give an impeccable presentation to your group and make your presentation unforgettable. This slide provides overview of implementing big data analytics in retail sector which helps in improving store performance. It includes elements personalized marketing, forecasting customer demand , supply chain risks, customer journeys.
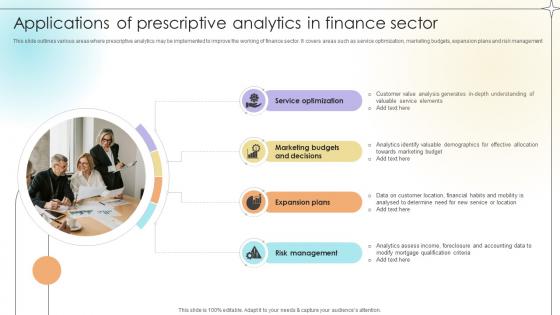
Applications Of Prescriptive Analytics In Finance Sector Data Analytics SS V
This slide outlines various areas where prescriptive analytics may be implemented to improve the working of finance sector. It covers areas such as service optimization, marketing budgets, expansion plans and risk management.Present like a pro with Applications Of Prescriptive Analytics In Finance Sector Data Analytics SS V. Create beautiful presentations together with your team, using our easy-to-use presentation slides. Share your ideas in real-time and make changes on the fly by downloading our templates. So whether you are in the office, on the go, or in a remote location, you can stay in sync with your team and present your ideas with confidence. With Slidegeeks presentation got a whole lot easier. Grab these presentations today. This slide outlines various areas where prescriptive analytics may be implemented to improve the working of finance sector. It covers areas such as service optimization, marketing budgets, expansion plans and risk management.

Global Cybersecurity Industry Segmentation Analysis Global Data Security Industry Report IR SS V
The slide showcases the cyber security industry segmentation based on attributes such as component, security type, deployment, organization size, end-user and region. This slide aims to identify, analyze and categorize the market to serve clients demands and meet their expectations. Boost your pitch with our creative Global Cybersecurity Industry Segmentation Analysis Global Data Security Industry Report IR SS V. Deliver an awe-inspiring pitch that will mesmerize everyone. Using these presentation templates you will surely catch everyones attention. You can browse the ppts collection on our website. We have researchers who are experts at creating the right content for the templates. So you do not have to invest time in any additional work. Just grab the template now and use them. The slide showcases the cyber security industry segmentation based on attributes such as component, security type, deployment, organization size, end-user and region. This slide aims to identify, analyze and categorize the market to serve clients demands and meet their expectations.
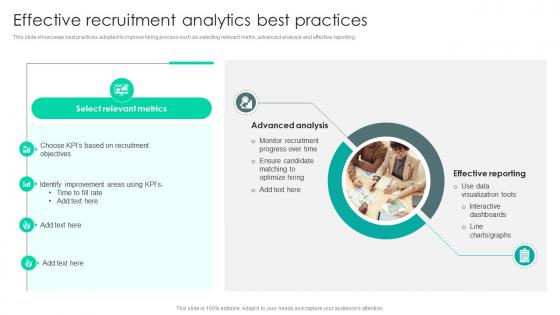
Strategic Staffing Using Data Effective Recruitment Analytics Best Practices CRP DK SS V
This slide showcases best practices adopted to improve hiring process such as selecting relevant metric, advanced analysis and effective reporting. Formulating a presentation can take up a lot of effort and time, so the content and message should always be the primary focus. The visuals of the PowerPoint can enhance the presenters message, so our Strategic Staffing Using Data Effective Recruitment Analytics Best Practices CRP DK SS V was created to help save time. Instead of worrying about the design, the presenter can concentrate on the message while our designers work on creating the ideal templates for whatever situation is needed. Slidegeeks has experts for everything from amazing designs to valuable content, we have put everything into Strategic Staffing Using Data Effective Recruitment Analytics Best Practices CRP DK SS V. This slide showcases best practices adopted to improve hiring process such as selecting relevant metric, advanced analysis and effective reporting.
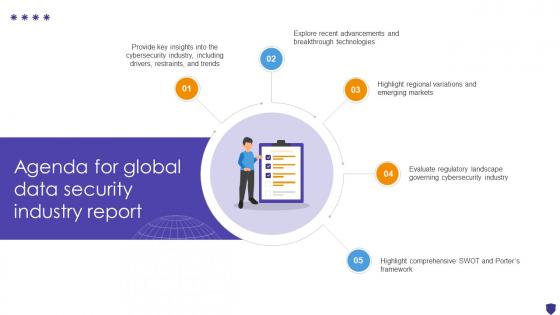
Agenda For Global Data Security Industry Report IR SS V
Find a pre-designed and impeccable Agenda For Global Data Security Industry Report IR SS V. The templates can ace your presentation without additional effort. You can download these easy-to-edit presentation templates to make your presentation stand out from others. So, what are you waiting for Download the template from Slidegeeks today and give a unique touch to your presentation. Our Agenda For Global Data Security Industry Report IR SS V are topically designed to provide an attractive backdrop to any subject. Use them to look like a presentation pro.
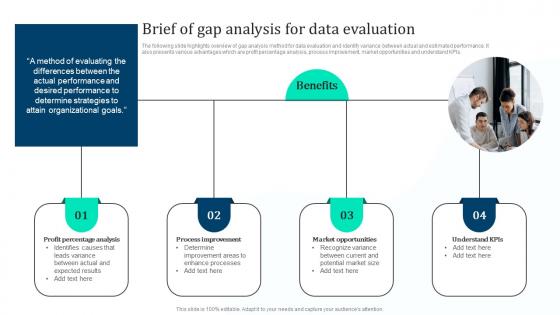
Brief Of Gap Analysis Data Marketing Intelligence Guide Data Gathering Clipart Pdf
The following slide highlights overview of gap analysis method for data evaluation and identify variance between actual and estimated performance. It also presents various advantages which are profit percentage analysis, process improvement, market opportunities and understand KPIs. Slidegeeks is one of the best resources for PowerPoint templates. You can download easily and regulate Brief Of Gap Analysis Data Marketing Intelligence Guide Data Gathering Clipart Pdf for your personal presentations from our wonderful collection. A few clicks is all it takes to discover and get the most relevant and appropriate templates. Use our Templates to add a unique zing and appeal to your presentation and meetings. All the slides are easy to edit and you can use them even for advertisement purposes. The following slide highlights overview of gap analysis method for data evaluation and identify variance between actual and estimated performance. It also presents various advantages which are profit percentage analysis, process improvement, market opportunities and understand KPIs.
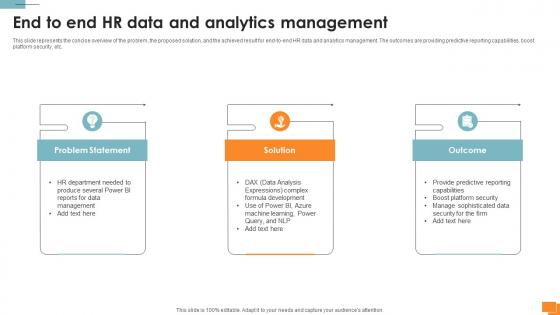
Statistical Tools For Evidence End To End HR Data And Analytics Management
This slide represents the concise overview of the problem, the proposed solution, and the achieved result for end-to-end HR data and analytics management. The outcomes are providing predictive reporting capabilities, boost platform security, etc. Coming up with a presentation necessitates that the majority of the effort goes into the content and the message you intend to convey. The visuals of a PowerPoint presentation can only be effective if it supplements and supports the story that is being told. Keeping this in mind our experts created Statistical Tools For Evidence End To End HR Data And Analytics Management to reduce the time that goes into designing the presentation. This way, you can concentrate on the message while our designers take care of providing you with the right template for the situation. This slide represents the concise overview of the problem, the proposed solution, and the achieved result for end-to-end HR data and analytics management. The outcomes are providing predictive reporting capabilities, boost platform security, etc.

Global Data Security Industry Report Covid 19 Impact Assessment On Cybersecurity Industry IR SS V
The slide represents a comprehensive analysis of the covid-19 impact on the cybersecurity industry The purpose is to understand how the pandemic has shaped cybersecurity adoption and the significance of adapting cybersecurity technologies responsibly amidst global challenges. It covers both positive and negative impacts. Get a simple yet stunning designed Global Data Security Industry Report Covid 19 Impact Assessment On Cybersecurity Industry IR SS V. It is the best one to establish the tone in your meetings. It is an excellent way to make your presentations highly effective. So, download this PPT today from Slidegeeks and see the positive impacts. Our easy-to-edit Global Data Security Industry Report Covid 19 Impact Assessment On Cybersecurity Industry IR SS V can be your go-to option for all upcoming conferences and meetings. So, what are you waiting for Grab this template today. The slide represents a comprehensive analysis of the covid-19 impact on the cybersecurity industry The purpose is to understand how the pandemic has shaped cybersecurity adoption and the significance of adapting cybersecurity technologies responsibly amidst global challenges. It covers both positive and negative impacts.
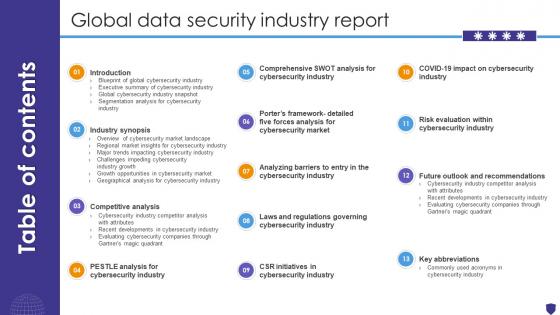
Table Of Contents For Global Data Security Industry Report IR SS V
Retrieve professionally designed Table Of Contents For Global Data Security Industry Report IR SS V to effectively convey your message and captivate your listeners. Save time by selecting pre-made slideshows that are appropriate for various topics, from business to educational purposes. These themes come in many different styles, from creative to corporate, and all of them are easily adjustable and can be edited quickly. Access them as PowerPoint templates or as Google Slides themes. You do not have to go on a hunt for the perfect presentation because Slidegeeks got you covered from everywhere. Our Table Of Contents For Global Data Security Industry Report IR SS V are topically designed to provide an attractive backdrop to any subject. Use them to look like a presentation pro.
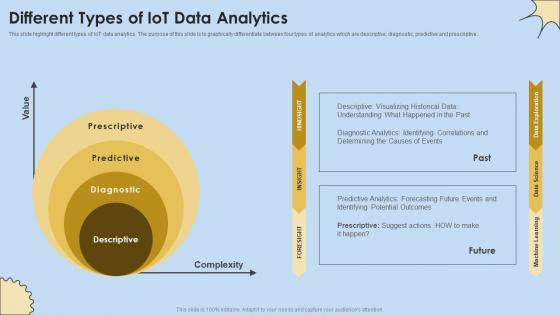
Different Types Of IoT Data Analytics Internet Of Things Analysis Mockup Pdf
This slide highlight different types of IoT data analytics. The purpose of this slide is to graphically differentiate between four types of analytics which are descriptive, diagnostic, predictive and prescriptive. Are you in need of a template that can accommodate all of your creative concepts This one is crafted professionally and can be altered to fit any style. Use it with Google Slides or PowerPoint. Include striking photographs, symbols, depictions, and other visuals. Fill, move around, or remove text boxes as desired. Test out color palettes and font mixtures. Edit and save your work, or work with colleagues. Download Different Types Of IoT Data Analytics Internet Of Things Analysis Mockup Pdf and observe how to make your presentation outstanding. Give an impeccable presentation to your group and make your presentation unforgettable. This slide highlight different types of IoT data analytics. The purpose of this slide is to graphically differentiate between four types of analytics which are descriptive, diagnostic, predictive and prescriptive.

Global Data Security Industry Report Porters Framework Detailed Five Forces Analysis For Cybersecurity IR SS V
The slide highlights Porters framework and its implications in the cybersecurity industry. Evaluating the five forces can assist businesses in anticipating changes in the competition, influencing the evolution of industry structure, and finding more beneficial strategic positions. It covers the threat of new entrants and substitutes, competitive rivalry, and the bargaining power of suppliers and buyers. Welcome to our selection of the Global Data Security Industry Report Porters Framework Detailed Five Forces Analysis For Cybersecurity IR SS V. These are designed to help you showcase your creativity and bring your sphere to life. Planning and Innovation are essential for any business that is just starting out. This collection contains the designs that you need for your everyday presentations. All of our PowerPoints are 100Percent editable, so you can customize them to suit your needs. This multi-purpose template can be used in various situations. Grab these presentation templates today. The slide highlights Porters framework and its implications in the cybersecurity industry. Evaluating the five forces can assist businesses in anticipating changes in the competition, influencing the evolution of industry structure, and finding more beneficial strategic positions. It covers the threat of new entrants and substitutes, competitive rivalry, and the bargaining power of suppliers and buyers.
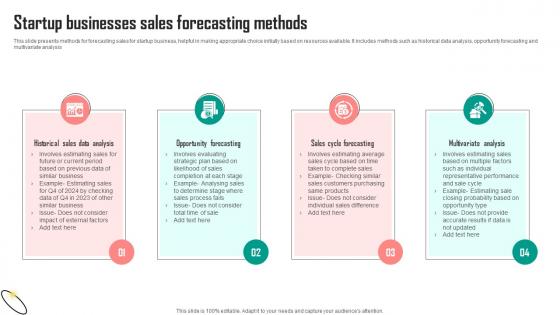
Startup Businesses Sales Forecasting Methods Demonstration Pdf
This slide presents methods for forecasting sales for startup business, helpful in making appropriate choice initially based on resources available. It includes methods such as historical data analysis, opportunity forecasting and multivariate analysis Showcasing this set of slides titled Startup Businesses Sales Forecasting Methods Demonstration Pdf. The topics addressed in these templates are Data Analysis, Opportunity Forecasting, Cycle Forecasting. All the content presented in this PPT design is completely editable. Download it and make adjustments in color, background, font etc. as per your unique business setting. This slide presents methods for forecasting sales for startup business, helpful in making appropriate choice initially based on resources available. It includes methods such as historical data analysis, opportunity forecasting and multivariate analysis
Data Reports Visualization Vector Ppt PowerPoint Presentation Visual Aids Deck
Presenting this set of slides with name data reports visualization vector ppt powerpoint presentation visual aids deck. The topics discussed in these slides are data visualization icon, research analysis, business focus. This is a completely editable PowerPoint presentation and is available for immediate download. Download now and impress your audience.

HR Analytics Metrics For Data Driven Decision Summary Pdf
This slide illustrates human resource key performance indicators that help organization to analyze actionable insights for taking effective and date driven decision. It includes KPIs such as recruitment, employee engagement, retention and diversity and inclusion.Pitch your topic with ease and precision using this HR Analytics Metrics For Data Driven Decision Summary Pdf This layout presents information on Estimate Accumulated, Involved Recruitment, Provide Actionable Insight It is also available for immediate download and adjustment. So, changes can be made in the color, design, graphics or any other component to create a unique layout. This slide illustrates human resource key performance indicators that help organization to analyze actionable insights for taking effective and date driven decision. It includes KPIs such as recruitment, employee engagement, retention and diversity and inclusion.
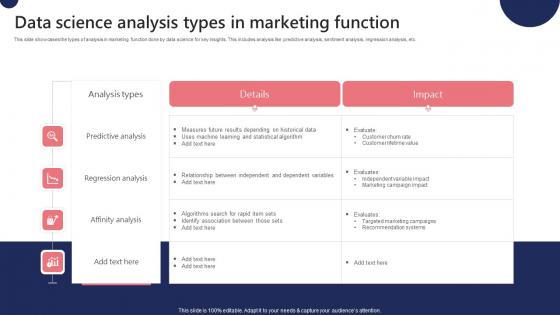
Data Science Analysis Types In Marketing Function Ppt Ideas Designs Download Pdf
This slide showcases the types of analysis in marketing function done by data science for key insights. This includes analysis like predictive analysis, sentiment analysis, regression analysis, etc. Pitch your topic with ease and precision using this Data Science Analysis Types In Marketing Function Ppt Ideas Designs Download Pdf. This layout presents information on Predictive Analysis, Sentiment Analysis, Regression Analysis. It is also available for immediate download and adjustment. So, changes can be made in the color, design, graphics or any other component to create a unique layout. This slide showcases the types of analysis in marketing function done by data science for key insights. This includes analysis like predictive analysis, sentiment analysis, regression analysis, etc.
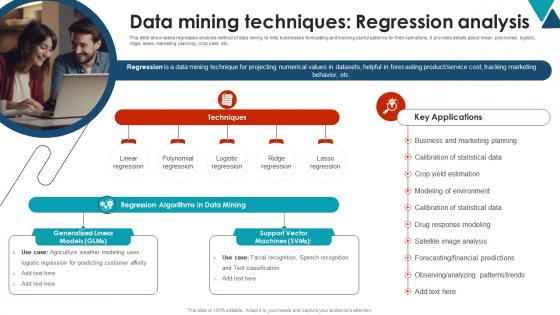
Data Mining Techniques Regression Analysis Using Data Mining Tools To Optimize Processes AI SS V
This slide showcases regression analysis method of data mining to help businesses forecasting and tracking useful patterns for their operations. It provides details about linear, polynomial, logistic, ridge, lasso, marketing planning, crop yield, etc. Presenting this PowerPoint presentation, titled Data Mining Techniques Regression Analysis Using Data Mining Tools To Optimize Processes AI SS V, with topics curated by our researchers after extensive research. This editable presentation is available for immediate download and provides attractive features when used. Download now and captivate your audience. Presenting this Data Mining Techniques Regression Analysis Using Data Mining Tools To Optimize Processes AI SS V. Our researchers have carefully researched and created these slides with all aspects taken into consideration. This is a completely customizable Data Mining Techniques Regression Analysis Using Data Mining Tools To Optimize Processes AI SS V that is available for immediate downloading. Download now and make an impact on your audience. Highlight the attractive features available with our PPTs. This slide showcases regression analysis method of data mining to help businesses forecasting and tracking useful patterns for their operations. It provides details about linear, polynomial, logistic, ridge, lasso, marketing planning, crop yield, etc.

Data Analysis Types Provides By BI Mockup Pdf
This slide represents the type of analytics provided by the business intelligence for business performance enhancement. This includes descriptive analysis, diagnostic analysis, predictive analytics, etc. Pitch your topic with ease and precision using this Data Analysis Types Provides By BI Mockup Pdf. This layout presents information on Descriptive Analytics, Diagnostic Analytics, Predictive Analytics. It is also available for immediate download and adjustment. So, changes can be made in the color, design, graphics or any other component to create a unique layout. This slide represents the type of analytics provided by the business intelligence for business performance enhancement. This includes descriptive analysis, diagnostic analysis, predictive analytics, etc.

Statistical Analytics In Food Processing Data Analytics For Informed Decision Ppt PowerPoint
This slide represents the concise overview of the problem, the proposed solution, and the achieved result for using data analytics in food processing outlet. The outcomes are precise food quantity forecasts, optimized resource allocation, etc. Find a pre-designed and impeccable Statistical Analytics In Food Processing Data Analytics For Informed Decision Ppt PowerPoint. The templates can ace your presentation without additional effort. You can download these easy-to-edit presentation templates to make your presentation stand out from others. So, what are you waiting for Download the template from Slidegeeks today and give a unique touch to your presentation. This slide represents the concise overview of the problem, the proposed solution, and the achieved result for using data analytics in food processing outlet. The outcomes are precise food quantity forecasts, optimized resource allocation, etc.

Application Of Artificial Intelligence In Data Analysis Data Analytics SS V
This slide outlines applications of AI in data analysis aimed at helping businesses save time and effort. It covers application areas such as generate code or debug errors, explain analysis, create reports and automated data entry .Slidegeeks is one of the best resources for PowerPoint templates. You can download easily and regulate Application Of Artificial Intelligence In Data Analysis Data Analytics SS V for your personal presentations from our wonderful collection. A few clicks is all it takes to discover and get the most relevant and appropriate templates. Use our Templates to add a unique zing and appeal to your presentation and meetings. All the slides are easy to edit and you can use them even for advertisement purposes. This slide outlines applications of AI in data analysis aimed at helping businesses save time and effort. It covers application areas such as generate code or debug errors, explain analysis, create reports and automated data entry .
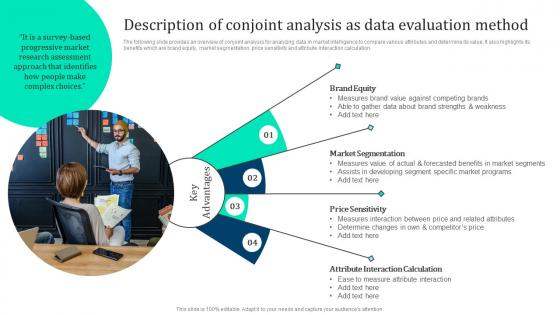
Description Conjoint Analysis Data Marketing Intelligence Guide Data Gathering Microsoft Pdf
The following slide provides an overview of conjoint analysis for analyzing data in market intelligence to compare various attributes and determine its value. It also highlights its benefits which are brand equity, market segmentation, price sensitivity and attribute interaction calculation. Do you have an important presentation coming up Are you looking for something that will make your presentation stand out from the rest Look no further than Description Conjoint Analysis Data Marketing Intelligence Guide Data Gathering Microsoft Pdf. With our professional designs, you can trust that your presentation will pop and make delivering it a smooth process. And with Slidegeeks, you can trust that your presentation will be unique and memorable. So why wait Grab Description Conjoint Analysis Data Marketing Intelligence Guide Data Gathering Microsoft Pdf today and make your presentation stand out from the rest The following slide provides an overview of conjoint analysis for analyzing data in market intelligence to compare various attributes and determine its value. It also highlights its benefits which are brand equity, market segmentation, price sensitivity and attribute interaction calculation.
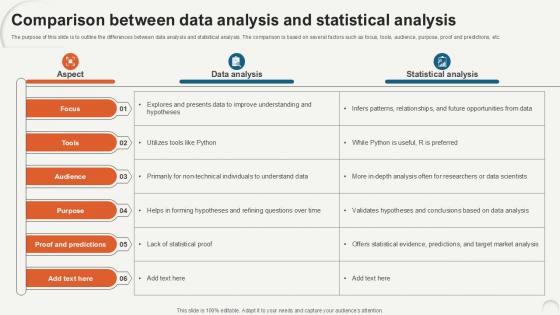
Comparison Between Data Analytics For Informed Decision Ppt Presentation
The purpose of this slide is to outline the differences between data analysis and statistical analysis. The comparison is based on several factors such as focus, tools, audience, purpose, proof and predictions, etc. From laying roadmaps to briefing everything in detail, our templates are perfect for you. You can set the stage with your presentation slides. All you have to do is download these easy-to-edit and customizable templates. Comparison Between Data Analytics For Informed Decision Ppt Presentation will help you deliver an outstanding performance that everyone would remember and praise you for. Do download this presentation today. The purpose of this slide is to outline the differences between data analysis and statistical analysis. The comparison is based on several factors such as focus, tools, audience, purpose, proof and predictions, etc.
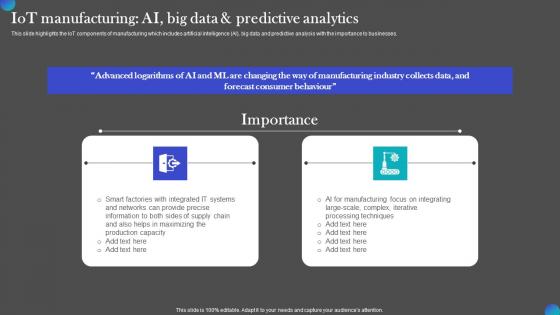
IOT Manufacturing AI Big Data And Predictive IOT Adoption Manufacturing Structure PDF
This slide highlights the IoT components of manufacturing which includes artificial intelligence AI, big data and predictive analysis with the importance to businesses. This IOT Manufacturing AI Big Data And Predictive IOT Adoption Manufacturing Structure PDF is perfect for any presentation, be it in front of clients or colleagues. It is a versatile and stylish solution for organizing your meetings. The IOT Manufacturing AI Big Data And Predictive IOT Adoption Manufacturing Structure PDF features a modern design for your presentation meetings. The adjustable and customizable slides provide unlimited possibilities for acing up your presentation. Slidegeeks has done all the homework before launching the product for you. So, do not wait, grab the presentation templates today This slide highlights the IoT components of manufacturing which includes artificial intelligence AI, big data and predictive analysis with the importance to businesses.
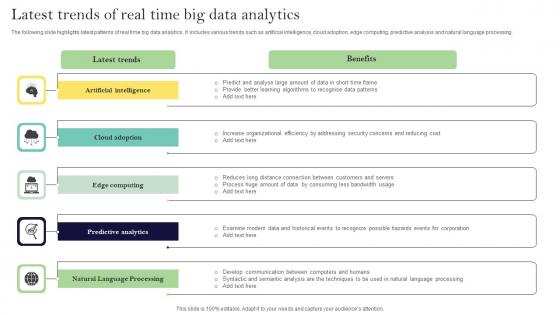
Latest Trends Of Real Time Big Data Analytics Ppt Infographic Template Smartart Pdf
The following slide highlights latest patterns of real time big data analytics. It includes various trends such as artificial intelligence, cloud adoption, edge computing, predictive analysis and natural language processing. Showcasing this set of slides titled Latest Trends Of Real Time Big Data Analytics Ppt Infographic Template Smartart Pdf. The topics addressed in these templates are Edge Computing, Predictive Analysis, Natural Language Processing. All the content presented in this PPT design is completely editable. Download it and make adjustments in color, background, font etc. as per your unique business setting. The following slide highlights latest patterns of real time big data analytics. It includes various trends such as artificial intelligence, cloud adoption, edge computing, predictive analysis and natural language processing.

Key Features Of Prescriptive Data Analytics Data Analytics SS V
This slide provides a table comparing four types of analytics such as descriptive diagnostic, predictive and prescriptive analytics. The basis of comparison are definition, focus.Present like a pro with Key Features Of Prescriptive Data Analytics Data Analytics SS V. Create beautiful presentations together with your team, using our easy-to-use presentation slides. Share your ideas in real-time and make changes on the fly by downloading our templates. So whether you are in the office, on the go, or in a remote location, you can stay in sync with your team and present your ideas with confidence. With Slidegeeks presentation got a whole lot easier. Grab these presentations today. This slide provides a table comparing four types of analytics such as descriptive diagnostic, predictive and prescriptive analytics. The basis of comparison are definition, focus.
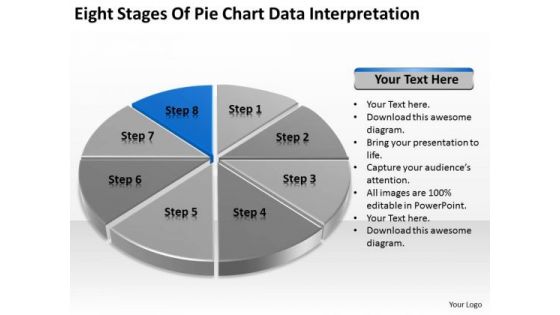
Eight Stages Of Pie Chart Data Interpretation Detailed Business Plan PowerPoint Templates
We present our eight stages of pie chart data interpretation detailed business plan PowerPoint templates.Download and present our Competition PowerPoint Templates because You can Stir your ideas in the cauldron of our PowerPoint Templates and Slides. Cast a magic spell on your audience. Download and present our Marketing PowerPoint Templates because You should Kick up a storm with our PowerPoint Templates and Slides. The heads of your listeners will swirl with your ideas. Download and present our Arrows PowerPoint Templates because Your ideas provide food for thought. Our PowerPoint Templates and Slides will help you create a dish to tickle the most discerning palate. Present our Circle Charts PowerPoint Templates because You can Stir your ideas in the cauldron of our PowerPoint Templates and Slides. Cast a magic spell on your audience. Download our Business PowerPoint Templates because You can Score a slam dunk with our PowerPoint Templates and Slides. Watch your audience hang onto your every word.Use these PowerPoint slides for presentations relating to chart, graph, pie, 3d, diagram, graphic, icon, control, business, data, profit, market, sales, display, corporate, concept, render, success, presentation, finance, report, marketing, accounting, management, piece, strategy, money, growth, company, competition, progress, account, sheet, part, information, investment, improvement, banking, index, financial, reflect, results, performance, exchange. The prominent colors used in the PowerPoint template are Blue, Black, Gray. Exult in the comfort of our Eight Stages Of Pie Chart Data Interpretation Detailed Business Plan PowerPoint Templates. Experience the convenience they deliver.
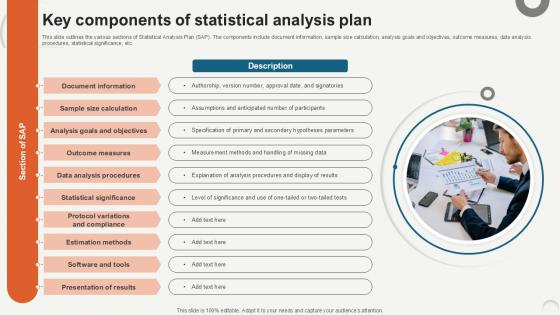
Key Components Of Statistical Data Analytics For Informed Decision Ppt Example
This slide outlines the various sections of Statistical Analysis Plan SAP. The components include document information, sample size calculation, analysis goals and objectives, outcome measures, data analysis procedures, statistical significance, etc. This Key Components Of Statistical Data Analytics For Informed Decision Ppt Example is perfect for any presentation, be it in front of clients or colleagues. It is a versatile and stylish solution for organizing your meetings. The Key Components Of Statistical Data Analytics For Informed Decision Ppt Example features a modern design for your presentation meetings. The adjustable and customizable slides provide unlimited possibilities for acing up your presentation. Slidegeeks has done all the homework before launching the product for you. So, do not wait, grab the presentation templates today This slide outlines the various sections of Statistical Analysis Plan SAP. The components include document information, sample size calculation, analysis goals and objectives, outcome measures, data analysis procedures, statistical significance, etc.
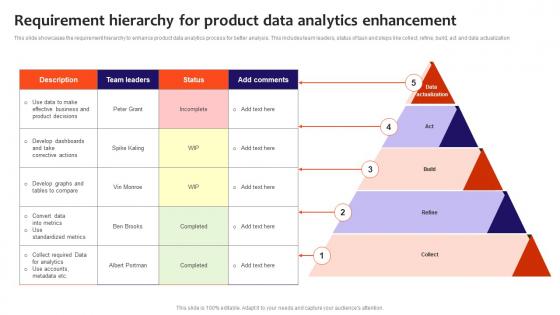
Requirement Hierarchy For Product Data Analytics Enhancement Clipart Pdf
This slide showcases the requirement hierarchy to enhance product data analytics process for better analysis. This includes team leaders, status of task and steps like collect, refine, build, act and data actualization Showcasing this set of slides titled Requirement Hierarchy For Product Data Analytics Enhancement Clipart Pdf. The topics addressed in these templates are Develop Graphs, Collect Required Data, Develop Dashboards. All the content presented in this PPT design is completely editable. Download it and make adjustments in color, background, font etc. as per your unique business setting. This slide showcases the requirement hierarchy to enhance product data analytics process for better analysis. This includes team leaders, status of task and steps like collect, refine, build, act and data actualization
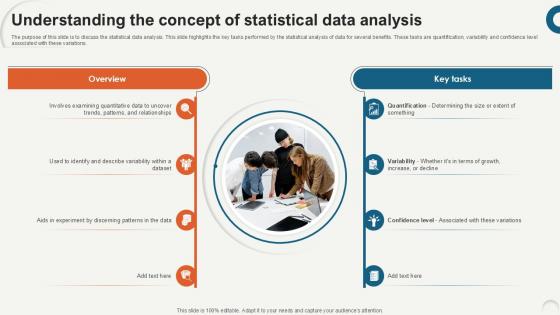
Understanding The Concept Of Data Analytics For Informed Decision Ppt Template
The purpose of this slide is to discuss the statistical data analysis. This slide highlights the key tasks performed by the statistical analysis of data for several benefits. These tasks are quantification, variability and confidence level associated with these variations. Do you have an important presentation coming up Are you looking for something that will make your presentation stand out from the rest Look no further than Understanding The Concept Of Data Analytics For Informed Decision Ppt Template. With our professional designs, you can trust that your presentation will pop and make delivering it a smooth process. And with Slidegeeks, you can trust that your presentation will be unique and memorable. So why wait Grab Understanding The Concept Of Data Analytics For Informed Decision Ppt Template today and make your presentation stand out from the rest The purpose of this slide is to discuss the statistical data analysis. This slide highlights the key tasks performed by the statistical analysis of data for several benefits. These tasks are quantification, variability and confidence level associated with these variations.
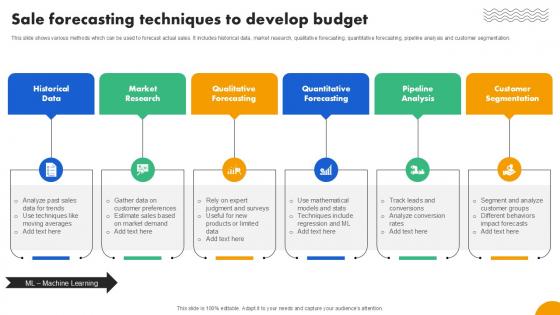
Sale Forecasting Techniques To Strategies To Develop Effective Ppt Presentation Fin SS V
This slide shows various methods which can be used to forecast actual sales. It includes historical data, market research, qualitative forecasting, quantitative forecasting, pipeline analysis and customer segmentation. Boost your pitch with our creative Sale Forecasting Techniques To Strategies To Develop Effective Ppt Presentation Fin SS V. Deliver an awe-inspiring pitch that will mesmerize everyone. Using these presentation templates you will surely catch everyones attention. You can browse the ppts collection on our website. We have researchers who are experts at creating the right content for the templates. So you do not have to invest time in any additional work. Just grab the template now and use them. This slide shows various methods which can be used to forecast actual sales. It includes historical data, market research, qualitative forecasting, quantitative forecasting, pipeline analysis and customer segmentation.

Advanced Big Data Analytics Framework Developing Strategic Insights Using Big Data Analytics SS V
This slide showcases framework illustrating use of big data analytics in retain industry to improve operational efficiency. It includes elements such as demand forecasting, personalized marketing, price optimization, fraud detection etc. Boost your pitch with our creative Advanced Big Data Analytics Framework Developing Strategic Insights Using Big Data Analytics SS V. Deliver an awe-inspiring pitch that will mesmerize everyone. Using these presentation templates you will surely catch everyones attention. You can browse the ppts collection on our website. We have researchers who are experts at creating the right content for the templates. So you do not have to invest time in any additional work. Just grab the template now and use them. This slide showcases framework illustrating use of big data analytics in retain industry to improve operational efficiency. It includes elements such as demand forecasting, personalized marketing, price optimization, fraud detection etc.
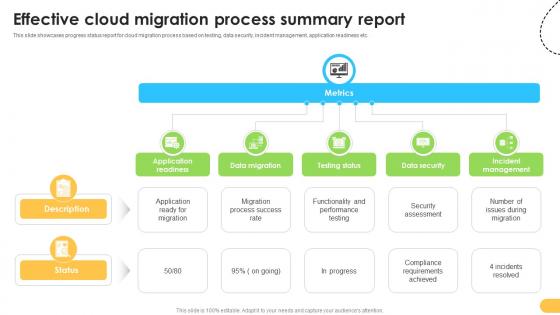
Effective Cloud Migration Process Summary Report Data Migration From On Premises
This slide showcases progress status report for cloud migration process based on testing, data security, incident management, application readiness etc. Are you in need of a template that can accommodate all of your creative concepts This one is crafted professionally and can be altered to fit any style. Use it with Google Slides or PowerPoint. Include striking photographs, symbols, depictions, and other visuals. Fill, move around, or remove text boxes as desired. Test out color palettes and font mixtures. Edit and save your work, or work with colleagues. Download Effective Cloud Migration Process Summary Report Data Migration From On Premises and observe how to make your presentation outstanding. Give an impeccable presentation to your group and make your presentation unforgettable. This slide showcases progress status report for cloud migration process based on testing, data security, incident management, application readiness etc.


 Continue with Email

 Home
Home


