Project Dashboard
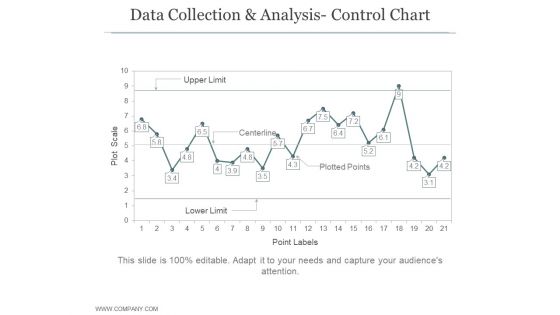
Data Collection And Analysis Control Chart Ppt PowerPoint Presentation Example File
This is a data collection and analysis control chart ppt powerpoint presentation example file. This is a four stage process. The stages in this process are business, strategy, marketing, bar graph, growth strategy.
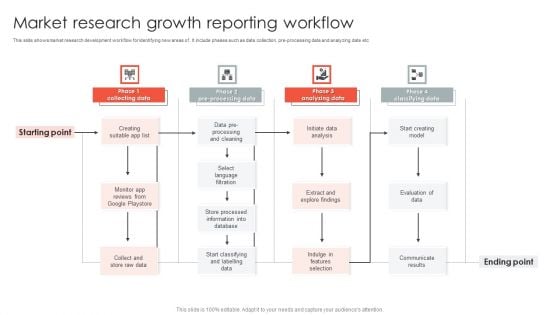
Market Research Growth Reporting Workflow Infographics PDF
This slide shows market research development workflow for identifying new areas of . It include phases such as data collection, pre-processing data and analyzing date etc. Showcasing this set of slides titled Market Research Growth Reporting Workflow Infographics PDF. The topics addressed in these templates are Processing Cleaning, Language Filtration, Information Database. All the content presented in this PPT design is completely editable. Download it and make adjustments in color, background, font etc. as per your unique business setting.
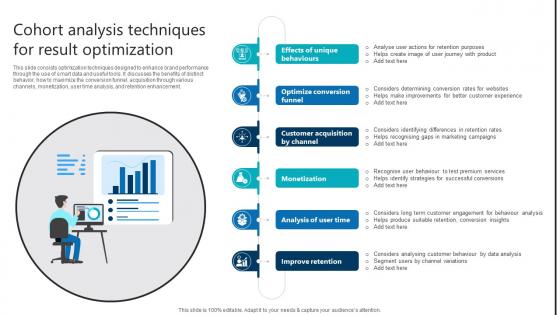
Cohort Analysis Techniques For Result Optimization Product Analytics Implementation Data Analytics V
This slide consists optimization techniques designed to enhance brand performance through the use of smart data and useful tools. It discusses the benefits of distinct behavior, how to maximize the conversion funnel, acquisition through various channels, monetization, user time analysis, and retention enhancement. Whether you have daily or monthly meetings, a brilliant presentation is necessary. Cohort Analysis Techniques For Result Optimization Product Analytics Implementation Data Analytics V can be your best option for delivering a presentation. Represent everything in detail using Cohort Analysis Techniques For Result Optimization Product Analytics Implementation Data Analytics V and make yourself stand out in meetings. The template is versatile and follows a structure that will cater to your requirements. All the templates prepared by Slidegeeks are easy to download and edit. Our research experts have taken care of the corporate themes as well. So, give it a try and see the results. This slide consists optimization techniques designed to enhance brand performance through the use of smart data and useful tools. It discusses the benefits of distinct behavior, how to maximize the conversion funnel, acquisition through various channels, monetization, user time analysis, and retention enhancement.
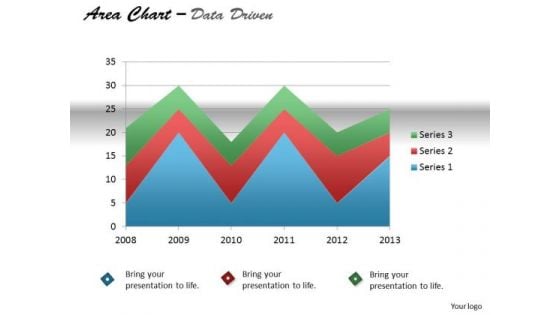
Quantitative Data Analysis Driven Display Series With Area Chart PowerPoint Slides Templates
Our quantitative data analysis driven display series with area chart powerpoint slides Templates Enjoy Drama. They Provide Entertaining Backdrops.
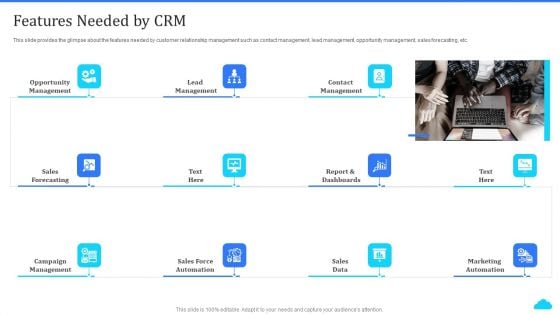
Cloud Based CRM Tools Features Needed By CRM Ppt Ideas Example PDF
This slide provides the glimpse about the features needed by customer relationship management such as contact management, lead management, opportunity management, sales forecasting, etc. Presenting cloud based crm tools features needed by crm ppt ideas example pdf to provide visual cues and insights. Share and navigate important information on eleven stages that need your due attention. This template can be used to pitch topics like opportunity management, dashboards, sales data, marketing automation. In addtion, this PPT design contains high resolution images, graphics, etc, that are easily editable and available for immediate download.
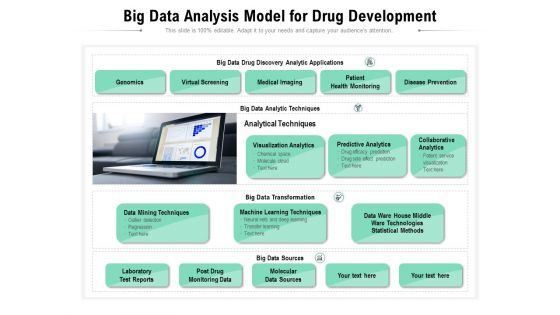
Big Data Analysis Model For Drug Development Ppt PowerPoint Presentation Show Vector PDF
Presenting this set of slides with name big data analysis model for drug development ppt powerpoint presentation show vector pdf. This is a four stage process. The stages in this process are genomics, virtual screening, medical imaging, patient health monitoring, disease prevention, data mining techniques, machine learning techniques, big data sources, laboratory test reports, molecular, data sources. This is a completely editable PowerPoint presentation and is available for immediate download. Download now and impress your audience.
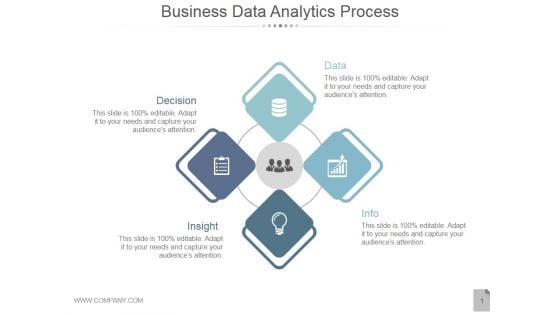
Business Data Analytics Process Ppt PowerPoint Presentation Layout
This is a business data analytics process ppt powerpoint presentation layout. This is a four stage process. The stages in this process are decision, data, insight, info.

Internet Of Things In Manufacturing Sector Iot Manufacturing AI Big Data And Predictive Analytics Demonstration PDF
This slide highlights the IoT components of manufacturing which includes artificial intelligence AI, big data and predictive analysis with the importance to businesses. The Internet Of Things In Manufacturing Sector Iot Manufacturing AI Big Data And Predictive Analytics Demonstration PDF is a compilation of the most recent design trends as a series of slides. It is suitable for any subject or industry presentation, containing attractive visuals and photo spots for businesses to clearly express their messages. This template contains a variety of slides for the user to input data, such as structures to contrast two elements, bullet points, and slides for written information. Slidegeeks is prepared to create an impression.
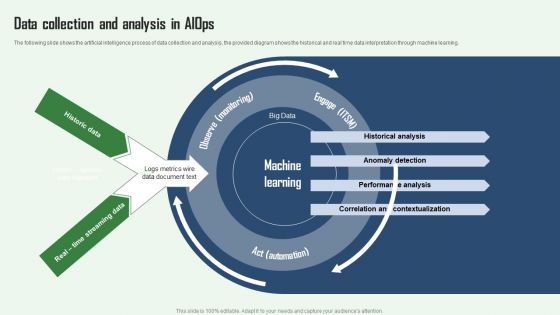
Aiops Integration Summary Report Data Collection And Analysis In Aiops Slides PDF
The following slide shows the artificial intelligence process of data collection and analysis, the provided diagram shows the historical and real time data interpretation through machine learning. Want to ace your presentation in front of a live audience Our Aiops Integration Summary Report Data Collection And Analysis In Aiops Slides PDF can help you do that by engaging all the users towards you. Slidegeeks experts have put their efforts and expertise into creating these impeccable powerpoint presentations so that you can communicate your ideas clearly. Moreover, all the templates are customizable, and easy to edit and downloadable. Use these for both personal and commercial use.
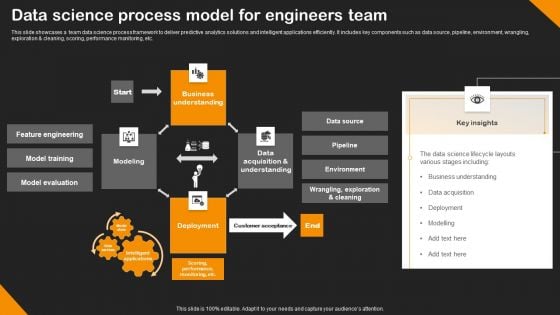
Data Science Process Model For Engineers Team Rules PDF
This slide showcases a team data science process framework to deliver predictive analytics solutions and intelligent applications efficiently. It includes key components such as data source, pipeline, environment, wrangling, exploration and cleaning, scoring, performance monitoring, etc. Showcasing this set of slides titled Data Science Process Model For Engineers Team Rules PDF. The topics addressed in these templates are Model Training, Model Evaluation, Business Understanding. All the content presented in this PPT design is completely editable. Download it and make adjustments in color, background, font etc. as per your unique business setting.
Success Metrics For Data Analytics Speculation Business Analysis Modification Toolkit Icons PDF
This slide shows the key success factors for evaluating the success of data analytics program. The foremost key metrics includes discovery, insights, outcomes and actions.Presenting Success Metrics For Data Analytics Speculation Business Analysis Modification Toolkit Icons PDF to provide visual cues and insights. Share and navigate important information on four stages that need your due attention. This template can be used to pitch topics like Observations Information, Generate Insights, Keys Success. In addtion, this PPT design contains high resolution images, graphics, etc, that are easily editable and available for immediate download.
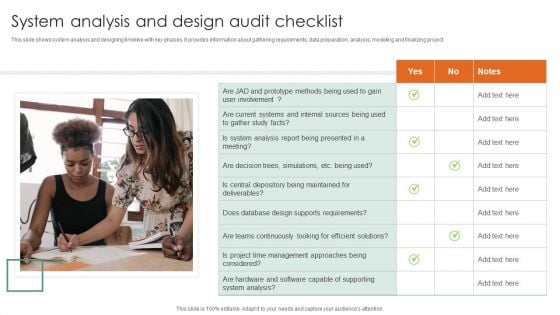
System Analysis And Design Audit Checklist Ppt Layouts Pictures PDF
This slide shows system analysis and designing timeline with key phases. It provides information about gathering requirements, data preparation, analysis, modeling and finalizing project. Presenting System Analysis And Design Audit Checklist Ppt Layouts Pictures PDF to dispense important information. This template comprises one stages. It also presents valuable insights into the topics including JAD And Prototype, Does Database Design, Supports Requirements. This is a completely customizable PowerPoint theme that can be put to use immediately. So, download it and address the topic impactfully.
Product Wise Pipeline Analysis Ppt PowerPoint Presentation Professional Files
This is a our goal ppt powerpoint presentation slides files. This is a four stage process. The stages in this process are business, marketing, strategy, planning, icons.
Big Data Analysis Icon Data Analytic Business Ppt PowerPoint Presentation Complete Deck
Presenting this set of slides with name big data analysis icon data analytic business ppt powerpoint presentation complete deck. The topics discussed in these slides are data analytic, business, growth, gear, magnifying glass. This is a completely editable PowerPoint presentation and is available for immediate download. Download now and impress your audience.
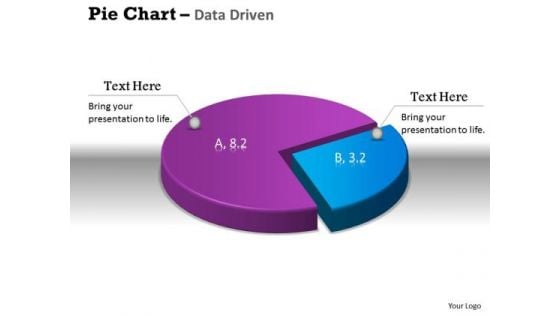
Data Analysis Excel 3d Pie Chart Shows Relative Size Of PowerPoint Templates
Get The Doers Into Action. Activate Them With Our data analysis excel 3d pie chart shows relative size of Powerpoint Templates.
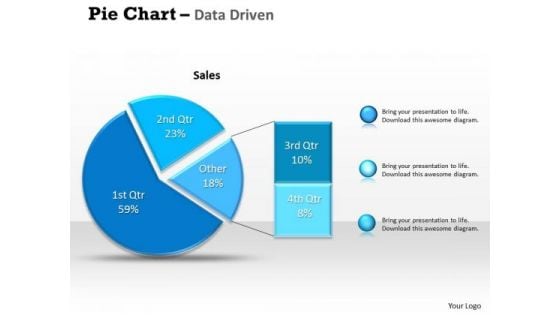
Data Analysis Excel Driven Percentage Breakdown Pie Chart PowerPoint Slides Templates
Be A Donor Of Great Ideas. Display Your Charity On Our data analysis excel driven percentage breakdown pie chart powerpoint slides Templates.
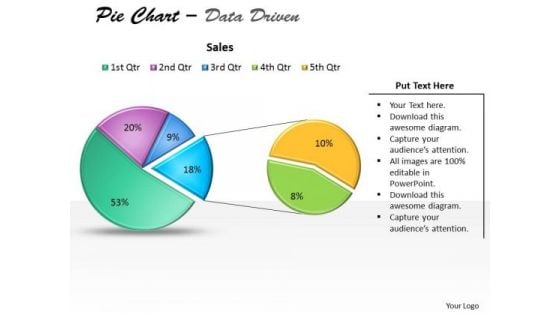
Data Analysis Excel Driven Pie Chart For Business Stratregy PowerPoint Slides Templates
Open Up Doors That Lead To Success. Our data analysis excel driven pie chart for business stratregy powerpoint slides Templates Provide The Handles.

Data Analysis Excel Driven Pie Chart For Easy Comparison PowerPoint Slides Templates
Our data analysis excel driven pie chart for easy comparison powerpoint slides Templates Abhor Doodling. They Never Let The Interest Flag.
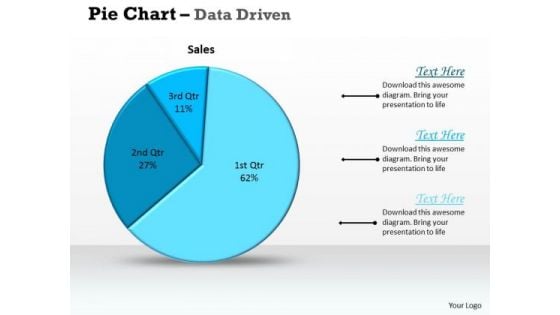
Data Analysis Excel Driven Pie Chart For Sales Process PowerPoint Slides Templates
Deliver The Right Dose With Our data analysis excel driven pie chart for sales process powerpoint slides Templates . Your Ideas Will Get The Correct Illumination.
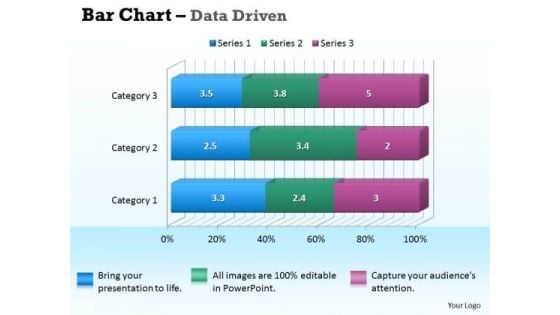
Data Analysis In Excel 3d Bar Chart For Business Information PowerPoint Templates
Our data analysis in excel 3d bar chart for business information Powerpoint Templates Deliver At Your Doorstep. Let Them In For A Wonderful Experience.
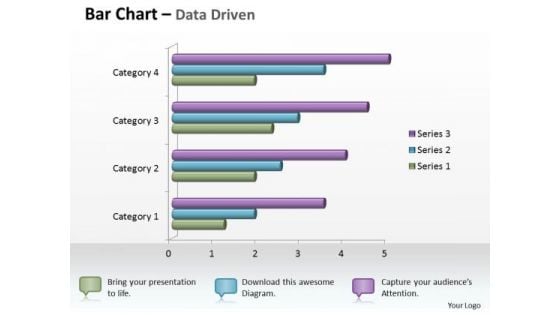
Data Analysis In Excel 3d Bar Chart For Business Statistics PowerPoint Templates
Knock On The Door To Success With Our data analysis in excel 3d bar chart for business statistics Powerpoint Templates . Be Assured Of Gaining Entry.
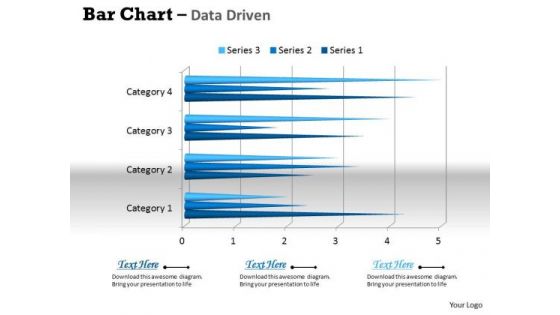
Data Analysis In Excel 3d Bar Chart For Business Trends PowerPoint Templates
Connect The Dots With Our data analysis in excel 3d bar chart for business trends Powerpoint Templates . Watch The Whole Picture Clearly Emerge.
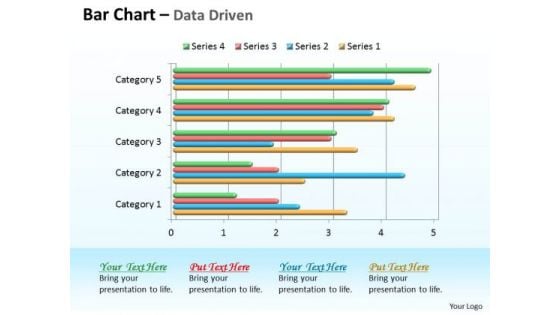
Data Analysis In Excel 3d Bar Chart For Comparison Of Time Series PowerPoint Templates
Double Your Chances With Our data analysis in excel 3d bar chart for comparison of time series Powerpoint Templates . The Value Of Your Thoughts Will Increase Two-Fold.
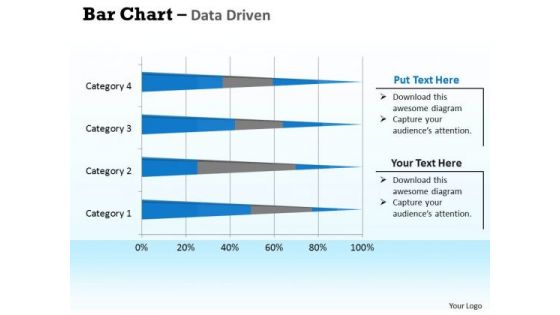
Data Analysis In Excel 3d Bar Chart For Interpretation PowerPoint Templates
Double Up Our data analysis in excel 3d bar chart for interpretation Powerpoint Templates With Your Thoughts. They Will Make An Awesome Pair.
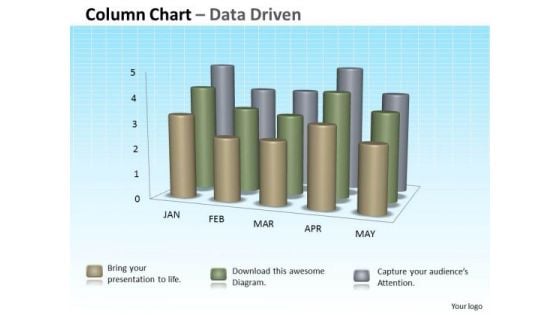
Data Analysis In Excel 3d Column Chart For Sets Of Information PowerPoint Templates
Double The Impact With Our data analysis in excel 3d column chart for sets of information Powerpoint Templates . Your Thoughts Will Have An Imposing Effect.
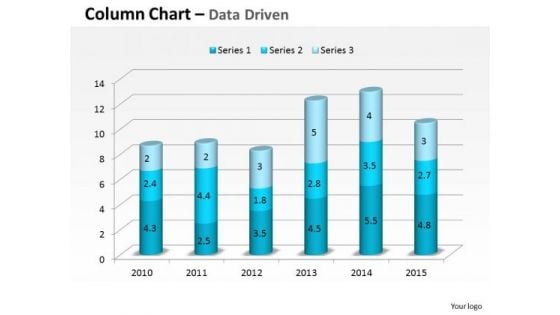
Data Analysis In Excel 3d Compare Yearly Business Performance PowerPoint Templates
Plan For All Contingencies With Our data analysis in excel 3d compare yearly business performance Powerpoint Templates . Douse The Fire Before It Catches.
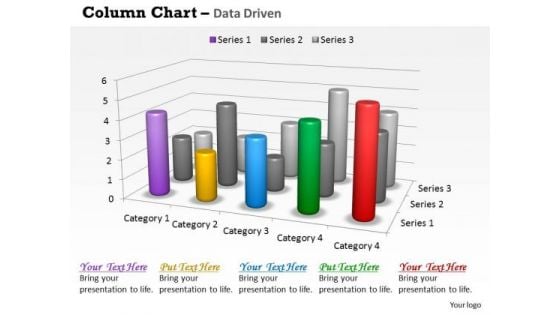
Data Analysis In Excel 3d Survey For Sales Chart PowerPoint Templates
Good Camaraderie Is A Key To Teamwork. Our data analysis in excel 3d survey for sales chart Powerpoint Templates Can Be A Cementing Force.
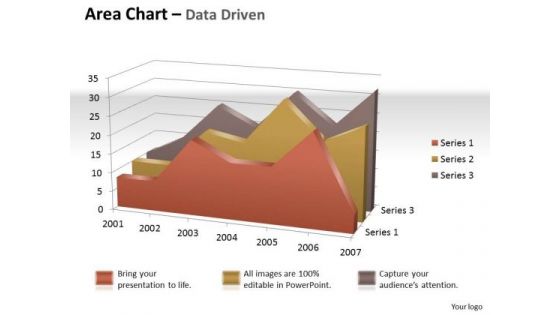
Data Analysis In Excel 3d Visual Display Of Area Chart PowerPoint Templates
Brace Yourself, Arm Your Thoughts. Prepare For The Hustle With Our data analysis in excel 3d visual display of area chart Powerpoint Templates .
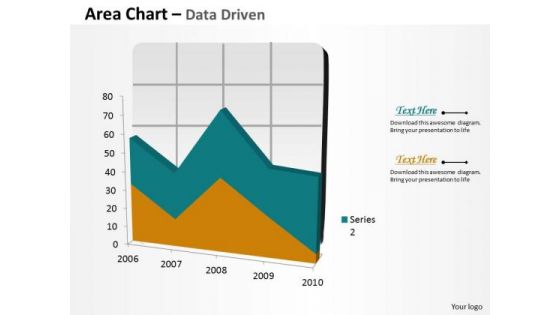
Data Analysis In Excel Area Chart For Business Process PowerPoint Templates
Your Grasp Of Economics Is Well Known. Help Your Audience Comprehend Issues With Our data analysis in excel area chart for business process Powerpoint Templates .
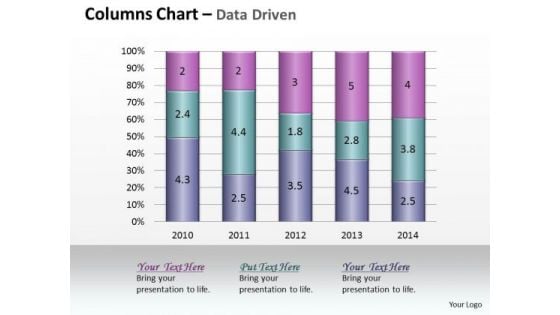
Data Analysis In Excel Column Chart Of Various Fields PowerPoint Templates
Land The Idea With Our data analysis in excel column chart of various fields Powerpoint Templates . Help It Grow With Your Thoughts.
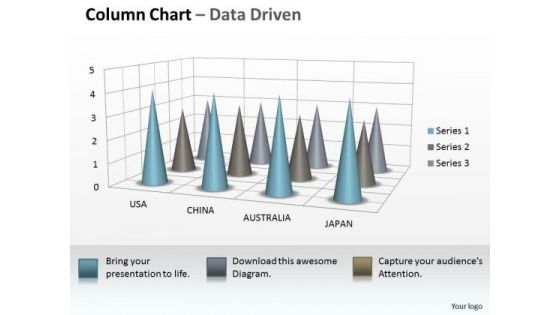
Data Analysis On Excel 3d Chart To Incorporate Business Information PowerPoint Templates
Our data analysis on excel 3d chart to incorporate business information Powerpoint Templates Allow You To Do It With Ease. Just Like Picking The Low Hanging Fruit.
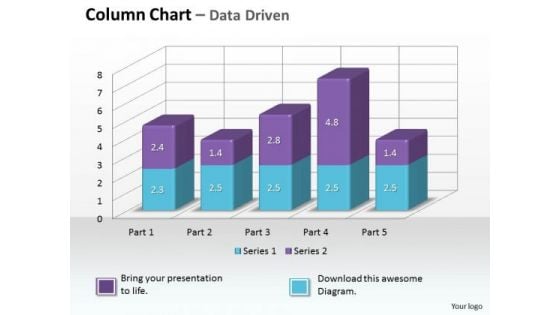
Data Analysis On Excel 3d Chart To Monitor Business Process PowerPoint Templates
Make Some Dough With Our data analysis on excel 3d chart to monitor business process Powerpoint Templates . Your Assets Will Rise Significantly.
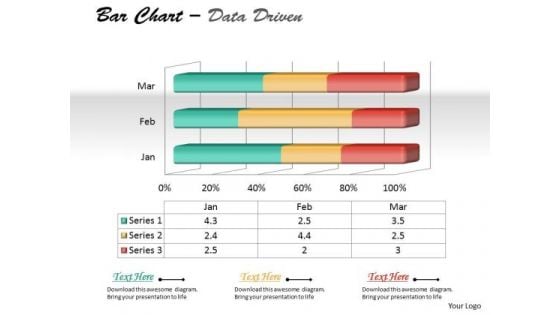
Data Analysis On Excel 3d Chart To Represent Quantitative Differences PowerPoint Templates
Draft It Out On Our data analysis on excel 3d chart to represent quantitative differences Powerpoint Templates . Give The Final Touches With Your Ideas.
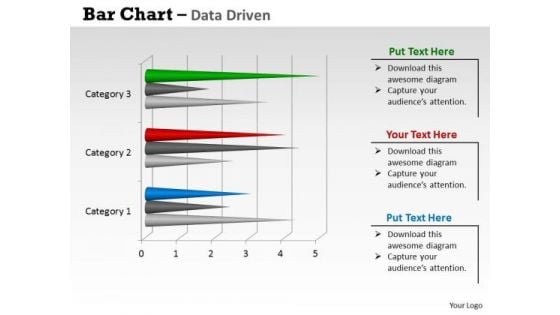
Data Analysis On Excel 3d Chart With Sets Of PowerPoint Templates
Reduce The Drag With Our data analysis on excel 3d chart with sets of Powerpoint Templates . Give More Lift To Your Thoughts.

Data Analysis On Excel Driven Sets Of Business Information PowerPoint Slides Templates
Break The Deadlock With Our data analysis on excel driven sets of business information powerpoint slides Templates . Let The Words Start To Flow.
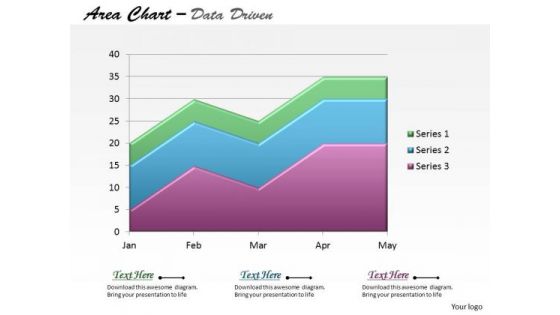
Data Analysis On Excel Driven Stacked Area Chart PowerPoint Slides Templates
Be The Dramatist With Our data analysis on excel driven stacked area chart powerpoint slides Templates . Script Out The Play Of Words.
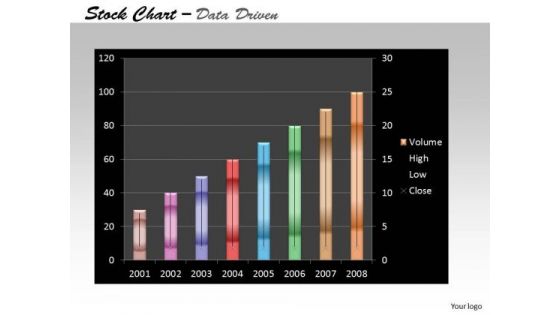
Data Analysis On Excel Driven Stock Chart For Business Growth PowerPoint Slides Templates
Add Some Dramatization To Your Thoughts. Our data analysis on excel driven stock chart for business growth powerpoint slides Templates Make Useful Props.
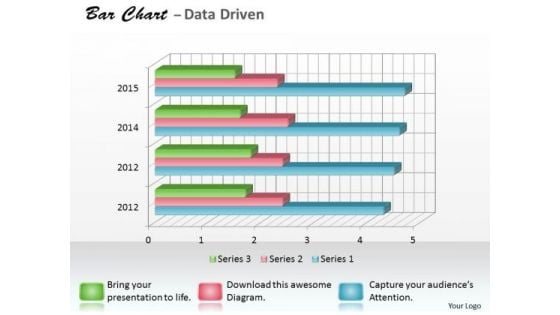
Data Analysis Programs 3d Bar Chart For Research In Statistics PowerPoint Templates
Draw It Out On Our data analysis programs 3d bar chart for research in statistics Powerpoint Templates . Provide Inspiration To Your Colleagues.
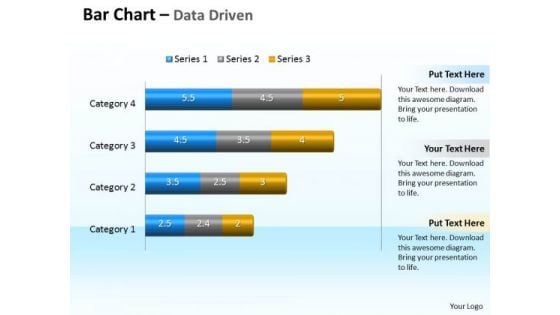
Data Analysis Programs 3d Bar Chart To Compare Categories PowerPoint Templates
Discover Decisive Moments With Our data analysis programs 3d bar chart to compare categories Powerpoint Templates . They Help Make That Crucial Difference.
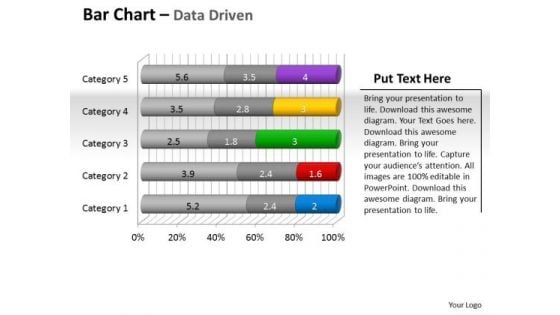
Data Analysis Programs 3d Bar Chart To Put Information PowerPoint Templates
Draw Up Your Agenda On Our data analysis programs 3d bar chart to put information Powerpoint Templates . Coax Your Audience Into Acceptance.
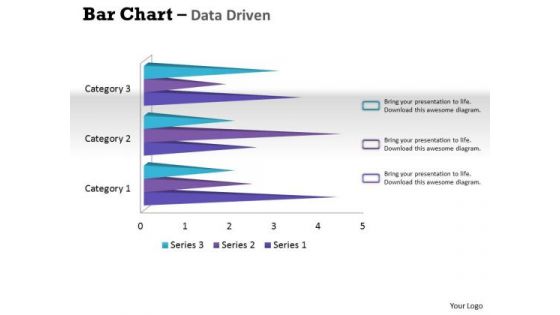
Data Analysis Techniques 3d Bar Chart For Financial Solutions PowerPoint Templates
Make Your Dreams A Reality With Our data analysis techniques 3d bar chart for financial solutions Powerpoint Templates . Your Ideas Will Begin To Take Shape.

Data Analysis Template Driven Express Business Facts Pie Chart PowerPoint Slides Templates
Display Your Drive On Our data analysis template driven express business facts pie chart powerpoint slides Templates . Invigorate The Audience With Your Fervor.
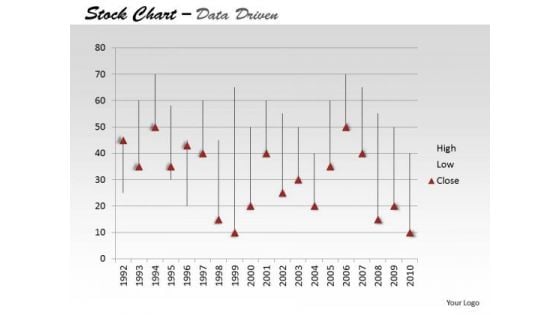
Data Analysis Template Driven Ineract With Stock Chart PowerPoint Slides Templates
Drive Your Passion With Our data analysis template driven ineract with stock chart powerpoint slides Templates . Steer Yourself To Achieve Your Aims.
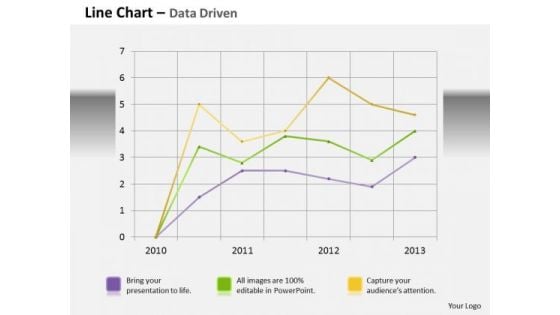
Data Analysis Template Driven Line Chart Business Graph PowerPoint Slides Templates
Bottle Your Thoughts In Our data analysis template driven line chart business graph powerpoint slides Templates . Pass It Around For Your Audience To Sip.
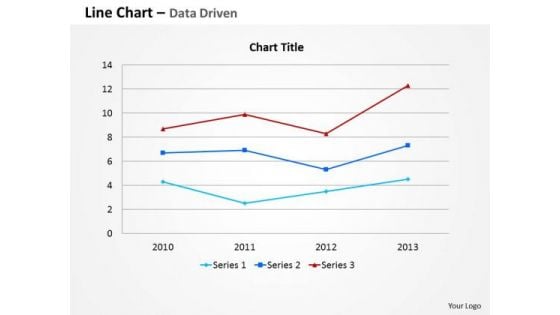
Data Analysis Template Driven Line Chart For Business Information PowerPoint Slides Templates
Your Thoughts Are Dripping With Wisdom. Lace It With Our data analysis template driven line chart for business information powerpoint slides Templates .
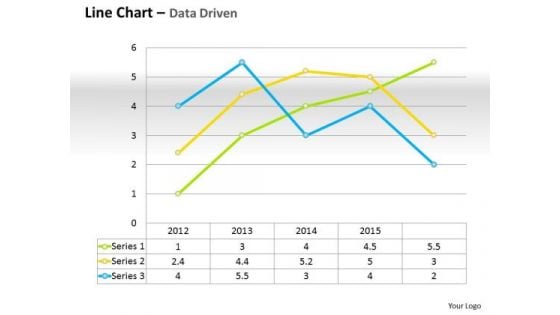
Data Analysis Template Driven Line Chart For Business Performance PowerPoint Slides Templates
Do Not Allow Things To Drift. Ring In Changes With Our data analysis template driven line chart for business performance powerpoint slides Templates .
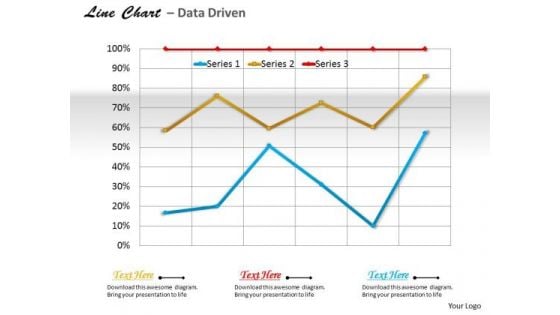
Data Analysis Template Driven Line Chart For Business Trends PowerPoint Slides Templates
Use Our data analysis template driven line chart for business trends powerpoint slides Templates As The Bit. Drill Your Thoughts Into Their Minds.
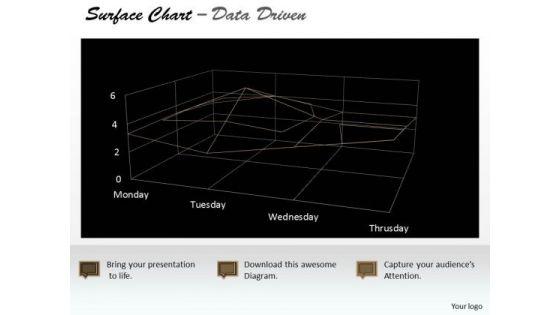
Data Analysis Template Driven Surface Chart Indicating Areas PowerPoint Slides Templates
Highlight Your Drive With Our data analysis template driven surface chart indicating areas powerpoint slides Templates . Prove The Fact That You Have Control.
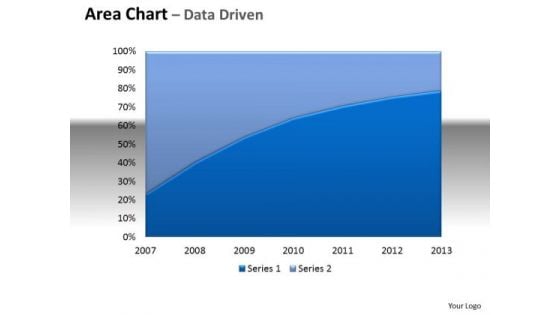
Financial Data Analysis Area Chart With Plotted Line Center PowerPoint Templates
Be The Doer With Our financial data analysis area chart with plotted line center Powerpoint Templates . Put Your Thoughts Into Practice.
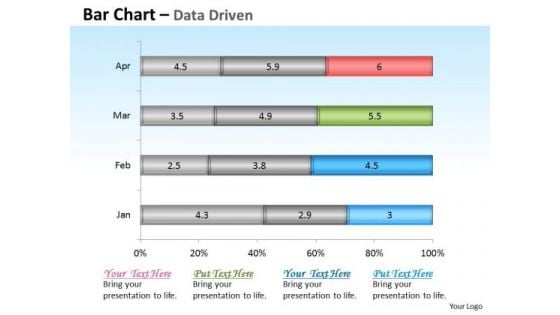
Financial Data Analysis Driven Base Bar Chart Design PowerPoint Slides Templates
Get The Domestics Right With Our financial data analysis driven base bar chart design powerpoint slides Templates . Create The Base For Thoughts To Grow.
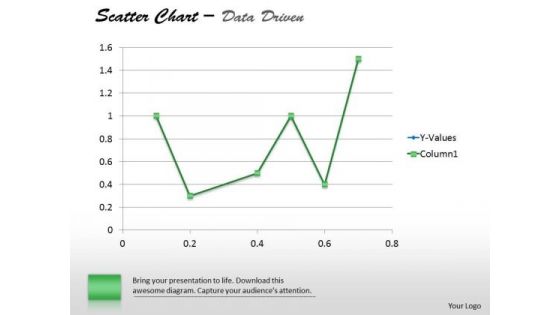
Financial Data Analysis Driven Demonstrate Statistics With Scatter Chart PowerPoint Slides Templates
Establish The Dominance Of Your Ideas. Our financial data analysis driven demonstrate statistics with scatter chart powerpoint slides Templates Will Put Them On Top.
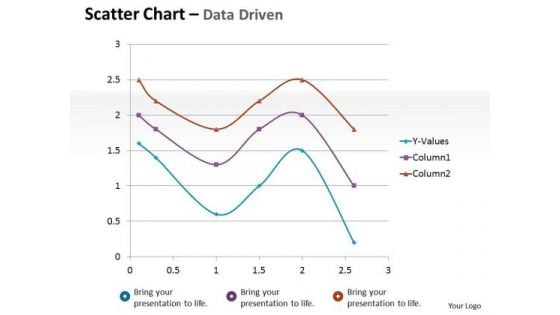
Financial Data Analysis Driven Scatter Chart Mathematical Diagram PowerPoint Slides Templates
Dominate Proceedings With Your Ideas. Our financial data analysis driven scatter chart mathematical diagram powerpoint slides Templates Will Empower Your Thoughts.
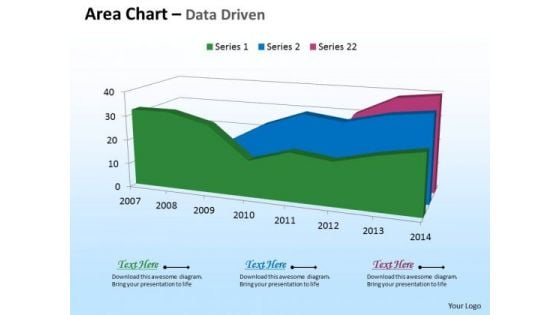
Microsoft Excel Data Analysis 3d Area Chart For Time Based PowerPoint Templates
Deliver The Right Dose With Our microsoft excel data analysis 3d area chart for time based Powerpoint Templates . Your Ideas Will Get The Correct Illumination.
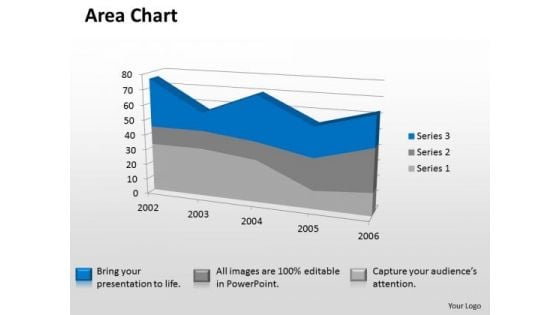
Microsoft Excel Data Analysis 3d Area Chart Showimg Change In Values PowerPoint Templates
Our microsoft excel data analysis 3d area chart showimg change in values Powerpoint Templates Deliver At Your Doorstep. Let Them In For A Wonderful Experience.
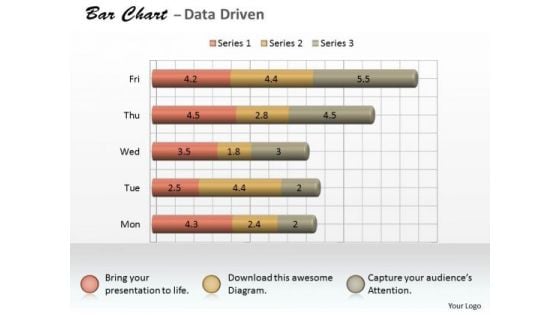
Microsoft Excel Data Analysis 3d Bar Chart As Research Tool PowerPoint Templates
Knock On The Door To Success With Our microsoft excel data analysis 3d bar chart as research tool Powerpoint Templates . Be Assured Of Gaining Entry.
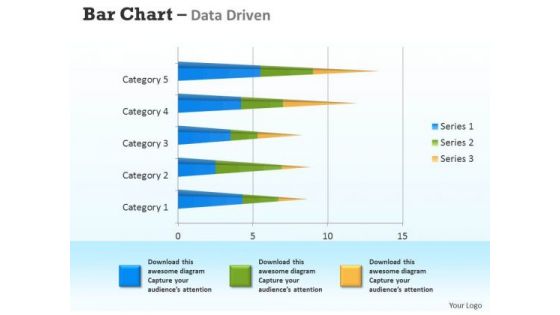
Microsoft Excel Data Analysis 3d Bar Chart For Analyzing Survey PowerPoint Templates
Connect The Dots With Our microsoft excel data analysis 3d bar chart for analyzing survey Powerpoint Templates . Watch The Whole Picture Clearly Emerge.
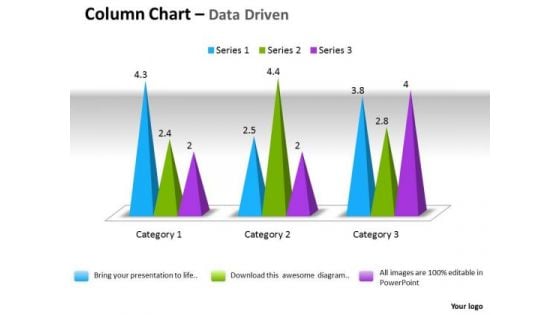
Microsoft Excel Data Analysis 3d Change In Business Process Chart PowerPoint Templates
Double Your Chances With Our microsoft excel data analysis 3d change in business process chart Powerpoint Templates . The Value Of Your Thoughts Will Increase Two-Fold.
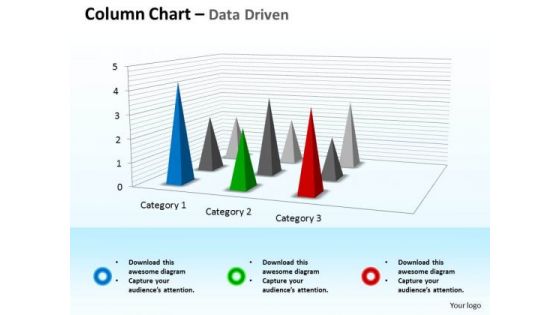
Microsoft Excel Data Analysis 3d Chart For Business Observation PowerPoint Templates
Double Up Our microsoft excel data analysis 3d chart for business observation Powerpoint Templates With Your Thoughts. They Will Make An Awesome Pair.
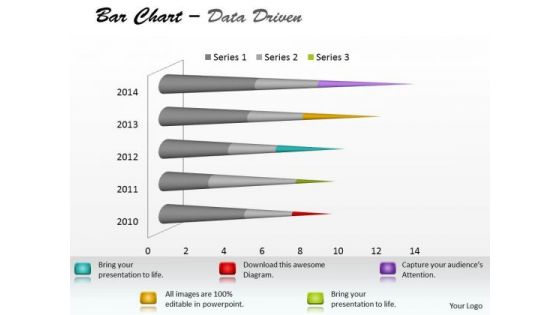
Microsoft Excel Data Analysis Bar Chart To Communicate Information PowerPoint Templates
With Our microsoft excel data analysis bar chart to communicate information Powerpoint Templates You Will Be Doubly Sure. They Possess That Stamp Of Authority.
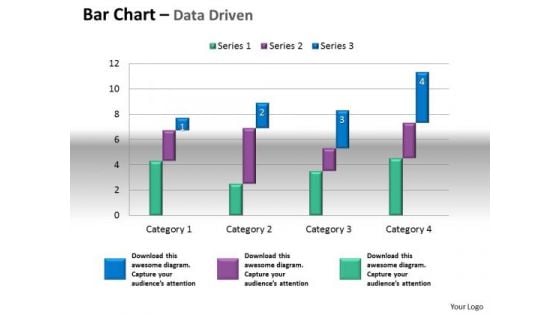
Microsoft Excel Data Analysis Bar Chart To Compare Quantities PowerPoint Templates
Our microsoft excel data analysis bar chart to compare quantities Powerpoint Templates Leave No One In Doubt. Provide A Certainty To Your Views.


 Continue with Email

 Home
Home


