Project Diagram
Per Device Pricing Strategy For Managed Solutions Sales Projection For Future With A LA Carte Icons PDF
Purpose of the following slide is to show total projected sales based on A LA Crate based pricing model Boost your pitch with our creative Per Device Pricing Strategy For Managed Solutions Sales Projection For Future With A LA Carte Icons PDF. Deliver an awe-inspiring pitch that will mesmerize everyone. Using these presentation templates you will surely catch everyones attention. You can browse the ppts collection on our website. We have researchers who are experts at creating the right content for the templates. So you do not have to invest time in any additional work. Just grab the template now and use them.

Manager Creating Plan On Various Methods Of Working On Different Projects Ppt PowerPoint Presentation Portfolio Slide PDF
Presenting manager creating plan on various methods of working on different projects ppt powerpoint presentation portfolio slide pdf to dispense important information. This template comprises one stages. It also presents valuable insights into the topics including manager creating plan on various methods of working on different projects. This is a completely customizable PowerPoint theme that can be put to use immediately. So, download it and address the topic impactfully.
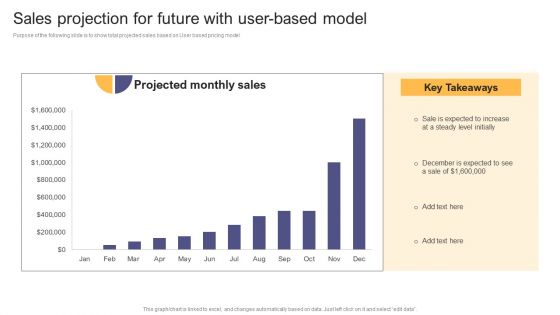
Per Device Pricing Strategy For Managed Solutions Sales Projection For Future With User Based Model Ideas PDF
Purpose of the following slide is to show total projected sales based on User based pricing model. Slidegeeks is one of the best resources for PowerPoint templates. You can download easily and regulate Per Device Pricing Strategy For Managed Solutions Sales Projection For Future With User Based Model Ideas PDF for your personal presentations from our wonderful collection. A few clicks is all it takes to discover and get the most relevant and appropriate templates. Use our Templates to add a unique zing and appeal to your presentation and meetings. All the slides are easy to edit and you can use them even for advertisement purposes.
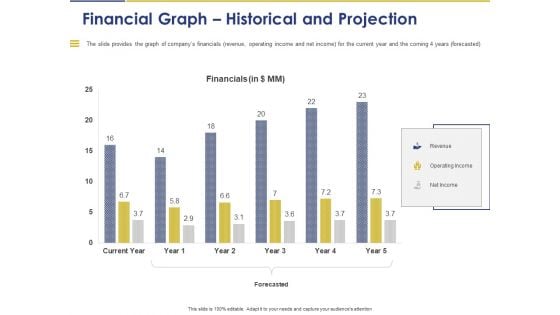
Convertible Note Pitch Deck Funding Strategy Financial Graph Historical And Projection Ppt PowerPoint Presentation Infographics Layouts PDF
Presenting this set of slides with name convertible note pitch deck funding strategy financial graph historical and projection ppt powerpoint presentation infographics layouts pdf. The topics discussed in these slides are financials, revenue, operating income, net income, forecasted. This is a completely editable PowerPoint presentation and is available for immediate download. Download now and impress your audience.
Agile Playbook For Program Designers UI UX Design Process For New And Existing Projects Ppt Icon Master Slide PDF
This template covers the UI or UX design process flow for new and ongoing projects. It includes clients requirements, product meetings, prototype creation with features, and mood board. Explore a selection of the finest Agile Playbook For Program Designers UI UX Design Process For New And Existing Projects Ppt Icon Master Slide PDF here. With a plethora of professionally designed and pre-made slide templates, you can quickly and easily find the right one for your upcoming presentation. You can use our Agile Playbook For Program Designers UI UX Design Process For New And Existing Projects Ppt Icon Master Slide PDF to effectively convey your message to a wider audience. Slidegeeks has done a lot of research before preparing these presentation templates. The content can be personalized and the slides are highly editable. Grab templates today from Slidegeeks.
Five Steps In Linear Flow With Icons Sales Strategies And Financial Projections Ppt Powerpoint Presentation Ideas Information
This is a five steps in linear flow with icons sales strategies and financial projections ppt powerpoint presentation ideas information. This is a five stage process. The stages in this process are 7 point infographic, 7 steps infographic, 7 stages infographic.
Four Steps In Linear Flow With Icons Sales Strategies And Financial Projections Ppt Powerpoint Presentation Portfolio Deck
This is a four steps in linear flow with icons sales strategies and financial projections ppt powerpoint presentation portfolio deck. This is a four stage process. The stages in this process are 7 point infographic, 7 steps infographic, 7 stages infographic.
Nine Steps In Linear Flow With Icons Sales Strategies And Financial Projections Ppt Powerpoint Presentation Ideas Images
This is a nine steps in linear flow with icons sales strategies and financial projections ppt powerpoint presentation ideas images. This is a nine stage process. The stages in this process are 7 point infographic, 7 steps infographic, 7 stages infographic.
Seven Steps In Linear Flow With Icons Sales Strategies And Financial Projections Ppt Powerpoint Presentation Styles Graphics Example
This is a seven steps in linear flow with icons sales strategies and financial projections ppt powerpoint presentation styles graphics example. This is a seven stage process. The stages in this process are 7 point infographic, 7 steps infographic, 7 stages infographic.
Six Steps In Linear Flow With Icons Sales Strategies And Finacial Projections Ppt Powerpoint Presentation Inspiration Guide
This is a six steps in linear flow with icons sales strategies and finacial projections ppt powerpoint presentation inspiration guide. This is a six stage process. The stages in this process are 7 point infographic, 7 steps infographic, 7 stages infographic.
three steps in linear flow with icons sales strategies and finacial projections ppt powerpoint presentation layouts visual aids
This is a three steps in linear flow with icons sales strategies and finacial projections ppt powerpoint presentation layouts visual aids. This is a three stage process. The stages in this process are 7 point infographic, 7 steps infographic, 7 stages infographic.
Key Features For Effective Business Management Cost Determining Factors Of Infrastructure Projects Ppt Icon Graphics Example PDF
Presenting this set of slides with name key features for effective business management cost determining factors of infrastructure projects ppt icon graphics example pdf. The topics discussed in these slides are planning design fees, land purchase, site preparation, building and construction, plant and machinery . This is a completely editable PowerPoint presentation and is available for immediate download. Download now and impress your audience.
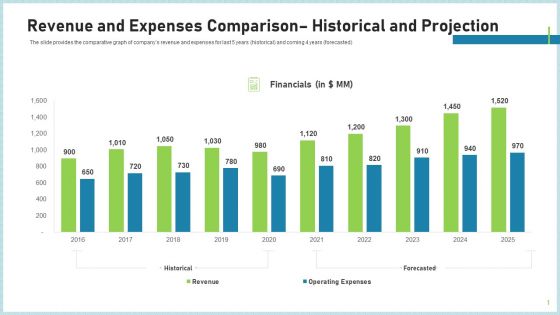
Pitch Deck To Attract Funding After IPO Market Revenue And Expenses Comparison Historical And Projection Topics PDF
the slide provides the comparative graph of companys revenue and expenses for last 5 years historical and coming 4 years forecasted Deliver and pitch your topic in the best possible manner with this pitch deck to attract funding after ipo market revenue and expenses comparison historical and projection topics pdf. Use them to share invaluable insights on historical, forecasted, financials and impress your audience. This template can be altered and modified as per your expectations. So, grab it now.
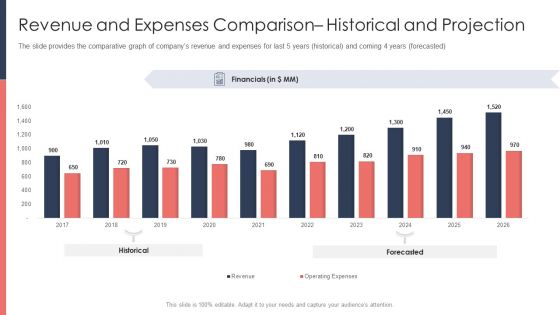
Pitch Deck For Fundraising From Post Market Financing Revenue And Expenses Comparison Historical And Projection Designs PDF
The slide provides the comparative graph of companys revenue and expenses for last 5 years historical and coming 4 years forecastedDeliver and pitch your topic in the best possible manner with this pitch deck for fundraising from post market financing revenue and expenses comparison historical and projection designs pdf. Use them to share invaluable insights on historical, forecasted, financials and impress your audience. This template can be altered and modified as per your expectations. So, grab it now.
Pitch Deck To Raise Funding From Secondary Market Revenue And Expenses Comparison Historical And Projection Summary PDF
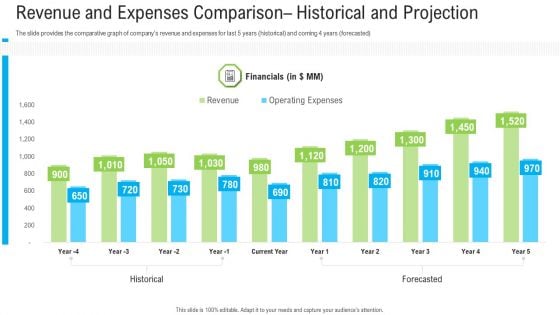
The slide provides the comparative graph of companys revenue and expenses for last 5 years historical and coming 4 years forecasted. Deliver and pitch your topic in the best possible manner with this pitch deck to raise funding from secondary market revenue and expenses comparison historical and projection summary pdf. Use them to share invaluable insights on financials, revenue, operating expenses and impress your audience. This template can be altered and modified as per your expectations. So, grab it now.
Agenda For Adverting New Sarvice Via Social Network Platform Diagrams Pdf
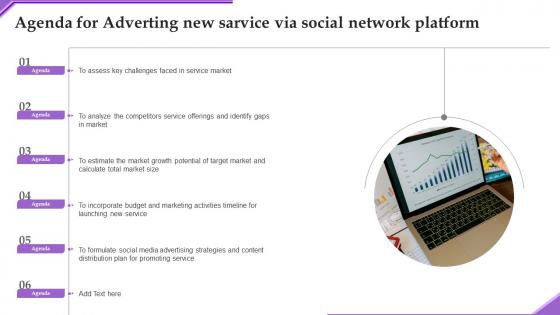
Take your projects to the next level with our ultimate collection of Agenda For Adverting New Sarvice Via Social Network Platform Diagrams Pdf. Slidegeeks has designed a range of layouts that are perfect for representing task or activity duration, keeping track of all your deadlines at a glance. Tailor these designs to your exact needs and give them a truly corporate look with your own brand colors they will make your projects stand out from the rest Our Agenda For Adverting New Sarvice Via Social Network Platform Diagrams Pdf are topically designed to provide an attractive backdrop to any subject. Use them to look like a presentation pro.
Instant Messenger For Internal Business Operations Table Of Contents Diagrams Pdf
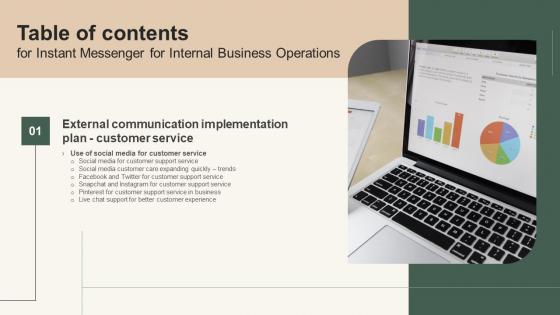
Take your projects to the next level with our ultimate collection of Instant Messenger For Internal Business Operations Table Of Contents Diagrams Pdf. Slidegeeks has designed a range of layouts that are perfect for representing task or activity duration, keeping track of all your deadlines at a glance. Tailor these designs to your exact needs and give them a truly corporate look with your own brand colors they will make your projects stand out from the rest Our Instant Messenger For Internal Business Operations Table Of Contents Diagrams Pdf are topically designed to provide an attractive backdrop to any subject. Use them to look like a presentation pro.
Pitch Deck To Collect Funding From Initial Financing Income Statement Projection For Next Five Years Themes PDF
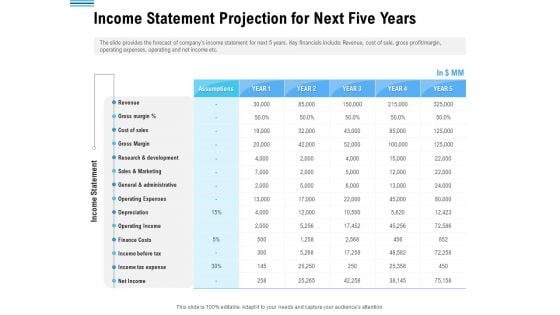
The slide provides the forecast of companys income statement for next 5 years. Key financials include Revenue, cost of sale, gross profit or margin, operating expenses, operating and net income etc. Deliver an awe inspiring pitch with this creative pitch deck to collect funding from initial financing income statement projection for next five years themes pdf bundle. Topics like revenue, cost, sales, marketing, finance can be discussed with this completely editable template. It is available for immediate download depending on the needs and requirements of the user.
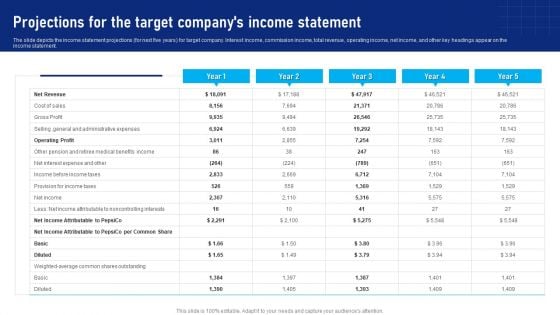
Buy Side Advisory Services In M And A Projections For The Target Companys Income Statement Pictures PDF
This slide highlights the firms goals and plans following the acquisition of the target company. Rebranding, managerial changes, and financial consolidation are among the major goals.Whether you have daily or monthly meetings, a brilliant presentation is necessary. Buy Side Advisory Services In M And A Projections For The Target Companys Income Statement Pictures PDF can be your best option for delivering a presentation. Represent everything in detail using Buy Side Advisory Services In M And A Projections For The Target Companys Income Statement Pictures PDF and make yourself stand out in meetings. The template is versatile and follows a structure that will cater to your requirements. All the templates prepared by Slidegeeks are easy to download and edit. Our research experts have taken care of the corporate themes as well. So, give it a try and see the results.
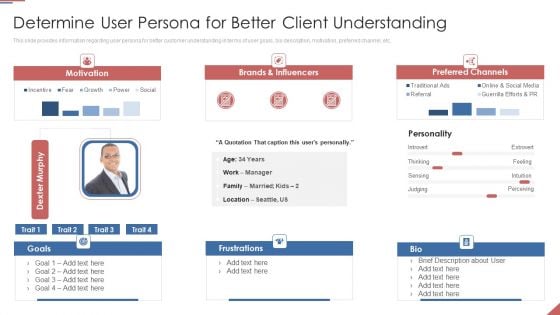
Formulating Plan And Executing Bid Projects Using Agile IT Determine User Persona For Better Client Understanding Elements PDF
This slide provides information regarding user persona for better customer understanding in terms of user goals, bio description, motivation, preferred channel, etc. Deliver and pitch your topic in the best possible manner with this formulating plan and executing bid projects using agile it determine user persona for better client understanding elements pdf. Use them to share invaluable insights on determine user persona for better client understanding and impress your audience. This template can be altered and modified as per your expectations. So, grab it now.
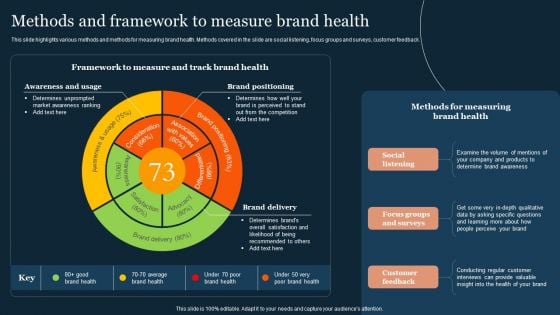
Guide To Develop And Estimate Brand Value Methods And Framework To Measure Brand Health Diagrams PDF
This slide highlights various methods and methods for measuring brand health. Methods covered in the slide are social listening, focus groups and surveys, customer feedback.Take your projects to the next level with our ultimate collection of Guide To Develop And Estimate Brand Value Methods And Framework To Measure Brand Health Diagrams PDF. Slidegeeks has designed a range of layouts that are perfect for representing task or activity duration, keeping track of all your deadlines at a glance. Tailor these designs to your exact needs and give them a truly corporate look with your own brand colors they all make your projects stand out from the rest.
Service Delivery Partner Go To Market Strategy Framework Ppt PowerPoint Presentation Icon Diagrams PDF
This Slide represents channel partner go-to-market strategy framework such as current state market analysis, alignment of products and services, market potential and projections etc. Presenting service delivery partner go to market strategy framework ppt powerpoint presentation icon diagrams pdf to dispense important information. This template comprises five stages. It also presents valuable insights into the topics including account planning, recommendations and roadmap, market potential and projections. This is a completely customizable PowerPoint theme that can be put to use immediately. So, download it and address the topic impactfully.
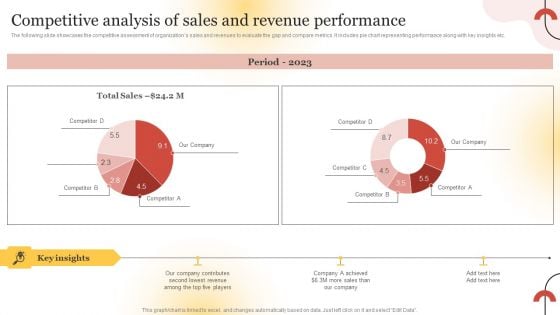
Executing Sales Risk Reduction Plan Competitive Analysis Of Sales And Revenue Performance Diagrams PDF
The following slide showcases the competitive assessment of organizations sales and revenues to evaluate the gap and compare metrics. It includes pie chart representing performance along with key insights etc. Take your projects to the next level with our ultimate collection of Executing Sales Risk Reduction Plan Competitive Analysis Of Sales And Revenue Performance Diagrams PDF. Slidegeeks has designed a range of layouts that are perfect for representing task or activity duration, keeping track of all your deadlines at a glance. Tailor these designs to your exact needs and give them a truly corporate look with your own brand colors they will make your projects stand out from the rest.
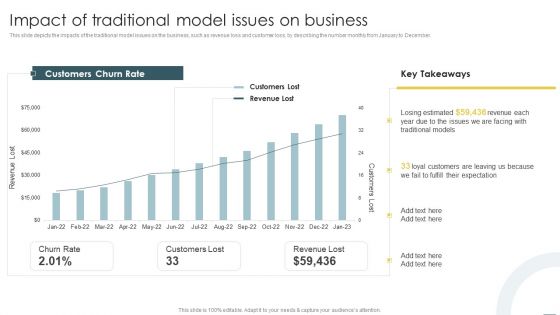
Crystal Methods In Agile Framework Impact Of Traditional Model Issues On Business Diagrams PDF
This slide depicts the impacts of the traditional model issues on the business, such as revenue loss and customer loss, by describing the number monthly from January to December. Take your projects to the next level with our ultimate collection of Crystal Methods In Agile Framework Impact Of Traditional Model Issues On Business Diagrams PDF. Slidegeeks has designed a range of layouts that are perfect for representing task or activity duration, keeping track of all your deadlines at a glance. Tailor these designs to your exact needs and give them a truly corporate look with your own brand colors they will make your projects stand out from the rest.
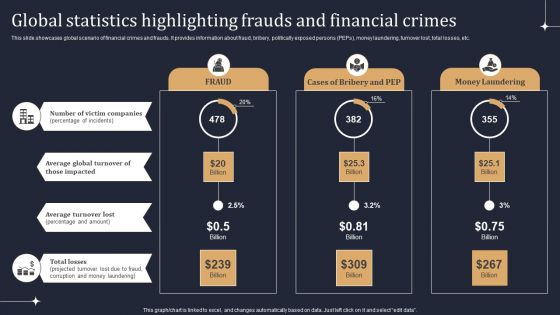
KYC Transaction Monitoring System Business Security Global Statistics Highlighting Frauds Diagrams PDF
This slide showcases global scenario of financial crimes and frauds. It provides information about fraud, bribery, politically exposed persons PEPs, money laundering, turnover lost, total losses, etc. Take your projects to the next level with our ultimate collection of KYC Transaction Monitoring System Business Security Global Statistics Highlighting Frauds Diagrams PDF. Slidegeeks has designed a range of layouts that are perfect for representing task or activity duration, keeping track of all your deadlines at a glance. Tailor these designs to your exact needs and give them a truly corporate look with your own brand colors they will make your projects stand out from the rest.
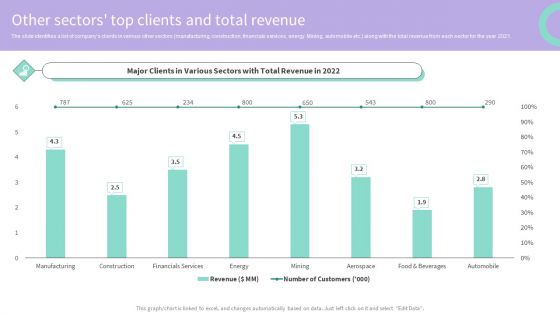
Buy Side Merger And Acquisition Advisory Other Sectors Top Clients And Total Revenue Diagrams PDF
The slide identifies a list of companys clients in various other sectors manufacturing, construction, financials services, energy. Mining, automobile etc. along with the total revenue from each sector for the year 2021. Take your projects to the next level with our ultimate collection of Buy Side Merger And Acquisition Advisory Other Sectors Top Clients And Total Revenue Diagrams PDF. Slidegeeks has designed a range of layouts that are perfect for representing task or activity duration, keeping track of all your deadlines at a glance. Tailor these designs to your exact needs and give them a truly corporate look with your own brand colors they will make your projects stand out from the rest.
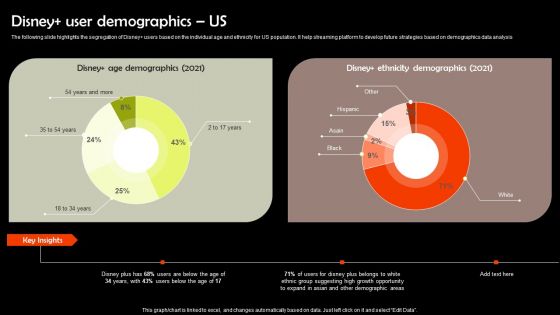
Digital Media Streaming Platform Company Profile Disney User Demographics US Diagrams PDF
The following slide highlights the segregation of Disney users based on the individual age and ethnicity for US population. It help streaming platform to develop future strategies based on demographics data analysis Take your projects to the next level with our ultimate collection of Digital Media Streaming Platform Company Profile Disney User Demographics US Diagrams PDF. Slidegeeks has designed a range of layouts that are perfect for representing task or activity duration, keeping track of all your deadlines at a glance. Tailor these designs to your exact needs and give them a truly corporate look with your own brand colors they will make your projects stand out from the rest.
Providing Efficient Client Services Kpi Dashboard For Tracking Customer Retention Diagrams PDF
This slide covers the dashboard for analyzing customer loyalty with metrics such as NPS, loyal customer rate, premium users, CLV, customer churn, revenue churn, net retention, MRR growth, etc. Take your projects to the next level with our ultimate collection of Providing Efficient Client Services Kpi Dashboard For Tracking Customer Retention Diagrams PDF. Slidegeeks has designed a range of layouts that are perfect for representing task or activity duration, keeping track of all your deadlines at a glance. Tailor these designs to your exact needs and give them a truly corporate look with your own brand colors they will make your projects stand out from the rest.
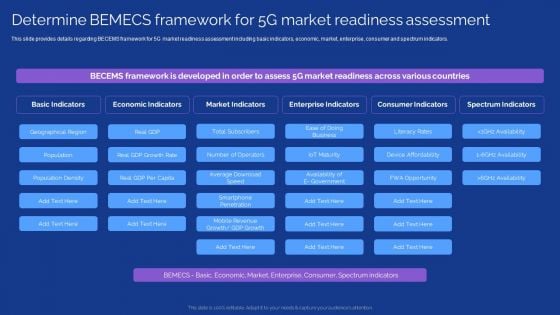
Development Guide For 5G World Determine Bemecs Framework For 5G Market Readiness Assessment Diagrams PDF
This slide provides details regarding BECEMS framework for 5G market readiness assessment including basic indicators, economic, market, enterprise, consumer and spectrum indicators. Take your projects to the next level with our ultimate collection of Development Guide For 5G World Determine Bemecs Framework For 5G Market Readiness Assessment Diagrams PDF. Slidegeeks has designed a range of layouts that are perfect for representing task or activity duration, keeping track of all your deadlines at a glance. Tailor these designs to your exact needs and give them a truly corporate look with your own brand colors they will make your projects stand out from the rest.
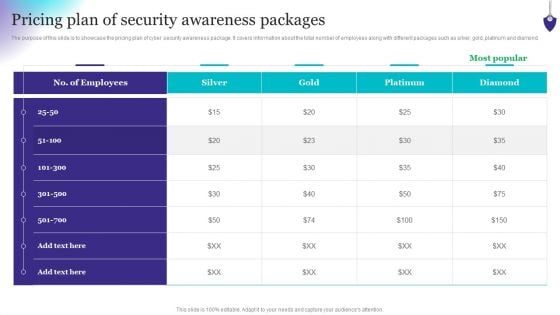
Organizing Security Awareness Pricing Plan Of Security Awareness Packages Diagrams PDF
The purpose of this slide is to showcase the pricing plan of cyber security awareness package. It covers information about the total number of employees along with different packages such as silver, gold, platinum and diamond. Take your projects to the next level with our ultimate collection of Organizing Security Awareness Pricing Plan Of Security Awareness Packages Diagrams PDF. Slidegeeks has designed a range of layouts that are perfect for representing task or activity duration, keeping track of all your deadlines at a glance. Tailor these designs to your exact needs and give them a truly corporate look with your own brand colors theyll make your projects stand out from the rest.
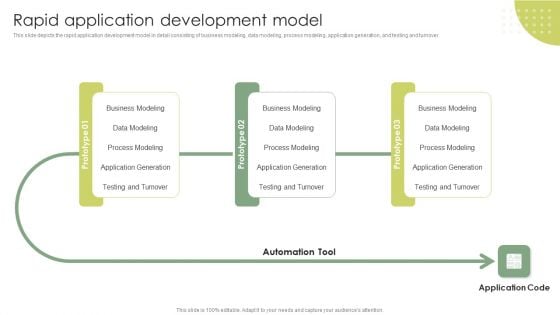
Rapid Application Development Model Rapid Application Building RAB Model Diagrams PDF
This slide depicts the rapid application development model in detail consisting of business modeling, data modeling, process modeling, application generation, and testing and turnover.Take your projects to the next level with our ultimate collection of Rapid Application Development Model Rapid Application Building RAB Model Diagrams PDF. Slidegeeks has designed a range of layouts that are perfect for representing task or activity duration, keeping track of all your deadlines at a glance. Tailor these designs to your exact needs and give them a truly corporate look with your own brand colors they all make your projects stand out from the rest.

Focusing On The Business Needs Principle To Be Implemented Dynamic System Development Model Diagrams PDF
This slide explains that focusing on business needs as a principle of DSDM to be implemented makes the workflow uncomplicated.Take your projects to the next level with our ultimate collection of Focusing On The Business Needs Principle To Be Implemented Dynamic System Development Model Diagrams PDF. Slidegeeks has designed a range of layouts that are perfect for representing task or activity duration, keeping track of all your deadlines at a glance. Tailor these designs to your exact needs and give them a truly corporate look with your own brand colors they all make your projects stand out from the rest.
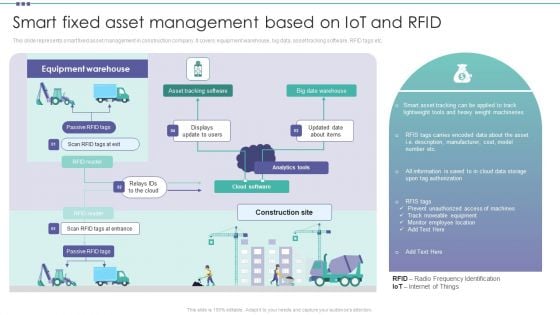
Smart Fixed Asset Management Based On Iot And Rfid Organization Physical Assets Diagrams PDF
This slide represents smart fixed asset management in construction company. It covers equipment warehouse, big data, asset tracking software, RFID tags etc.Take your projects to the next level with our ultimate collection of Smart Fixed Asset Management Based On Iot And Rfid Organization Physical Assets Diagrams PDF. Slidegeeks has designed a range of layouts that are perfect for representing task or activity duration, keeping track of all your deadlines at a glance. Tailor these designs to your exact needs and give them a truly corporate look with your own brand colors they all make your projects stand out from the rest.
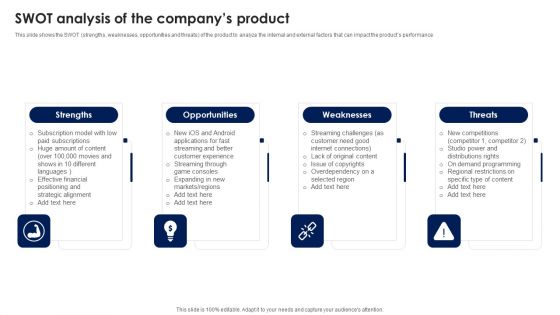
SWOT Analysis Of The Companys Product Ppt PowerPoint Presentation File Diagrams PDF
This slide shows the SWOT strengths, weaknesses, opportunities and threats of the product to analyze the internal and external factors that can impact the products performance Take your projects to the next level with our ultimate collection of SWOT Analysis Of The Companys Product Ppt PowerPoint Presentation File Diagrams PDF. Slidegeeks has designed a range of layouts that are perfect for representing task or activity duration, keeping track of all your deadlines at a glance. Tailor these designs to your exact needs and give them a truly corporate look with your own brand colors they will make your projects stand out from the rest.
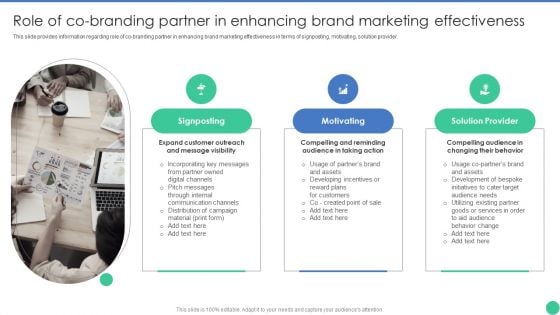
Brand Management To Enhance Role Of Co Branding Partner In Enhancing Brand Marketing Diagrams PDF
This slide provides information regarding role of co-branding partner in enhancing brand marketing effectiveness in terms of signposting, motivating, solution provider. Take your projects to the next level with our ultimate collection of Brand Management To Enhance Role Of Co Branding Partner In Enhancing Brand Marketing Diagrams PDF. Slidegeeks has designed a range of layouts that are perfect for representing task or activity duration, keeping track of all your deadlines at a glance. Tailor these designs to your exact needs and give them a truly corporate look with your own brand colors theyll make your projects stand out from the rest.
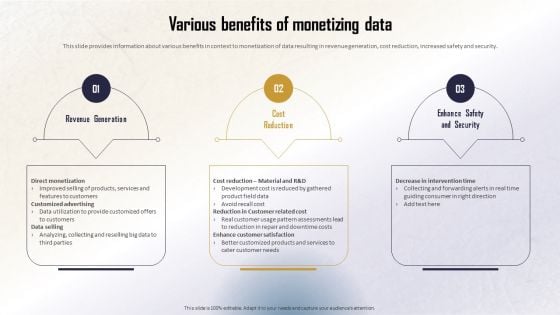
Identifying Direct And Indirect Various Benefits Of Monetizing Data Diagrams PDF
This slide provides information about various benefits in context to monetization of data resulting in revenue generation, cost reduction, increased safety and security. Take your projects to the next level with our ultimate collection of Identifying Direct And Indirect Various Benefits Of Monetizing Data Diagrams PDF. Slidegeeks has designed a range of layouts that are perfect for representing task or activity duration, keeping track of all your deadlines at a glance. Tailor these designs to your exact needs and give them a truly corporate look with your own brand colors theyll make your projects stand out from the rest
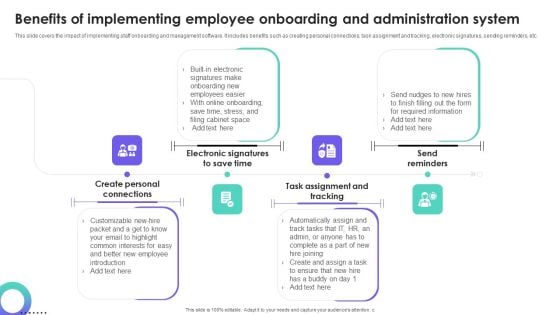
HRMS Execution Plan Benefits Of Implementing Employee Onboarding And Administration System Diagrams PDF
This slide covers the impact of implementing staff onboarding and management software. It includes benefits such as creating personal connections, task assignment and tracking, electronic signatures, sending reminders, etc. Take your projects to the next level with our ultimate collection of HRMS Execution Plan Benefits Of Implementing Employee Onboarding And Administration System Diagrams PDF. Slidegeeks has designed a range of layouts that are perfect for representing task or activity duration, keeping track of all your deadlines at a glance. Tailor these designs to your exact needs and give them a truly corporate look with your own brand colors they will make your projects stand out from the rest.
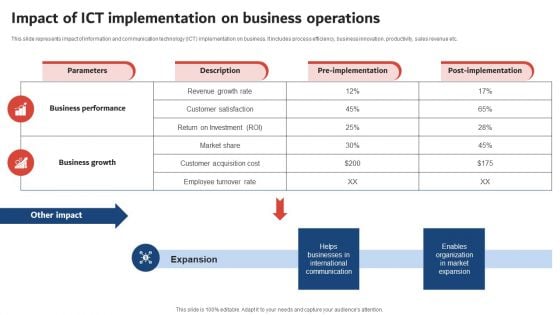
Execution Of ICT Strategic Plan Impact Of ICT Implementation On Business Operations Diagrams PDF
This slide represents impact of information and communication technology ICT implementation on business. It includes process efficiency, business innovation, productivity, sales revenue etc. Take your projects to the next level with our ultimate collection of Execution Of ICT Strategic Plan Impact Of ICT Implementation On Business Operations Diagrams PDF. Slidegeeks has designed a range of layouts that are perfect for representing task or activity duration, keeping track of all your deadlines at a glance. Tailor these designs to your exact needs and give them a truly corporate look with your own brand colors they will make your projects stand out from the rest.
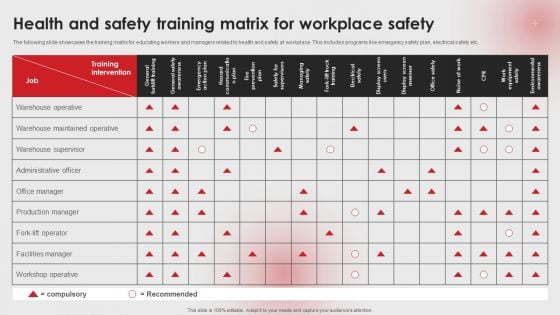
Health And Safety Training Matrix For Workplace Safety Ppt PowerPoint Presentation File Diagrams PDF
The following slide showcases the training matrix for educating workers and managers related to health and safety at workplace. This includes programs like emergency safety plan, electrical safety etc. Take your projects to the next level with our ultimate collection of Health And Safety Training Matrix For Workplace Safety Ppt PowerPoint Presentation File Diagrams PDF. Slidegeeks has designed a range of layouts that are perfect for representing task or activity duration, keeping track of all your deadlines at a glance. Tailor these designs to your exact needs and give them a truly corporate look with your own brand colors they will make your projects stand out from the rest.
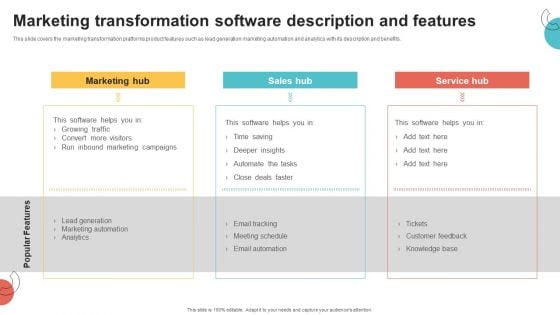
Digital Marketing Toolkit Marketing Transformation Software Description And Features Diagrams PDF
This slide covers the marketing transformation platforms product features such as lead generation marketing automation and analytics with its description and benefits. Take your projects to the next level with our ultimate collection of Digital Marketing Toolkit Marketing Transformation Software Description And Features Diagrams PDF. Slidegeeks has designed a range of layouts that are perfect for representing task or activity duration, keeping track of all your deadlines at a glance. Tailor these designs to your exact needs and give them a truly corporate look with your own brand colors they will make your projects stand out from the rest
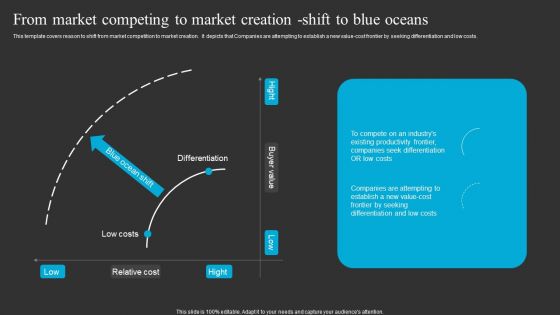
From Market Competing To Market Creation Shift To Blue Oceans Ppt Portfolio Diagrams PDF
This template covers reason to shift from market competition to market creation. It depicts that Companies are attempting to establish a new value-cost frontier by seeking differentiation and low costs.Take your projects to the next level with our ultimate collection of From Market Competing To Market Creation Shift To Blue Oceans Ppt Portfolio Diagrams PDF. Slidegeeks has designed a range of layouts that are perfect for representing task or activity duration, keeping track of all your deadlines at a glance. Tailor these designs to your exact needs and give them a truly corporate look with your own brand colors they will make your projects stand out from the rest.
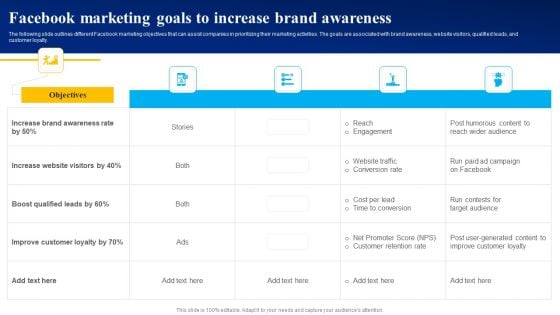
Facebook Marketing Goals To Increase Brand Awareness Ppt PowerPoint Presentation File Diagrams PDF
The following slide outlines different Facebook marketing objectives that can assist companies in prioritizing their marketing activities. The goals are associated with brand awareness, website visitors, qualified leads, and customer loyalty. Take your projects to the next level with our ultimate collection of Facebook Marketing Goals To Increase Brand Awareness Ppt PowerPoint Presentation File Diagrams PDF. Slidegeeks has designed a range of layouts that are perfect for representing task or activity duration, keeping track of all your deadlines at a glance. Tailor these designs to your exact needs and give them a truly corporate look with your own brand colors they will make your projects stand out from the rest.
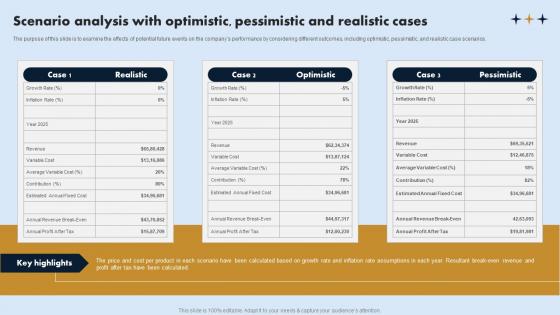
Scenario Analysis With Optimistic Pessimistic On Demand Laundry Business Plan Diagrams Pdf
Take your projects to the next level with our ultimate collection of Scenario Analysis With Optimistic Pessimistic On Demand Laundry Business Plan Diagrams Pdf Slidegeeks has designed a range of layouts that are perfect for representing task or activity duration, keeping track of all your deadlines at a glance. Tailor these designs to your exact needs and give them a truly corporate look with your own brand colors they all make your projects stand out from the rest. The purpose of this slide is to examine the effects of potential future events on the companys performance by considering different outcomes, including optimistic, pessimistic, and realistic case scenarios.

Startup Pitch Deck For Fast Food Restaurant Annual Sales Forecast For Food Startup Diagrams PDF
The purpose of this slide is to provide glimpse about the annual sales projections of the firm. Deliver an awe inspiring pitch with this creative startup pitch deck for fast food restaurant annual sales forecast for food startup diagrams pdf bundle. Topics like revenues, sales, prime cost can be discussed with this completely editable template. It is available for immediate download depending on the needs and requirements of the user.
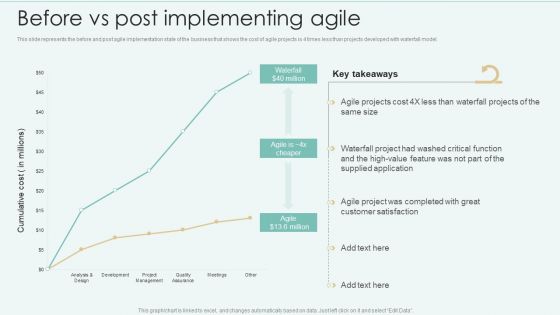
Strategies Of Agile Development To Enhance Processes Before Vs Post Implementing Agile Diagrams PDF
This slide represents the before and post agile implementation state of the business that shows the cost of agile projects is 4 times less than projects developed with waterfall model. Create an editable Strategies Of Agile Development To Enhance Processes Before Vs Post Implementing Agile Diagrams PDF that communicates your idea and engages your audience. Whether you are presenting a business or an educational presentation, pre designed presentation templates help save time. Strategies Of Agile Development To Enhance Processes Before Vs Post Implementing Agile Diagrams PDF is highly customizable and very easy to edit, covering many different styles from creative to business presentations. Slidegeeks has creative team members who have crafted amazing templates. So, go and get them without any delay.
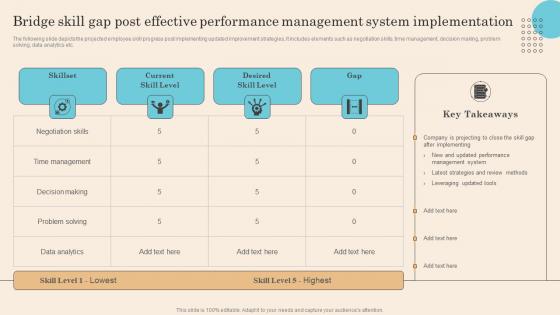
Bridge Skill Gap Post Effective Performance Management System Implementation Diagrams Pdf
The following slide depicts the projected employee skill progress post implementing updated improvement strategies, It includes elements such as negotiation skills, time management, decision making, problem solving, data analytics etc. Do you have to make sure that everyone on your team knows about any specific topic I yes, then you should give Bridge Skill Gap Post Effective Performance Management System Implementation Diagrams Pdf a try. Our experts have put a lot of knowledge and effort into creating this impeccable Bridge Skill Gap Post Effective Performance Management System Implementation Diagrams Pdf. You can use this template for your upcoming presentations, as the slides are perfect to represent even the tiniest detail. You can download these templates from the Slidegeeks website and these are easy to edit. So grab these today. The following slide depicts the projected employee skill progress post implementing updated improvement strategies, It includes elements such as negotiation skills, time management, decision making, problem solving, data analytics etc.
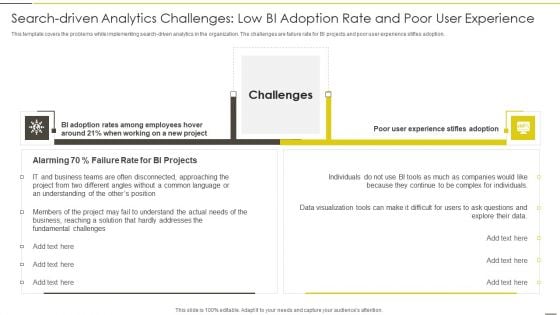
Administered Data And Analytic Quality Playbook Search Driven Analytics Challenges Low Diagrams PDF
This template covers the problems while implementing search-driven analytics in the organization. The challenges are failure rate for BI projects and poor user experience stifles adoption.Deliver an awe inspiring pitch with this creative Administered Data And Analytic Quality Playbook Search Driven Analytics Challenges Low Diagrams PDF bundle. Topics like Business Teams, Hardly Addresses, Fundamental Challenges can be discussed with this completely editable template. It is available for immediate download depending on the needs and requirements of the user.
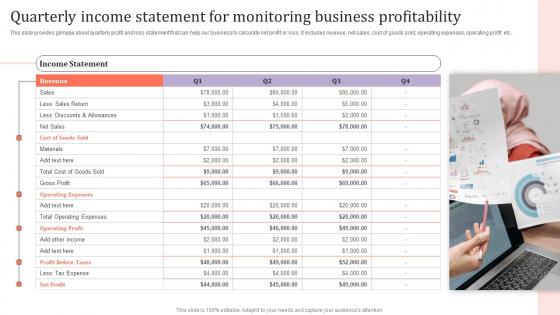
Quarterly Income Statement For Monitoring Assessing Corporate Financial Techniques Diagrams Pdf
This slide provides glimpse about quarterly profit and loss statement that can help our business to calculate net profit or loss. It includes revenue, net sales, cost of goods sold, operating expenses, operating profit, etc. Take your projects to the next level with our ultimate collection of Quarterly Income Statement For Monitoring Assessing Corporate Financial Techniques Diagrams Pdf. Slidegeeks has designed a range of layouts that are perfect for representing task or activity duration, keeping track of all your deadlines at a glance. Tailor these designs to your exact needs and give them a truly corporate look with your own brand colors they will make your projects stand out from the rest This slide provides glimpse about quarterly profit and loss statement that can help our business to calculate net profit or loss. It includes revenue, net sales, cost of goods sold, operating expenses, operating profit, etc.
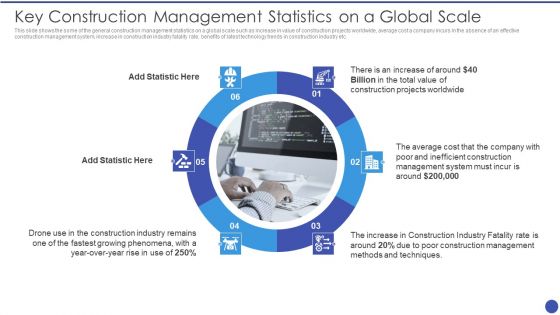
Management Techniques Key Construction Management Statistics On A Global Scale Diagrams PDF
This slide shows the some of the general construction management statistics on a global scale such as increase in value of construction projects worldwide, average cost a company incurs in the absence of an effective construction management system, increase in construction industry fatality rate, benefits of latest technology trends in construction industry etc. Presenting Management Techniques Key Construction Management Statistics On A Global Scale Diagrams PDF to provide visual cues and insights. Share and navigate important information on six stages that need your due attention. This template can be used to pitch topics like Total Value, Projects Worldwide, Poor Construction Management, Methods And Techniques. In addtion, this PPT design contains high resolution images, graphics, etc, that are easily editable and available for immediate download.
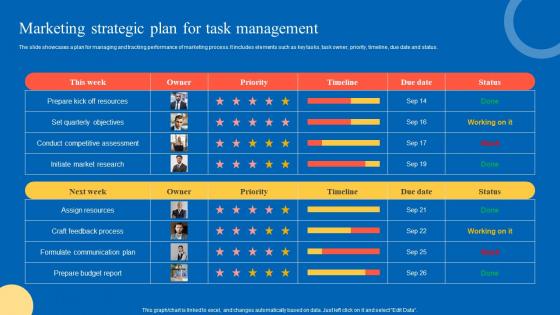
Marketing Strategic Plan For Strategic Guide For Marketing Program Diagrams Pdf
The slide showcases a plan for managing and tracking performance of marketing process. It includes elements such as key tasks, task owner, priority, timeline, due date and status. Take your projects to the next level with our ultimate collection of Marketing Strategic Plan For Strategic Guide For Marketing Program Diagrams Pdf. Slidegeeks has designed a range of layouts that are perfect for representing task or activity duration, keeping track of all your deadlines at a glance. Tailor these designs to your exact needs and give them a truly corporate look with your own brand colors they well make your projects stand out from the rest. The slide showcases a plan for managing and tracking performance of marketing process. It includes elements such as key tasks, task owner, priority, timeline, due date and status.
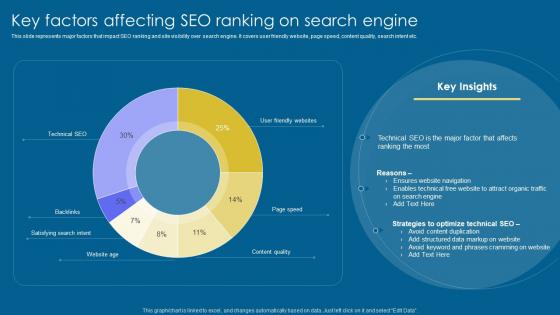
Key Factors Affecting SEO Implementation Of Digital Advertising Strategies Diagrams Pdf
This slide represents major factors that impact SEO ranking and site visibility over search engine. It covers user friendly website, page speed, content quality, search intent etc. Take your projects to the next level with our ultimate collection of Key Factors Affecting SEO Implementation Of Digital Advertising Strategies Diagrams Pdf. Slidegeeks has designed a range of layouts that are perfect for representing task or activity duration, keeping track of all your deadlines at a glance. Tailor these designs to your exact needs and give them a truly corporate look with your own brand colors they will make your projects stand out from the rest This slide represents major factors that impact SEO ranking and site visibility over search engine. It covers user friendly website, page speed, content quality, search intent etc.
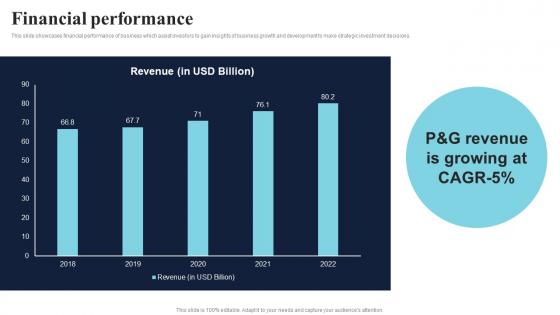
Financial Performance Healthcare Product Company Fund Raising Pitch Deck Diagrams Pdf
This slide showcases financial performance of business which assist investors to gain insights of business growth and development to make strategic investment decisions. Take your projects to the next level with our ultimate collection of Financial Performance Healthcare Product Company Fund Raising Pitch Deck Diagrams Pdf. Slidegeeks has designed a range of layouts that are perfect for representing task or activity duration, keeping track of all your deadlines at a glance. Tailor these designs to your exact needs and give them a truly corporate look with your own brand colors they will make your projects stand out from the rest This slide showcases financial performance of business which assist investors to gain insights of business growth and development to make strategic investment decisions.

Introduction To Mobile SEM KPI Metrics Dashboard To Monitor Mobile SEO Performance Diagrams PDF
The purpose of this slide is to outline key performance indicator KPI dashboard which will assist the marketer to analyze mobile search engine optimization SEO performance. The key metrics mentioned in the slide are total sessions, search engine rankings etc. Take your projects to the next level with our ultimate collection of Introduction To Mobile SEM KPI Metrics Dashboard To Monitor Mobile SEO Performance Diagrams PDF. Slidegeeks has designed a range of layouts that are perfect for representing task or activity duration, keeping track of all your deadlines at a glance. Tailor these designs to your exact needs and give them a truly corporate look with your own brand colors they will make your projects stand out from the rest.
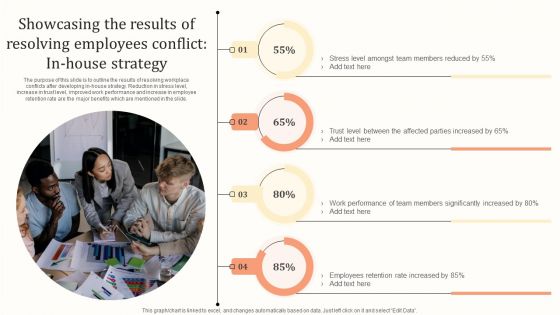
Showcasing The Results Of Resolving Employees Conflict In House Strategy Diagrams PDF
The purpose of this slide is to outline the results of resolving workplace conflicts after developing in-house strategy. Reduction in stress level, increase in trust level, improved work performance and increase in employee retention rate are the major benefits which are mentioned in the slide. Take your projects to the next level with our ultimate collection of Showcasing The Results Of Resolving Employees Conflict In House Strategy Diagrams PDF. Slidegeeks has designed a range of layouts that are perfect for representing task or activity duration, keeping track of all your deadlines at a glance. Tailor these designs to your exact needs and give them a truly corporate look with your own brand colors they will make your projects stand out from the rest.
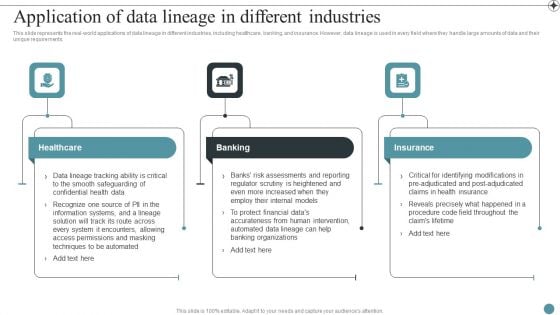
Application Of Data Lineage In Different Industries Deploying Data Lineage IT Diagrams PDF
This slide represents the real-world applications of data lineage in different industries, including healthcare, banking, and insurance. However, data lineage is used in every field where they handle large amounts of data and their unique requirements.Take your projects to the next level with our ultimate collection of Application Of Data Lineage In Different Industries Deploying Data Lineage IT Diagrams PDF. Slidegeeks has designed a range of layouts that are perfect for representing task or activity duration, keeping track of all your deadlines at a glance. Tailor these designs to your exact needs and give them a truly corporate look with your own brand colors they all make your projects stand out from the rest.
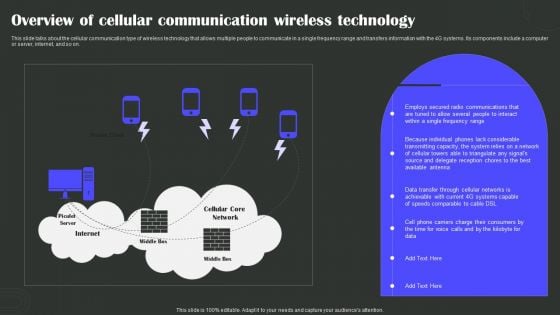
Overview Of Cellular Communication Wireless Technology Wireless Technology Transformation Diagrams PDF
This slide talks about the cellular communication type of wireless technology that allows multiple people to communicate in a single frequency range and transfers information with the 4G systems. Its components include a computer or server, internet, and so on. Take your projects to the next level with our ultimate collection of Overview Of Cellular Communication Wireless Technology Wireless Technology Transformation Diagrams PDF. Slidegeeks has designed a range of layouts that are perfect for representing task or activity duration, keeping track of all your deadlines at a glance. Tailor these designs to your exact needs and give them a truly corporate look with your own brand colors they well make your projects stand out from the rest.
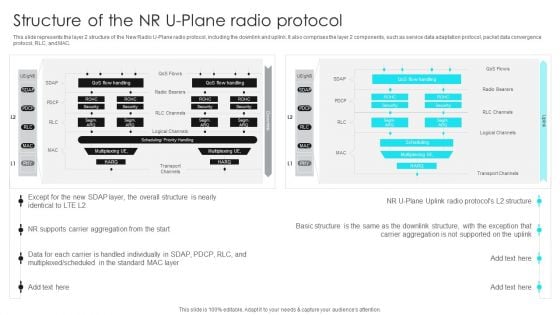
5G Network Operations Structure Of The NR U Plane Radio Protocol Diagrams PDF
This slide represents the layer 2 structure of the New Radio U-Plane radio protocol, including the downlink and uplink. It also comprises the layer 2 components, such as service data adaptation protocol, packet data convergence protocol, RLC, and MAC. Take your projects to the next level with our ultimate collection of 5G Network Operations Structure Of The NR U Plane Radio Protocol Diagrams PDF. Slidegeeks has designed a range of layouts that are perfect for representing task or activity duration, keeping track of all your deadlines at a glance. Tailor these designs to your exact needs and give them a truly corporate look with your own brand colors they will make your projects stand out from the rest.
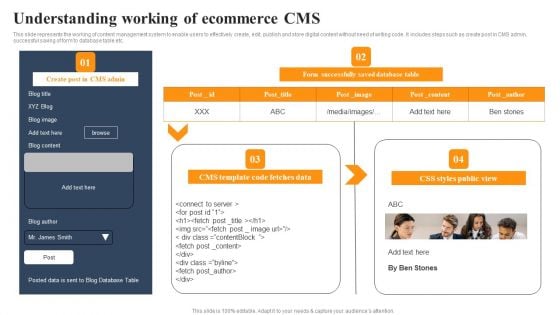
Implementing An Effective Ecommerce Management Framework Understanding Working Of Ecommerce CMS Diagrams PDF
This slide represents the working of content management system to enable users to effectively create, edit, publish and store digital content without need of writing code. It includes steps such as create post in CMS admin, successful saving of form to database table etc. Take your projects to the next level with our ultimate collection of Implementing An Effective Ecommerce Management Framework Understanding Working Of Ecommerce CMS Diagrams PDF. Slidegeeks has designed a range of layouts that are perfect for representing task or activity duration, keeping track of all your deadlines at a glance. Tailor these designs to your exact needs and give them a truly corporate look with your own brand colors they will make your projects stand out from the rest
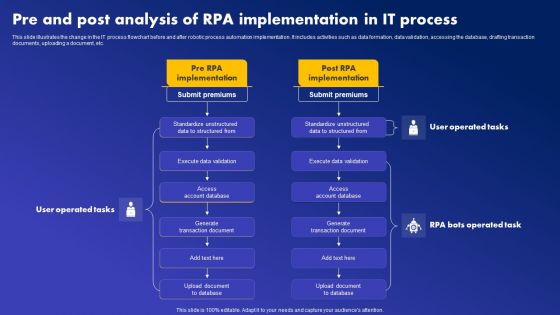
Pre And Post Analysis Of RPA Implementation In It Process Diagrams PDF
This slide illustrates the change in the IT process flowchart before and after robotic process automation implementation. It includes activities such as data formation, data validation, accessing the database, drafting transaction documents, uploading a document, etc. Take your projects to the next level with our ultimate collection of Pre And Post Analysis Of RPA Implementation In It Process Diagrams PDF. Slidegeeks has designed a range of layouts that are perfect for representing task or activity duration, keeping track of all your deadlines at a glance. Tailor these designs to your exact needs and give them a truly corporate look with your own brand colors they will make your projects stand out from the rest
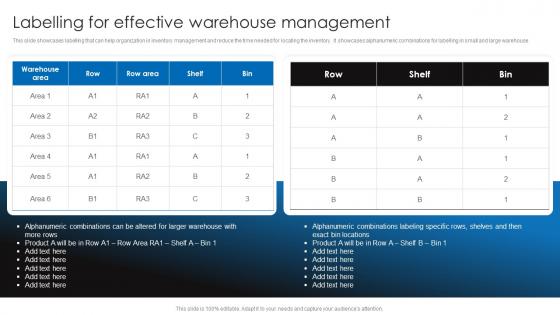
Labelling For Effective Warehouse Management Retail Stock Administration Strategies Diagrams Pdf
This slide showcases labelling that can help organization in inventory management and reduce the time needed for locating the inventory. It showcases alphanumeric combinations for labelling in small and large warehouse.Take your projects to the next level with our ultimate collection of Labelling For Effective Warehouse Management Retail Stock Administration Strategies Diagrams Pdf. Slidegeeks has designed a range of layouts that are perfect for representing task or activity duration, keeping track of all your deadlines at a glance. Tailor these designs to your exact needs and give them a truly corporate look with your own brand colors they all make your projects stand out from the rest. This slide showcases labelling that can help organization in inventory management and reduce the time needed for locating the inventory. It showcases alphanumeric combinations for labelling in small and large warehouse


 Continue with Email

 Home
Home


