Project Diagram
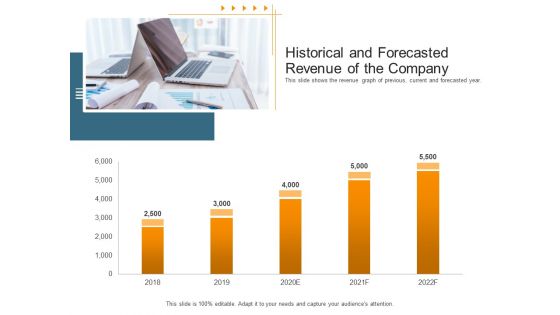
Pitch Deck Raise Capital Interim Financing Investments Historical And Forecasted Revenue Of The Company Diagrams PDF
Deliver and pitch your topic in the best possible manner with this pitch deck raise capital interim financing investments historical and forecasted revenue of the company diagrams pdf. Use them to share invaluable insights on historical and forecasted revenue of the company and impress your audience. This template can be altered and modified as per your expectations. So, grab it now.
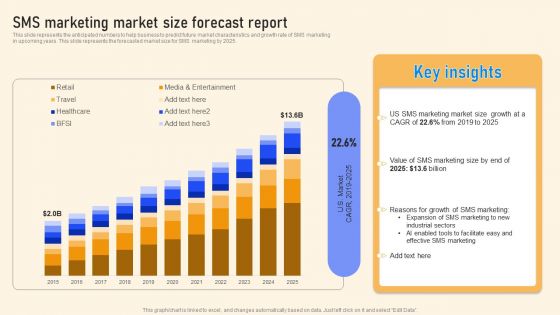
SMS Marketing Market Size Forecast Report Ppt PowerPoint Presentation File Diagrams PDF
This slide represents the anticipated numbers to help business to predict future market characteristics and growth rate of SMS marketing in upcoming years. This slide represents the forecasted market size for SMS marketing by 2025. From laying roadmaps to briefing everything in detail, our templates are perfect for you. You can set the stage with your presentation slides. All you have to do is download these easy to edit and customizable templates. SMS Marketing Market Size Forecast Report Ppt PowerPoint Presentation File Diagrams PDF will help you deliver an outstanding performance that everyone would remember and praise you for. Do download this presentation today.

Insurance Organization Pitch Deck Raise Money Financials Forecast Income Statement Balance Sheet Numbers Diagrams PDF
Deliver and pitch your topic in the best possible manner with this insurance organization pitch deck raise money financials forecast income statement balance sheet numbers diagrams pdf. Use them to share invaluable insights on revenue, gross profit, net cash flows, working capital, criteria and impress your audience. This template can be altered and modified as per your expectations. So, grab it now.
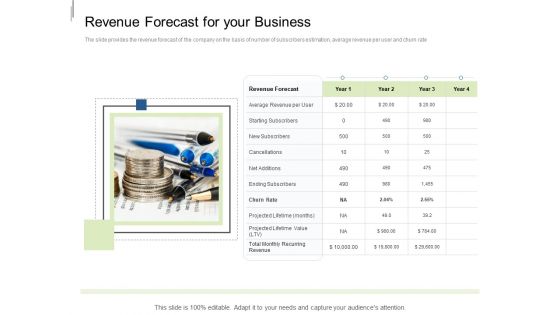
Equity Crowdfunding Pitch Deck Revenue Forecast For Your Business Diagrams PDF
The slide provides the revenue forecast of the company on the basis of number of subscribers estimation, average revenue per user and churn rate. This is a equity crowdfunding pitch deck revenue forecast for your business diagrams pdf template with various stages. Focus and dispense information on four stages using this creative set, that comes with editable features. It contains large content boxes to add your information on topics like average revenue, starting subscribers, new subscribers, cancellations. You can also showcase facts, figures, and other relevant content using this PPT layout. Grab it now.
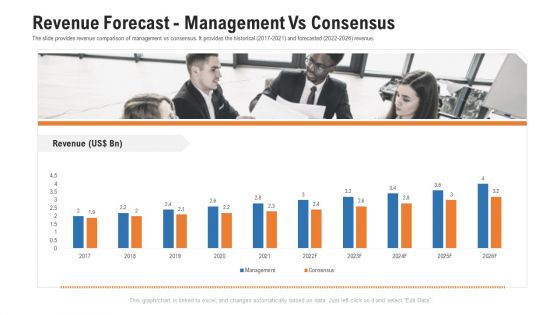
Pitch Deck For Procurement Deal Revenue Forecast Management Vs Consensus Diagrams PDF
The slide provides revenue comparison of management vs consensus. It provides the historical 2017-2021 and forecasted 2022-2026 revenue. Deliver an awe inspiring pitch with this creative pitch deck for procurement deal revenue forecast management vs consensus diagrams pdf bundle. Topics like revenue forecast management vs consensus can be discussed with this completely editable template. It is available for immediate download depending on the needs and requirements of the user.
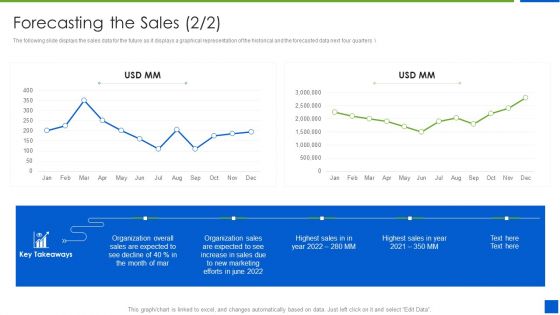
Improving Brand Recognition With Message And Differentiation Strategy Forecasting The Sales Decline Diagrams PDF
The following slide displays the sales data for the future as it displays a graphical representation of the historical and the forecasted data next four quarters Deliver and pitch your topic in the best possible manner with this improving brand recognition with message and differentiation strategy forecasting the sales decline diagrams pdf. Use them to share invaluable insights on forecasting the sales and impress your audience. This template can be altered and modified as per your expectations. So, grab it now.
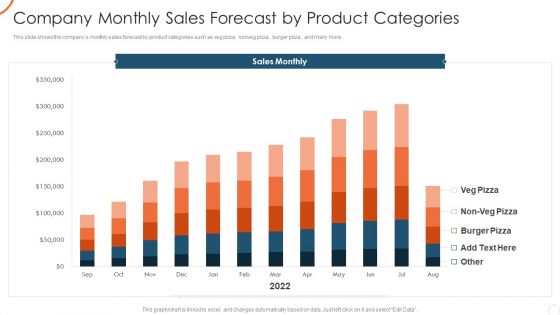
Corporate Strategy For Business Development Company Monthly Sales Forecast Diagrams PDF
This slide shows the companys monthly sales forecast by product categories such as veg pizza, nonveg pizza, burger pizza, and many more. Deliver an awe inspiring pitch with this creative corporate strategy for business development company monthly sales forecast diagrams pdf bundle. Topics like company monthly sales forecast by product categories can be discussed with this completely editable template. It is available for immediate download depending on the needs and requirements of the user.
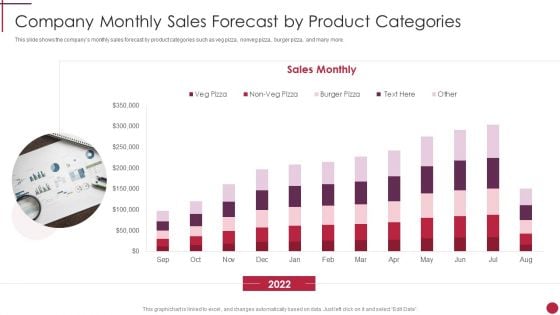
Company Monthly Sales Forecast By Product Categories Start Up Master Plan Diagrams PDF
This slide shows the companys monthly sales forecast by product categories such as veg pizza, nonveg pizza, burger pizza, and many more.Deliver and pitch your topic in the best possible manner with this company monthly sales forecast by product categories start up master plan diagrams pdf Use them to share invaluable insights on company monthly sales forecast by product categories and impress your audience. This template can be altered and modified as per your expectations. So, grab it now.

Increase Returns By Examining And Executing New Sales Qualification Procedure Forecasting The Sales Diagrams PDF
Purpose of the following slide is to show the sales forecasting for the organization as it displays the sales for the current and forecasted year. Deliver and pitch your topic in the best possible manner with this increase returns by examining and executing new sales qualification procedure forecasting the sales diagrams pdf. Use them to share invaluable insights on forecasting the sales and impress your audience. This template can be altered and modified as per your expectations. So, grab it now.
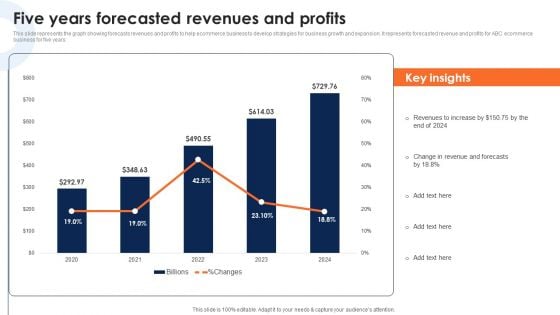
Five Years Forecasted Revenues And Profits Deploying Ecommerce Order Management Software Diagrams PDF
This slide represents the graph showing forecasts revenues and profits to help ecommerce business to develop strategies for business growth and expansion. It represents forecasted revenue and profits for ABC ecommerce business for five years.Crafting an eye-catching presentation has never been more straightforward. Let your presentation shine with this tasteful yet straightforward Five Years Forecasted Revenues And Profits Deploying Ecommerce Order Management Software Diagrams PDF template. It offers a minimalistic and classy look that is great for making a statement. The colors have been employed intelligently to add a bit of playfulness while still remaining professional. Construct the ideal Five Years Forecasted Revenues And Profits Deploying Ecommerce Order Management Software Diagrams PDF that effortlessly grabs the attention of your audience. Begin now and be certain to wow your customers.
Manpower Planning And Development Process With Forecasting Demand And Supply Ppt PowerPoint Presentation Icon Diagrams PDF
Presenting this set of slides with name manpower planning and development process with forecasting demand and supply ppt powerpoint presentation icon diagrams pdf. This is a seven stage process. The stages in this process are objectives of human, resource planning, current manpower inventory, forecasting demand and supply, manpower gaps, appraisal of manpower planning, training and development, employee plan. This is a completely editable PowerPoint presentation and is available for immediate download. Download now and impress your audience.
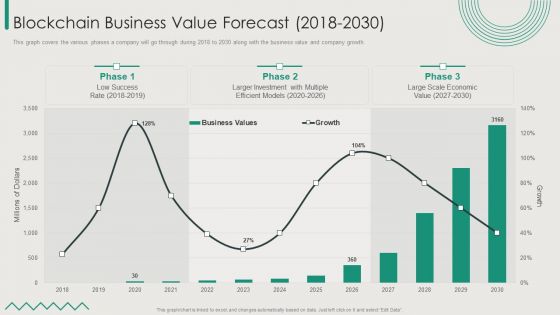
Organization Transition Blockchain Business Value Forecast 2018 To 2030 Diagrams PDF
This graph covers the various phases a company will go through during 2018 to 2030 along with the business value and company growth. Deliver an awe inspiring pitch with this creative Organization Transition Blockchain Business Value Forecast 2018 To 2030 Diagrams PDF bundle. Topics like Low Success Rate, Larger Investment, Business Values can be discussed with this completely editable template. It is available for immediate download depending on the needs and requirements of the user.
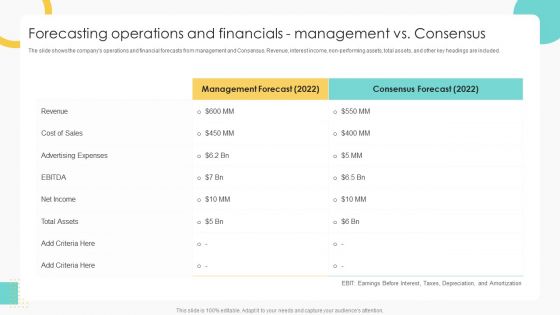
Buy Side Merger And Acquisition Pitch Book Forecasting Operations And Financials Management Vs Consensus Diagrams PDF
The slide shows the companys operations and financial forecasts from management and Consensus. Revenue, interest income, non performing assets, total assets, and other key headings are included. Deliver an awe inspiring pitch with this creative Buy Side Merger And Acquisition Pitch Book Forecasting Operations And Financials Management Vs Consensus Diagrams PDF bundle. Topics like Advertising Expenses, Revenue, Cost Of Sales can be discussed with this completely editable template. It is available for immediate download depending on the needs and requirements of the user.
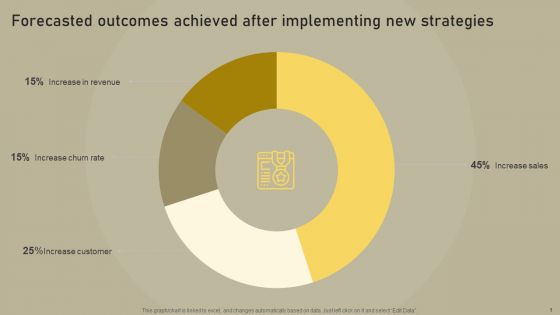
Customer Experience Optimization Forecasted Outcomes Achieved After Implementing New Diagrams PDF
Boost your pitch with our creative Customer Experience Optimization Forecasted Outcomes Achieved After Implementing New Diagrams PDF. Deliver an awe-inspiring pitch that will mesmerize everyone. Using these presentation templates you will surely catch everyones attention. You can browse the ppts collection on our website. We have researchers who are experts at creating the right content for the templates. So you do not have to invest time in any additional work. Just grab the template now and use them.
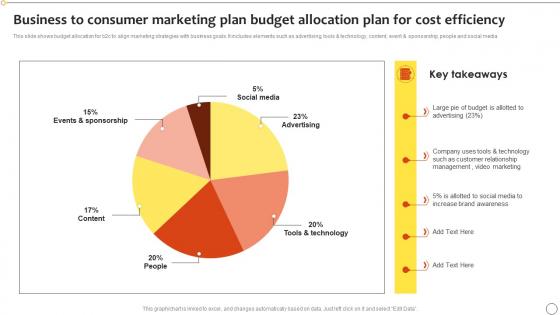
Business To Consumer Marketing Plan Budget Allocation Plan For Cost Efficiency Diagrams Pdf
This slide shows budget allocation for b2c to align marketing strategies with business goals. It includes elements such as advertising, tools and technology, content, event and sponsorship, people and social media Pitch your topic with ease and precision using this Business To Consumer Marketing Plan Budget Allocation Plan For Cost Efficiency Diagrams Pdf. This layout presents information on Business Consumer Marketing, Plan Budget Allocation, Plan For Cost Efficiency. It is also available for immediate download and adjustment. So, changes can be made in the color, design, graphics or any other component to create a unique layout. This slide shows budget allocation for b2c to align marketing strategies with business goals. It includes elements such as advertising, tools and technology, content, event and sponsorship, people and social media
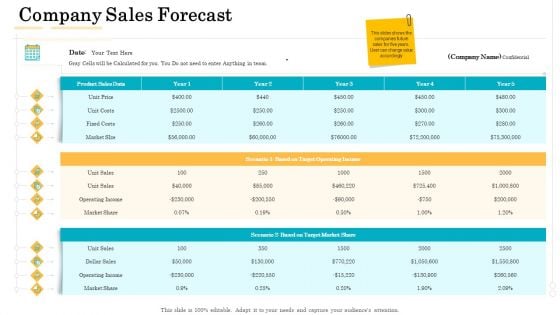
Administrative Regulation Company Sales Forecast Ppt PowerPoint Presentation Ideas Diagrams PDF
Deliver and pitch your topic in the best possible manner with this administrative regulation company sales forecast ppt powerpoint presentation ideas diagrams pdf. Use them to share invaluable insights on product sales data, based target operating income, based target market share, unit sales, market share, dollar sales and impress your audience. This template can be altered and modified as per your expectations. So, grab it now.
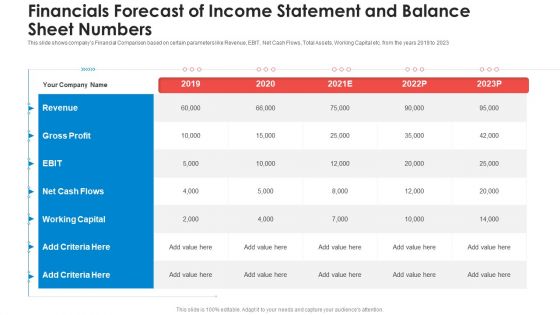
Financials Forecast Of Income Statement And Balance Sheet Numbers Diagrams PDF
This slide shows companys Financial Comparison based on certain parameters like Revenue, EBIT, Net Cash Flows, Total Assets, Working Capital etc. from the years 2019 to 2023 Deliver an awe inspiring pitch with this creative financials forecast of income statement and balance sheet numbers diagrams pdf. bundle. Topics like working capital, gross profit, net cash flows can be discussed with this completely editable template. It is available for immediate download depending on the needs and requirements of the user.
Incident Management Chart Change Execution Plan Ppt PowerPoint Presentation Icon Diagrams PDF
This slide illustrates the incidents of the transition project. It covers the details such as explanation, status, priority, and resolution of the incident to ensure that technological change is successfully completed in the organization. Deliver and pitch your topic in the best possible manner with this Incident Management Chart Change Execution Plan Ppt PowerPoint Presentation Icon Diagrams PDF. Use them to share invaluable insights on Incident Status Priority, Cyber Attack Sensitive, Added Data Security and impress your audience. This template can be altered and modified as per your expectations. So, grab it now.
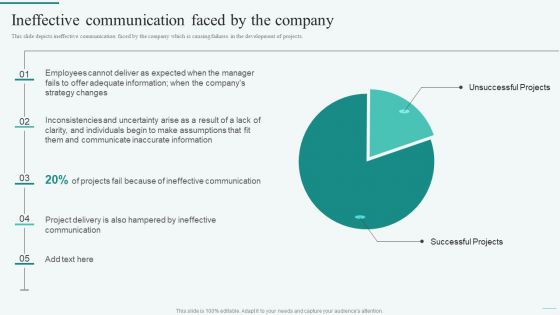
Ineffective Communication Faced By The Company Integration Of Dynamic System Diagrams PDF
This slide depicts ineffective communication faced by the company which is causing failures in the development of projects. The best PPT templates are a great way to save time, energy, and resources. Slidegeeks have 100 precent editable powerpoint slides making them incredibly versatile. With these quality presentation templates, you can create a captivating and memorable presentation by combining visually appealing slides and effectively communicating your message. Download Ineffective Communication Faced By The Company Integration Of Dynamic System Diagrams PDF from Slidegeeks and deliver a wonderful presentation.
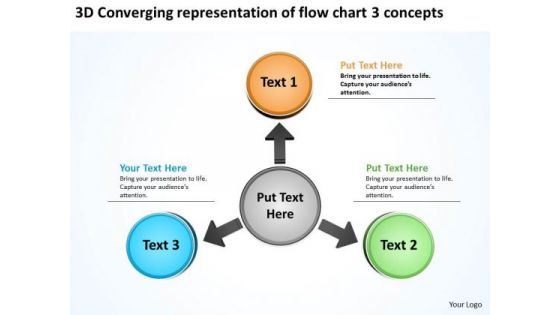
Converging Representation Of Flow Chart 3 Concepts Charts And Diagrams PowerPoint Templates
We present our converging representation of flow chart 3 concepts Charts and Diagrams PowerPoint templates.Download our Circle Charts PowerPoint Templates because the mind is always whirring with new ideas. Download our Arrows PowerPoint Templates because this template helps you to motivate each and every one of your group to give it his very best. Download our Business PowerPoint Templates because the fruits of your labour are beginning to show.Enlighten them on the great plans you have for their enjoyment. Use our Shapes PowerPoint Templates because this diagram is designed to help your audience to develop their thoughts along the way. Download our Flow Charts PowerPoint Templates because Our PowerPoint Templates and Slides are topically designed to provide an attractive backdrop to any subject.Use these PowerPoint slides for presentations relating to 3d, abstract, aim, arrow, arrow sign, background, career, chart, circle, color, concept, curve, design, development, financial, flowing, forward, gain, graph, green, group, higher, illustration, increase, isolated, motion, moving up, onwards, path, positivity, prediction, progress, red, sales, series, shape, sign, success, symbol, target, turn, twisted, up, upload, upward, way, white, winner. The prominent colors used in the PowerPoint template are Orange, Green, Blue. Customers tell us our converging representation of flow chart 3 concepts Charts and Diagrams PowerPoint templates are Classic. PowerPoint presentation experts tell us our arrow PowerPoint templates and PPT Slides are Spectacular. People tell us our converging representation of flow chart 3 concepts Charts and Diagrams PowerPoint templates are Spectacular. People tell us our arrow PowerPoint templates and PPT Slides are Nostalgic. Customers tell us our converging representation of flow chart 3 concepts Charts and Diagrams PowerPoint templates are Spectacular. People tell us our chart PowerPoint templates and PPT Slides are Upbeat. Our Converging Representation Of Flow Chart 3 Concepts Charts And Diagrams PowerPoint Templates exemplify character. They always deliver on promises.
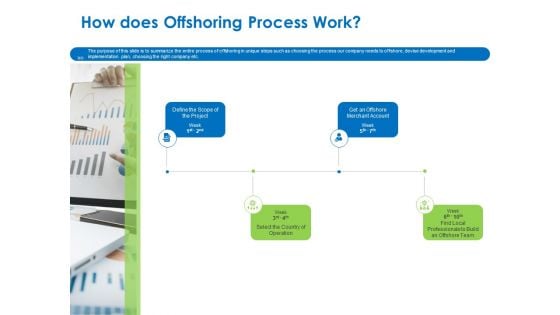
Relocation Of Business Process Offshoring How Does Offshoring Process Work Diagrams PDF
The purpose of this slide is to summarize the entire process of offshoring in unique steps such as choosing the process our company needs to offshore, devise development and implementation plan, choosing the right company etc. This is a relocation of business process offshoring how does offshoring process work diagrams pdf template with various stages. Focus and dispense information on four stages using this creative set, that comes with editable features. It contains large content boxes to add your information on topics like scope project, offshore merchant account, local professionals, build offshore team, operation. You can also showcase facts, figures, and other relevant content using this PPT layout. Grab it now.
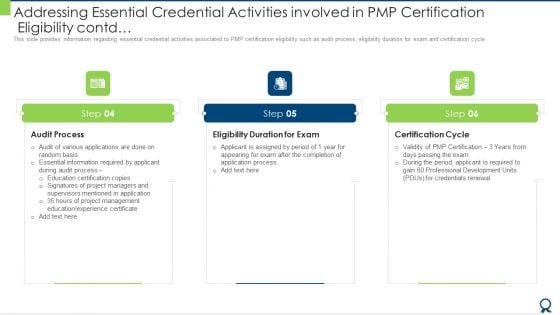
Addressing Essential Credential Activities Involved In PMP Certification Eligibility Contd Diagrams PDF
This slide provides information regarding essential credential activities associated to PMP certification eligibility such as audit process, eligibility duration for exam and certification cycle. Presenting addressing essential credential activities involved in pmp certification eligibility contd diagrams pdf to provide visual cues and insights. Share and navigate important information on three stages that need your due attention. This template can be used to pitch topics like process, application, project, management, information. In addtion, this PPT design contains high resolution images, graphics, etc, that are easily editable and available for immediate download.
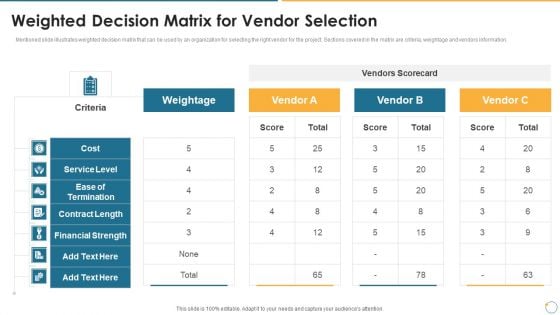
Collection Of Quality Assurance PPT Weighted Decision Matrix For Vendor Selection Diagrams PDF
Mentioned slide illustrates weighted decision matrix that can be used by an organization for selecting the right vendor for the project. Sections covered in the matrix are criteria, weightage and vendors information. Deliver an awe inspiring pitch with this creative collection of quality assurance ppt weighted decision matrix for vendor selection diagrams pdf bundle. Topics like weighted decision matrix for vendor selection can be discussed with this completely editable template. It is available for immediate download depending on the needs and requirements of the user.
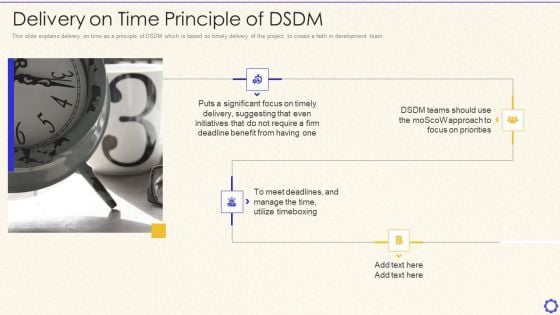
Dynamic System Development Method Tools And Techniques IT Delivery On Time Principle Of DSDM Diagrams PDF
This slide explains delivery on time as a principle of DSDM which is based on timely delivery of the project, to create a faith in development team. Presenting dynamic system development method tools and techniques it delivery on time principle of dsdm diagrams pdf to provide visual cues and insights. Share and navigate important information on four stages that need your due attention. This template can be used to pitch topics like significant, initiatives, benefit, require, suggesting. In addtion, this PPT design contains high resolution images, graphics, etc, that are easily editable and available for immediate download.
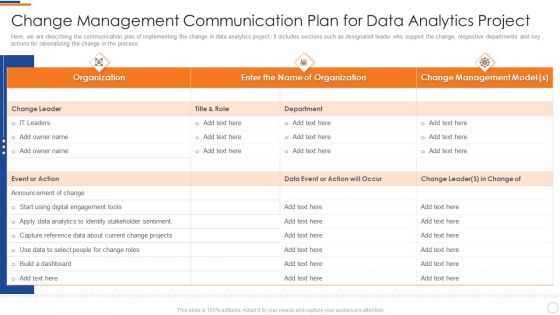
Business Intelligence And Big Data Analytics Change Management Communication Plan Diagrams PDF
Here, we are describing the communication plan of implementing the change in data analytics project. It includes sections such as designated leader who support the change, respective departments and key actions for rationalizing the change in the process. Deliver and pitch your topic in the best possible manner with this business intelligence and big data analytics change management communication plan diagrams pdf. Use them to share invaluable insights on change management model, organization, apply data analytics and impress your audience. This template can be altered and modified as per your expectations. So, grab it now.
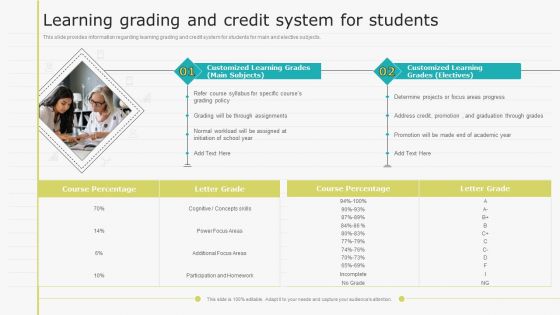
Virtual Learning Playbook Learning Grading And Credit System For Students Diagrams PDF
This slide provides information regarding learning grading and credit system for students for main and elective subjects. This is a Virtual Learning Playbook Learning Grading And Credit System For Students Diagrams PDF template with various stages. Focus and dispense information on two stages using this creative set, that comes with editable features. It contains large content boxes to add your information on topics like Determine Projects, Learning Grading, Credit System. You can also showcase facts, figures, and other relevant content using this PPT layout. Grab it now.
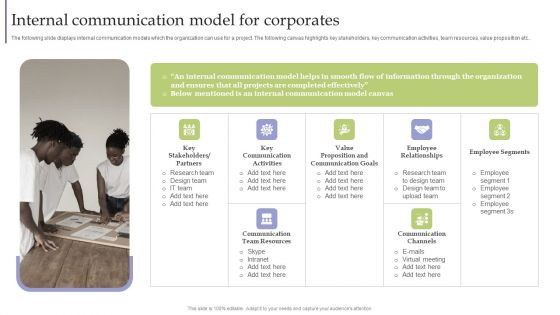
Strategic Guide For Corporate Executive Internal Communication Model For Corporates Diagrams PDF
The following slide displays internal communication models which the organization can use for a project. The following canvas highlights key stakeholders, key communication activities, team resources, value proposition etc. Present like a pro with Strategic Guide For Corporate Executive Internal Communication Model For Corporates Diagrams PDF Create beautiful presentations together with your team, using our easy-to-use presentation slides. Share your ideas in real-time and make changes on the fly by downloading our templates. So whether youre in the office, on the go, or in a remote location, you can stay in sync with your team and present your ideas with confidence. With Slidegeeks presentation got a whole lot easier. Grab these presentations today.
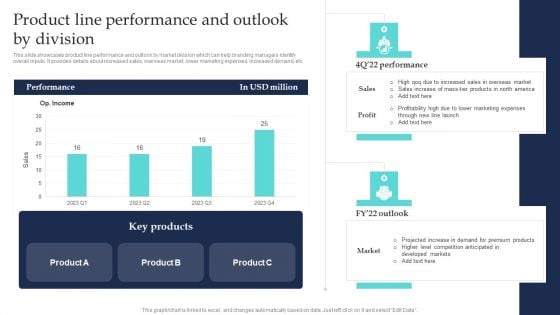
Commodity Line Extension Techniques Product Line Performance And Outlook By Division Diagrams PDF
This slide showcases product line performance and outlook by market division which can help branding managers identify overall inputs. It provides details about increased sales, overseas market, lower marketing expenses, increased demand, etc. Do you have to make sure that everyone on your team knows about any specific topic I yes, then you should give Commodity Line Extension Techniques Product Line Performance And Outlook By Division Diagrams PDF a try. Our experts have put a lot of knowledge and effort into creating this impeccable Commodity Line Extension Techniques Product Line Performance And Outlook By Division Diagrams PDF. You can use this template for your upcoming presentations, as the slides are perfect to represent even the tiniest detail. You can download these templates from the Slidegeeks website and these are easy to edit. So grab these today.
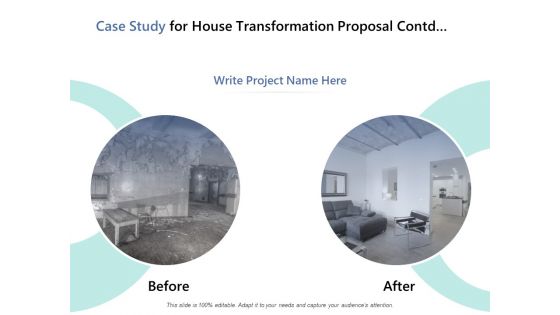
Case Study For House Transformation Proposal Contd Ppt PowerPoint Presentation File Diagrams
Presenting this set of slides with name case study for house transformation proposal contd ppt powerpoint presentation file diagrams. This is a two stage process. The stages in this process are Before, after, project. This is a completely editable PowerPoint presentation and is available for immediate download. Download now and impress your audience.
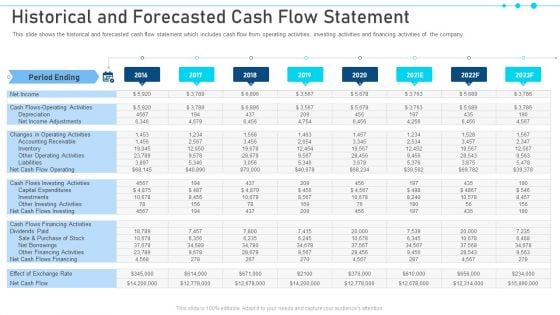
Pitch Deck For Raising Capital From Business Finances Historical And Forecasted Cash Flow Statement Diagrams PDF
This slide shows the historical and forecasted cash flow statement which includes cash flow from operating activities, investing activities and financing activities of the company. Deliver an awe-inspiring pitch with this creative pitch deck for raising capital from business finances historical and forecasted cash flow statement diagrams pdf. bundle. Topics like net income, net income adjustments, effect of exchange rate, net cash flows investing, purchase of stock can be discussed with this completely editable template. It is available for immediate download depending on the needs and requirements of the user.
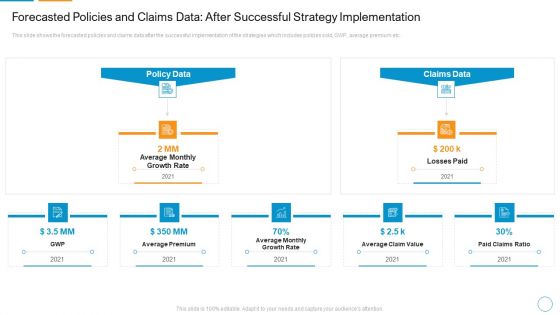
Forecasted Policies And Claims Data After Successful Strategy Implementation Diagrams PDF
This slide shows the forecasted policies and claims data after the successful implementation of the strategies which includes policies sold, GWP, average premium etc.Presenting forecasted policies and claims data after successful strategy implementation diagrams pdf to provide visual cues and insights. Share and navigate important information on five stages that need your due attention. This template can be used to pitch topics like average premium, average monthly growth rate, average claim value. In addtion, this PPT design contains high resolution images, graphics, etc, that are easily editable and available for immediate download.
Reinforcement Learning Techniques And Applications Performance Tracking Dashboard Reinforcement Diagrams PDF
This slide shows the roadmap for the reinforcement learning project, including the list of tasks to be performed from March 2023 to February 2024. The tasks include initializing the values table, observing the current state, choosing an action for that state, and so on. Formulating a presentation can take up a lot of effort and time, so the content and message should always be the primary focus. The visuals of the PowerPoint can enhance the presenters message, so our Reinforcement Learning Techniques And Applications Performance Tracking Dashboard Reinforcement Diagrams PDF was created to help save time. Instead of worrying about the design, the presenter can concentrate on the message while our designers work on creating the ideal templates for whatever situation is needed. Slidegeeks has experts for everything from amazing designs to valuable content, we have put everything into Reinforcement Learning Techniques And Applications Performance Tracking Dashboard Reinforcement Diagrams PDF
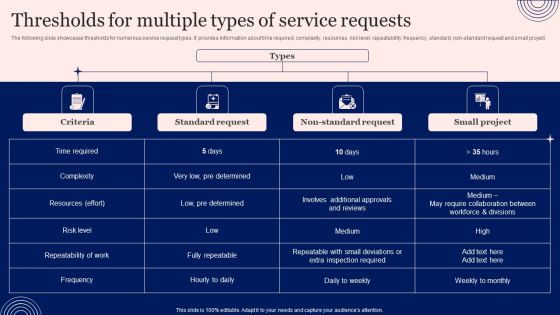
Implementing Advanced Service Help Desk Administration Program Thresholds For Multiple Types Of Service Requests Diagrams PDF
The following slide showcases thresholds for numerous service request types. It provides information about time required, complexity, resources, risk level, repeatability, frequency, standard, non-standard request and small project. Formulating a presentation can take up a lot of effort and time, so the content and message should always be the primary focus. The visuals of the PowerPoint can enhance the presenters message, so our Implementing Advanced Service Help Desk Administration Program Thresholds For Multiple Types Of Service Requests Diagrams PDF was created to help save time. Instead of worrying about the design, the presenter can concentrate on the message while our designers work on creating the ideal templates for whatever situation is needed. Slidegeeks has experts for everything from amazing designs to valuable content, we have put everything into Implementing Advanced Service Help Desk Administration Program Thresholds For Multiple Types Of Service Requests Diagrams PDF
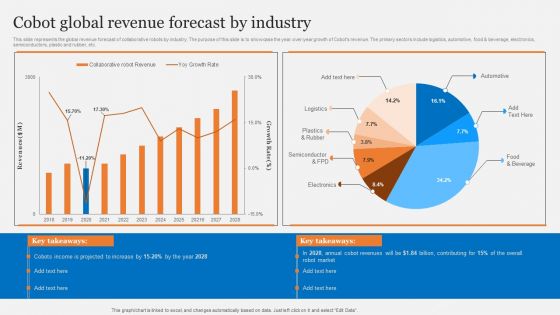
Cobots Usecases In Different Sectors Cobot Global Revenue Forecast By Industry Diagrams PDF
This slide represents the global revenue forecast of collaborative robots by industry. The purpose of this slide is to showcase the year-over-year growth of Cobots revenue. The primary sectors include logistics, automotive, food and beverage, electronics, semiconductors, plastic and rubber, etc. Slidegeeks is one of the best resources for PowerPoint templates. You can download easily and regulate Cobots Usecases In Different Sectors Cobot Global Revenue Forecast By Industry Diagrams PDF for your personal presentations from our wonderful collection. A few clicks is all it takes to discover and get the most relevant and appropriate templates. Use our Templates to add a unique zing and appeal to your presentation and meetings. All the slides are easy to edit and you can use them even for advertisement purposes.
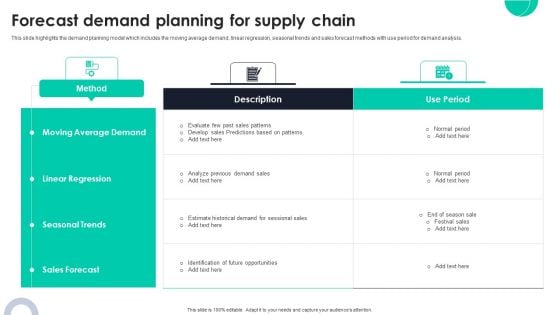
Forecast Demand Planning For Supply Chain Ppt PowerPoint Presentation File Diagrams PDF
This slide highlights the demand planning model which includes the moving average demand, linear regression, seasonal trends and sales forecast methods with use period for demand analysis. Are you in need of a template that can accommodate all of your creative concepts This one is crafted professionally and can be altered to fit any style. Use it with Google Slides or PowerPoint. Include striking photographs, symbols, depictions, and other visuals. Fill, move around, or remove text boxes as desired. Test out color palettes and font mixtures. Edit and save your work, or work with colleagues. Download Forecast Demand Planning For Supply Chain Ppt PowerPoint Presentation File Diagrams PDF and observe how to make your presentation outstanding. Give an impeccable presentation to your group and make your presentation unforgettable.
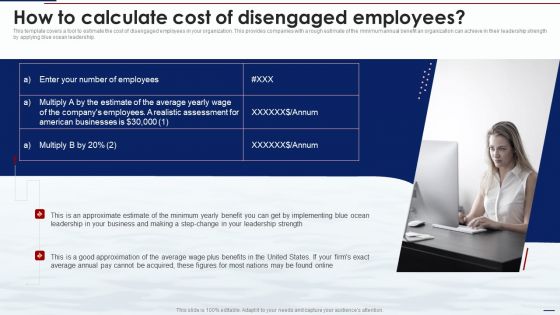
Blue Ocean Tactics How To Calculate Cost Of Disengaged Employees Diagrams PDF
This template covers a tool to estimate the cost of disengaged employees in your organization. This provides companies with a rough estimate of the minimum annual benefit an organization can achieve in their leadership strength by applying blue ocean leadership. Make sure to capture your audiences attention in your business displays with our gratis customizable Blue Ocean Tactics How To Calculate Cost Of Disengaged Employees Diagrams PDF. These are great for business strategies, office conferences, capital raising or task suggestions. If you desire to acquire more customers for your tech business and ensure they stay satisfied, create your own sales presentation with these plain slides.
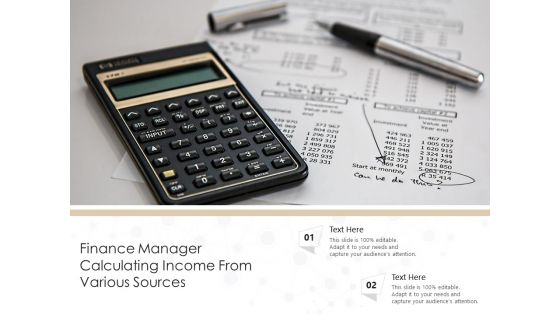
Finance Manager Calculating Income From Various Sources Ppt PowerPoint Presentation Gallery Diagrams PDF
Presenting finance manager calculating income from various sources ppt powerpoint presentation gallery diagrams pdf to dispense important information. This template comprises two stages. It also presents valuable insights into the topics including finance manager calculating income from various sources. This is a completely customizable PowerPoint theme that can be put to use immediately. So, download it and address the topic impactfully.

Predicted Benefits Achieve From Implementing Chatbot On Ecommerce Website Diagrams PDF
This slide shows the key benefits achieve by the company after implementing chatbot on companys website. Do you have an important presentation coming up Are you looking for something that will make your presentation stand out from the rest Look no further than Predicted Benefits Achieve From Implementing Chatbot On Ecommerce Website Diagrams PDF. With our professional designs, you can trust that your presentation will pop and make delivering it a smooth process. And with Slidegeeks, you can trust that your presentation will be unique and memorable. So why wait Grab Predicted Benefits Achieve From Implementing Chatbot On Ecommerce Website Diagrams PDF today and make your presentation stand out from the rest.
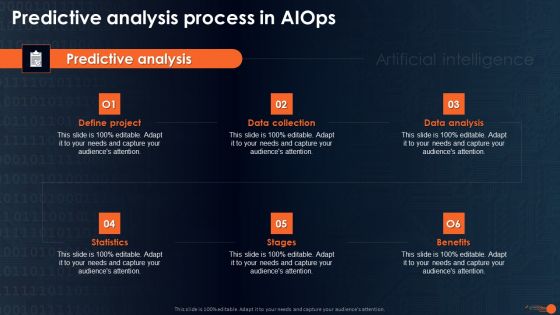
Integrating Aiops To Enhance Process Effectiveness Predictive Analysis Process In Aiops Diagrams PDF
Explore a selection of the finest Integrating Aiops To Enhance Process Effectiveness Predictive Analysis Process In Aiops Diagrams PDF here. With a plethora of professionally designed and pre-made slide templates, you can quickly and easily find the right one for your upcoming presentation. You can use our Integrating Aiops To Enhance Process Effectiveness Predictive Analysis Process In Aiops Diagrams PDF to effectively convey your message to a wider audience. Slidegeeks has done a lot of research before preparing these presentation templates. The content can be personalized and the slides are highly editable. Grab templates today from Slidegeeks.
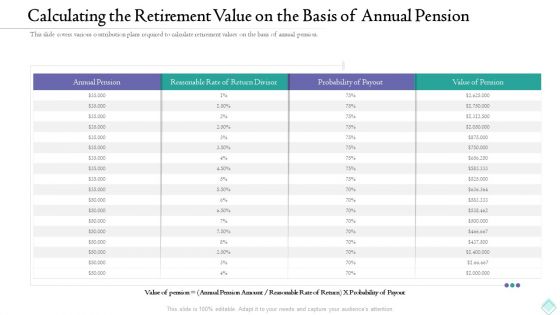
Calculating The Retirement Value On The Basis Of Annual Pension Diagrams PDF
This slide covers various contribution plans required to calculate retirement values on the basis of annual pension. Deliver an awe inspiring pitch with this creative calculating the retirement value on the basis of annual pension diagrams pdf bundle. Topics like calculating the retirement value on the basis of annual pension can be discussed with this completely editable template. It is available for immediate download depending on the needs and requirements of the user.
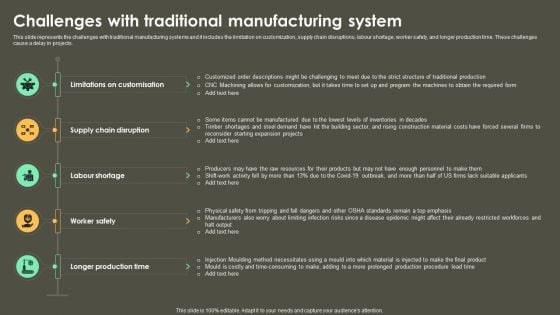
Iot Integration In Manufacturing Challenges With Traditional Manufacturing System Diagrams PDF
This slide represents the challenges with traditional manufacturing systems and it includes the limitation on customization, supply chain disruptions, labour shortage, worker safety, and longer production time. These challenges cause a delay in projects. Present like a pro with Iot Integration In Manufacturing Challenges With Traditional Manufacturing System Diagrams PDF Create beautiful presentations together with your team, using our easy-to-use presentation slides. Share your ideas in real-time and make changes on the fly by downloading our templates. So whether you are in the office, on the go, or in a remote location, you can stay in sync with your team and present your ideas with confidence. With Slidegeeks presentation got a whole lot easier. Grab these presentations today.
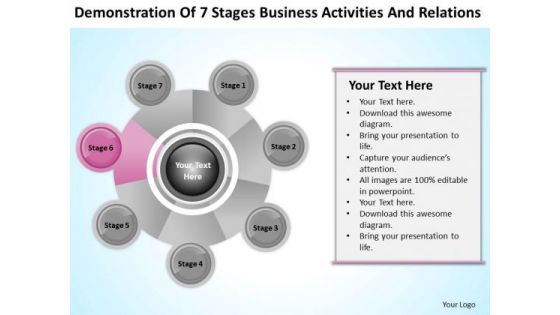
Business Analysis Diagrams Of 7 Stages Activities And Relations PowerPoint Template
We present our business analysis diagrams of 7 stages activities and relations PowerPoint template.Download and present our Business PowerPoint Templates because You will get more than you ever bargained for. Present our Circle Charts PowerPoint Templates because Our PowerPoint Templates and Slides are created by a hardworking bunch of busybees. Always flitting around with solutions gauranteed to please. Download our Shapes PowerPoint Templates because Your audience will believe you are the cats whiskers. Download and present our Process and Flows PowerPoint Templates because You can Be the puppeteer with our PowerPoint Templates and Slides as your strings. Lead your team through the steps of your script. Download our Leadership PowerPoint Templates because Our PowerPoint Templates and Slides are Clear and concise. Use them and dispel any doubts your team may have.Use these PowerPoint slides for presentations relating to project, flow, process, business, system, success, chart, work, innovation, implementation, plan, concept, evaluation, presentation, symbol, internet, diagram, analysis, flowchart, analyzing, technology, idea, development, management, steps, strategy, addie, design, outcome, assessment, structure. The prominent colors used in the PowerPoint template are Pink, Gray, White. Life is a bouquet with our Business Analysis Diagrams Of 7 Stages Activities And Relations PowerPoint Template. They come to you in a colorful array.
Business Analysis Diagrams Of 7 Stages Activities And Relations PowerPoint Templates
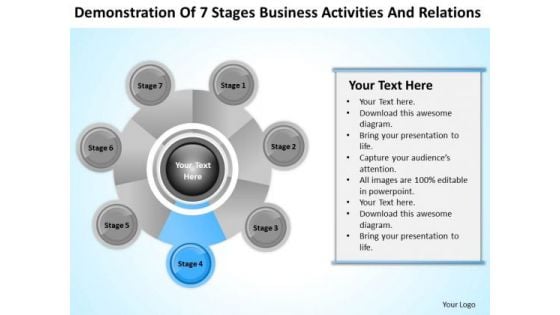
We present our business analysis diagrams of 7 stages activities and relations PowerPoint templates.Download and present our Business PowerPoint Templates because Your audience will believe you are the cats whiskers. Use our Circle Charts PowerPoint Templates because You will get more than you ever bargained for. Present our Shapes PowerPoint Templates because You can Bait your audience with our PowerPoint Templates and Slides. They will bite the hook of your ideas in large numbers. Use our Process and Flows PowerPoint Templates because You can Score a slam dunk with our PowerPoint Templates and Slides. Watch your audience hang onto your every word. Download and present our Leadership PowerPoint Templates because You can Hit the nail on the head with our PowerPoint Templates and Slides. Embed your ideas in the minds of your audience.Use these PowerPoint slides for presentations relating to project, flow, process, business, system, success, chart, work, innovation, implementation, plan, concept, evaluation, presentation, symbol, internet, diagram, analysis, flowchart, analyzing, technology, idea, development, management, steps, strategy, addie, design, outcome, assessment, structure. The prominent colors used in the PowerPoint template are Blue light, Gray, White. Develop their craving for your creativity. Become a brand name with our Business Analysis Diagrams Of 7 Stages Activities And Relations PowerPoint Templates.
Business Analysis Diagrams Of 7 Stages Activities And Relations Ppt PowerPoint Template
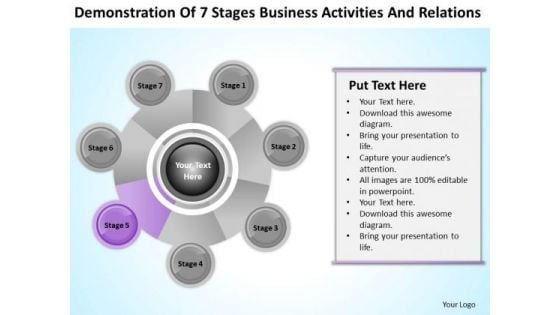
We present our business analysis diagrams of 7 stages activities and relations ppt PowerPoint template.Use our Business PowerPoint Templates because You can Create a matrix with our PowerPoint Templates and Slides. Feel the strength of your ideas click into place. Present our Circle Charts PowerPoint Templates because You will get more than you ever bargained for. Download and present our Shapes PowerPoint Templates because You can Raise a toast with our PowerPoint Templates and Slides. Spread good cheer amongst your audience. Use our Process and Flows PowerPoint Templates because Our PowerPoint Templates and Slides provide you with a vast range of viable options. Select the appropriate ones and just fill in your text. Download and present our Leadership PowerPoint Templates because It is Aesthetically crafted by artistic young minds. Our PowerPoint Templates and Slides are designed to display your dexterity.Use these PowerPoint slides for presentations relating to project, flow, process, business, system, success, chart, work, innovation, implementation, plan, concept, evaluation, presentation, symbol, internet, diagram, analysis, flowchart, analyzing, technology, idea, development, management, steps, strategy, addie, design, outcome, assessment, structure. The prominent colors used in the PowerPoint template are Purple, Gray, White. Try our Business Analysis Diagrams Of 7 Stages Activities And Relations Ppt PowerPoint Template and get bitten by the bug. You will cease to consider anything else.
Business Analysis Diagrams Of 7 Stages Activities And Relations Ppt PowerPoint Templates
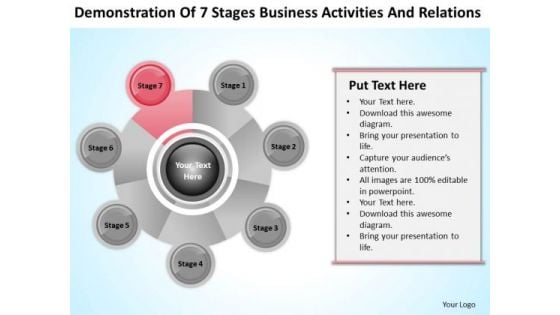
We present our business analysis diagrams of 7 stages activities and relations ppt PowerPoint templates.Download and present our Business PowerPoint Templates because You can Hit the nail on the head with our PowerPoint Templates and Slides. Embed your ideas in the minds of your audience. Use our Circle Charts PowerPoint Templates because It can Bubble and burst with your ideas. Use our Shapes PowerPoint Templates because You should Ascend the ladder of success with ease. Our PowerPoint Templates and Slides will provide strong and sturdy steps. Present our Process and Flows PowerPoint Templates because They will Put the wind in your sails. Skim smoothly over the choppy waters of the market. Present our Leadership PowerPoint Templates because you can Break through with our PowerPoint Templates and Slides. Bring down the mental barriers of your audience.Use these PowerPoint slides for presentations relating to project, flow, process, business, system, success, chart, work, innovation, implementation, plan, concept, evaluation, presentation, symbol, internet, diagram, analysis, flowchart, analyzing, technology, idea, development, management, steps, strategy, addie, design, outcome, assessment, structure. The prominent colors used in the PowerPoint template are Red, Gray, White. Manage expectations with our Business Analysis Diagrams Of 7 Stages Activities And Relations Ppt PowerPoint Templates. You will be at the top of your game.

Customer Churn Prediction And Prevention About Us Ppt Layouts Diagrams PDF
Presenting this set of slides with name customer churn prediction and prevention about us ppt layouts diagrams pdf. This is a three stage process. The stages in this process are target audiences, preferred by many, value clients. This is a completely editable PowerPoint presentation and is available for immediate download. Download now and impress your audience.
Key Consideration For Cost Estimation Focus On Initial High Level Scope Diagrams PDF
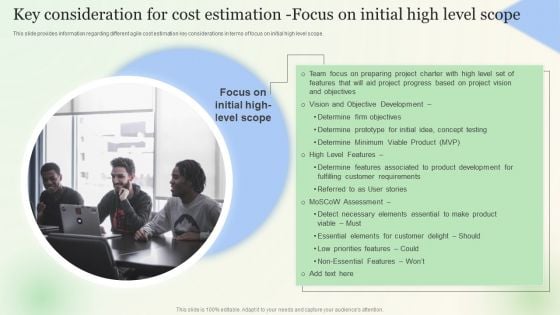
This slide provides information regarding different agile cost estimation key considerations in terms of focus on initial high level scope. Create an editable Key Consideration For Cost Estimation Focus On Initial High Level Scope Diagrams PDF that communicates your idea and engages your audience. Whether you are presenting a business or an educational presentation, pre-designed presentation templates help save time. Key Consideration For Cost Estimation Focus On Initial High Level Scope Diagrams PDF is highly customizable and very easy to edit, covering many different styles from creative to business presentations. Slidegeeks has creative team members who have crafted amazing templates. So, go and get them without any delay.
SWOT Analysis Guide To Develop And Estimate Brand Value Diagrams PDF
This SWOT Analysis Guide To Develop And Estimate Brand Value Diagrams PDF is perfect for any presentation, be it in front of clients or colleagues. It is a versatile and stylish solution for organizing your meetings. The SWOT Analysis Guide To Develop And Estimate Brand Value Diagrams PDF features a modern design for your presentation meetings. The adjustable and customizable slides provide unlimited possibilities for acing up your presentation. Slidegeeks has done all the homework before launching the product for you. So, do not wait, grab the presentation templates today.
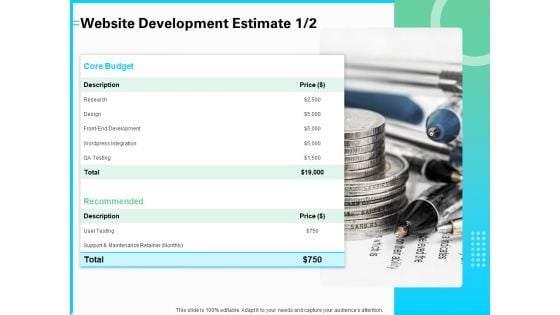
Web Development And IT Design Website Development Estimate Ppt PowerPoint Presentation Professional Diagrams PDF
This is a web development and it design website development estimate ppt powerpoint presentation professional diagrams pdf template with various stages. Focus and dispense information on one stages using this creative set, that comes with editable features. It contains large content boxes to add your information on topics like core budget, research, recommended, support and maintenance retainer, research. You can also showcase facts, figures, and other relevant content using this PPT layout. Grab it now.
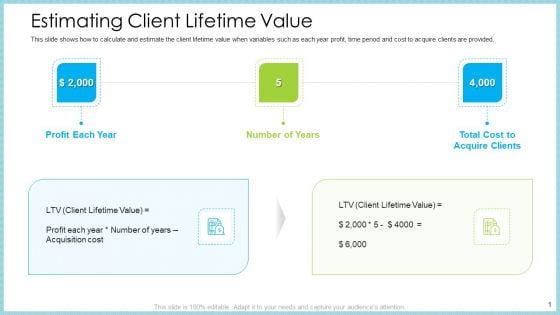
Customer Acquiring Price For Retaining New Clients Estimating Client Lifetime Value Diagrams PDF
This slide shows how to calculate and estimate the client lifetime value when variables such as each year profit, time period and cost to acquire clients are provided. This is a customer acquiring price for retaining new clients estimating client lifetime value diagrams pdf template with various stages. Focus and dispense information on three stages using this creative set, that comes with editable features. It contains large content boxes to add your information on topics like estimating client lifetime value. You can also showcase facts, figures, and other relevant content using this PPT layout. Grab it now.
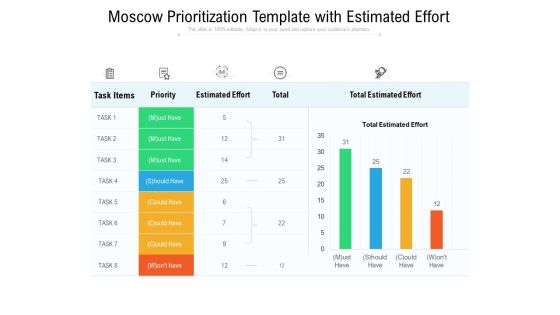
Moscow Prioritization Template With Estimated Effort Ppt PowerPoint Presentation Styles Diagrams PDF
Presenting this set of slides with name moscow prioritization template with estimated effort ppt powerpoint presentation styles diagrams pdf. The topics discussed in these slides are task items, priority, estimated effort, total, total estimated effort. This is a completely editable PowerPoint presentation and is available for immediate download. Download now and impress your audience.
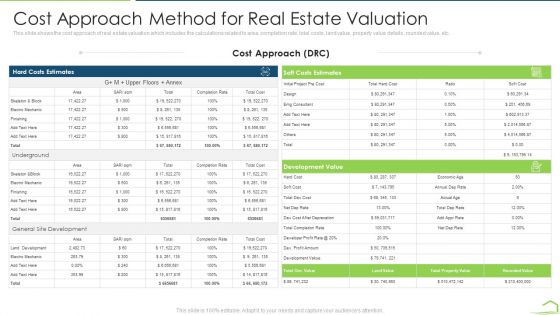
Procedure Land Estimation Examination Cost Approach Method For Real Estate Valuation Diagrams PDF
This slide shows the cost approach of real estate valuation which includes the calculations related to area, completion rate, total costs, land value, property value details, rounded value, etc. Deliver and pitch your topic in the best possible manner with this procedure land estimation examination cost approach method for real estate valuation diagrams pdf. Use them to share invaluable insights on cost approach method for real estate valuation and impress your audience. This template can be altered and modified as per your expectations. So, grab it now.
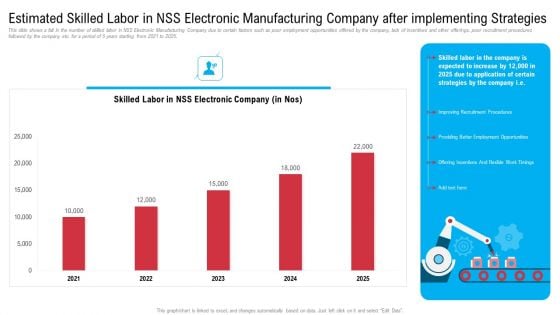
Estimated Skilled Labor In Nss Electronic Manufacturing Company After Implementing Strategies Diagrams PDF
Deliver an awe inspiring pitch with this creative estimated skilled labor in nss electronic manufacturing company after implementing strategies diagrams pdf bundle. Topics like improving recruitment procedures, providing better employment opportunities, offering incentives and flexible work timings can be discussed with this completely editable template. It is available for immediate download depending on the needs and requirements of the user.
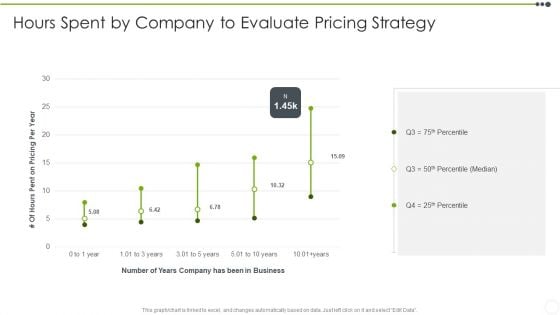
Estimating The Price Hours Spent By Company To Evaluate Pricing Strategy Diagrams PDF
Deliver and pitch your topic in the best possible manner with this Estimating The Price Hours Spent By Company To Evaluate Pricing Strategy Diagrams PDF. Use them to share invaluable insights on Hours Spent By Company To Evaluate Pricing Strategy and impress your audience. This template can be altered and modified as per your expectations. So, grab it now.
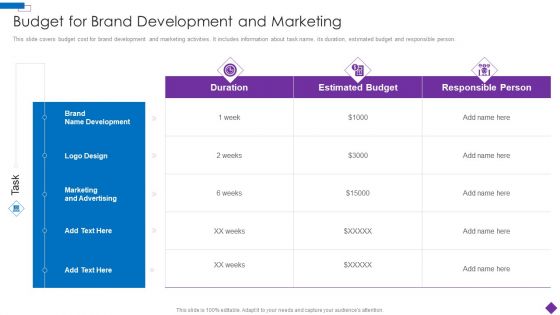
Introducing A New Product To The Market Budget For Brand Development And Marketing Diagrams PDF
This slide covers budget cost for brand development and marketing activities. It includes information about task name, its duration, estimated budget and responsible person.Deliver an awe inspiring pitch with this creative Introducing A New Product To The Market Budget For Brand Development And Marketing Diagrams PDF bundle. Topics like Estimated Budget, Marketing And Advertising, Responsible Person can be discussed with this completely editable template. It is available for immediate download depending on the needs and requirements of the user.
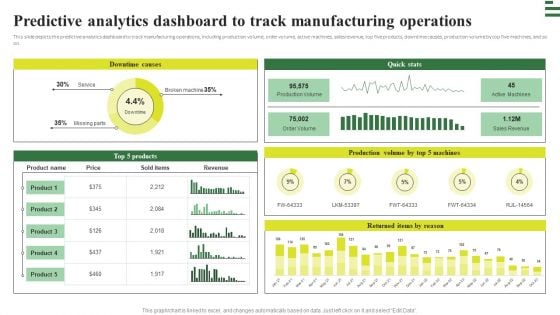
Transforming Manufacturing With Automation Predictive Analytics Dashboard To Track Diagrams PDF
This slide depicts the predictive analytics dashboard to track manufacturing operations, including production volume, order volume, active machines, sales revenue, top five products, downtime causes, production volume by top five machines, and so on. Get a simple yet stunning designed Transforming Manufacturing With Automation Predictive Analytics Dashboard To Track Diagrams PDF. It is the best one to establish the tone in your meetings. It is an excellent way to make your presentations highly effective. So, download this PPT today from Slidegeeks and see the positive impacts. Our easy to edit Transforming Manufacturing With Automation Predictive Analytics Dashboard To Track Diagrams PDF can be your go to option for all upcoming conferences and meetings. So, what are you waiting for Grab this template today.
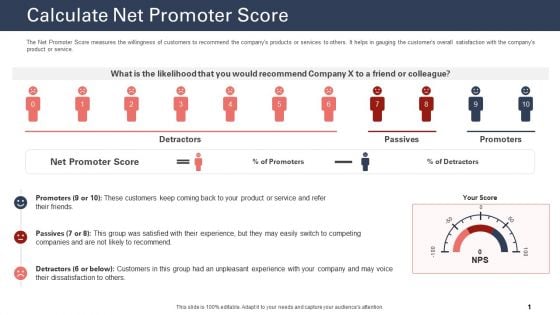
Techniques To Increase Customer Satisfaction Calculate Net Promoter Score Diagrams PDF
The Net Promoter Score measures the willingness of customers to recommend the companys products or services to others. It helps in gauging the customers overall satisfaction with the companys product or service. Deliver an awe inspiring pitch with this creative techniques to increase customer satisfaction calculate net promoter score diagrams pdf bundle. Topics like calculate net promoter score, product or service, net promoter score can be discussed with this completely editable template. It is available for immediate download depending on the needs and requirements of the user.
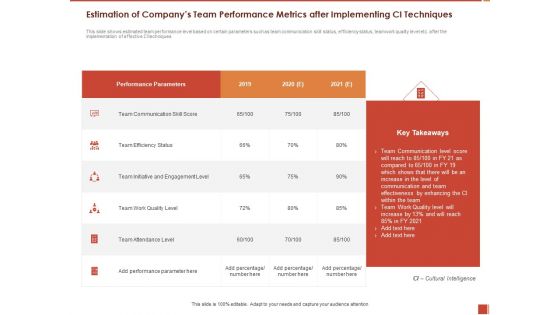
Cultural Intelligence Importance Workplace Productivity Estimation Of Companys Team Performance Diagrams PDF
Presenting this set of slides with name cultural intelligence importance workplace productivity estimation of companys team performance diagrams pdf. The topics discussed in these slides are team communication skill score, team efficiency status, team initiative and engagement level. This is a completely editable PowerPoint presentation and is available for immediate download. Download now and impress your audience.
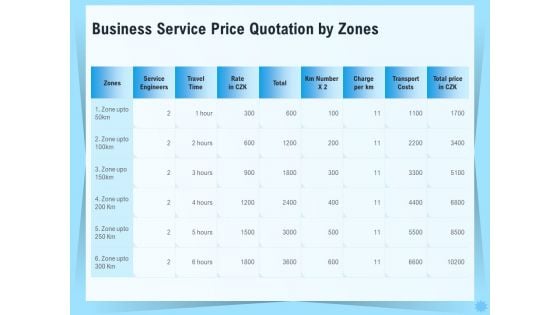
Professional Quotation Estimation Solutions Business Service Price Quotation By Zones Diagrams PDF
Presenting this set of slides with name professional quotation estimation solutions business service price quotation by zones diagrams pdf. The topics discussed in these slides are zones, service engineers, travel time, charge per km, transport costs. This is a completely editable PowerPoint presentation and is available for immediate download. Download now and impress your audience.
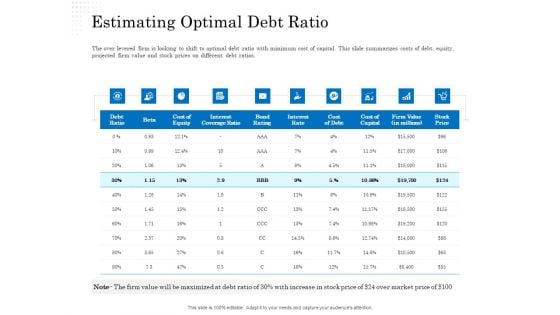
Business Finance Options Debt Vs Equity Estimating Optimal Debt Ratio Diagrams PDF
Deliver and pitch your topic in the best possible manner with this business finance options debt vs equity estimating optimal debt ratio diagrams pdf. Use them to share invaluable insights on cost, capital, firm value, equity, debt ratio and impress your audience. This template can be altered and modified as per your expectations. So, grab it now.


 Continue with Email

 Home
Home


