Project Kpi
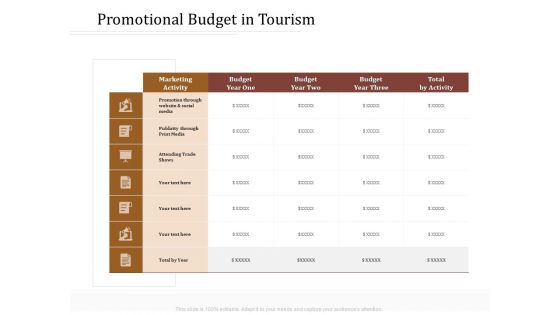
Key Metrics Hotel Administration Management Promotional Budget In Tourism Demonstration PDF
Presenting this set of slides with name key metrics hotel administration management promotional budget in tourism demonstration pdf. The topics discussed in these slides are marketing, budget, print media, website. This is a completely editable PowerPoint presentation and is available for immediate download. Download now and impress your audience.
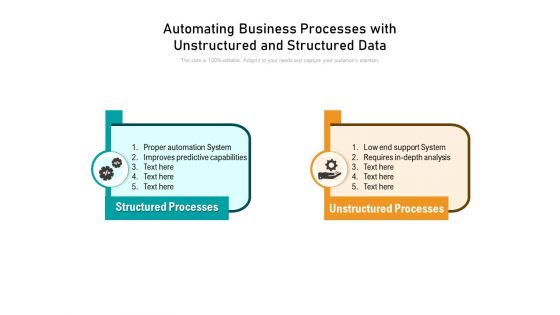
Automating Business Processes With Unstructured And Structured Data Ppt PowerPoint Presentation Styles Gridlines PDF
Presenting this set of slides with name automating business processes with unstructured and structured data ppt powerpoint presentation styles gridlines pdf. This is a two stage process. The stages in this process are proper automation system, improves predictive capabilities, low end support system, requires in depth analysis, structured processes, unstructured processes. This is a completely editable PowerPoint presentation and is available for immediate download. Download now and impress your audience.
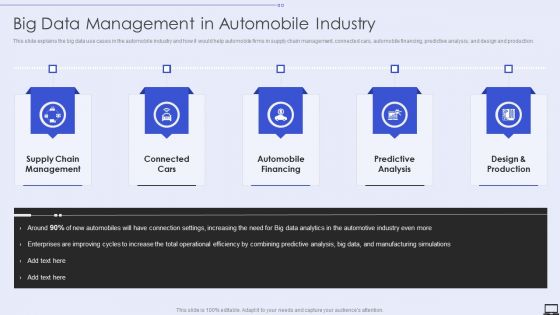
Big Data Management In Automobile Industry Ppt PowerPoint Presentation File Infographics PDF
Presenting Big Data Management In Automobile Industry Ppt PowerPoint Presentation File Infographics PDF to provide visual cues and insights. Share and navigate important information on five stages that need your due attention. This template can be used to pitch topics like Automobile Financing, Predictive Analysis, Supply Chain Management. In addtion, this PPT design contains high resolution images, graphics, etc, that are easily editable and available for immediate download.
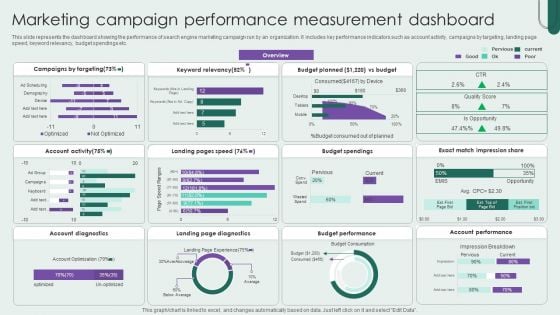
Marketing Campaign Performance Measurement Dashboard Download PDF
This slide represents the dashboard showing the performance of search engine marketing campaign run by an organization. It includes key performance indicators such as account activity, campaigns by targeting, landing page speed, keyword relevancy, budget spendings etc. Showcasing this set of slides titled Marketing Campaign Performance Measurement Dashboard Download PDF. The topics addressed in these templates are Keyword Relevancy, Campaigns By Targeting, Budget. All the content presented in this PPT design is completely editable. Download it and make adjustments in color, background, font etc. as per your unique business setting.
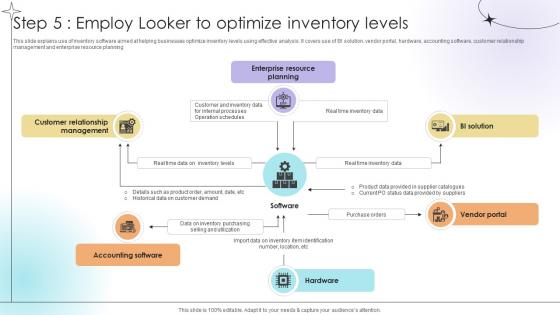
Step 5 Employ Looker To Optimize Inventory Levels Data Analytics SS V
This slide explains use of inventory software aimed at helping businesses optimize inventory levels using effective analysis. It covers use of BI solution, vendor portal, hardware, accounting software, customer relationship management and enterprise resource planning.This modern and well-arranged Step 5 Employ Looker To Optimize Inventory Levels Data Analytics SS V provides lots of creative possibilities. It is very simple to customize and edit with the Powerpoint Software. Just drag and drop your pictures into the shapes. All facets of this template can be edited with Powerpoint, no extra software is necessary. Add your own material, put your images in the places assigned for them, adjust the colors, and then you can show your slides to the world, with an animated slide included. This slide explains use of inventory software aimed at helping businesses optimize inventory levels using effective analysis. It covers use of BI solution, vendor portal, hardware, accounting software, customer relationship management and enterprise resource planning.
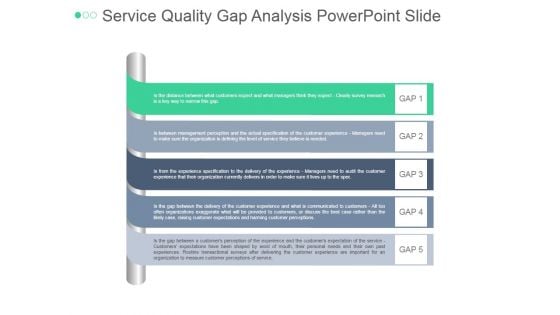
Service Quality Gap Analysis Ppt PowerPoint Presentation Visuals
This is a service quality gap analysis ppt powerpoint presentation visuals. This is a five stage process. The stages in this process are analysis, business, marketing, strategy, management, success.
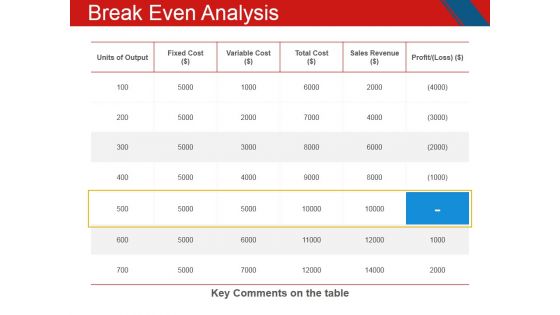
Break Even Analysis Ppt PowerPoint Presentation Inspiration Templates
This is a break even analysis ppt powerpoint presentation inspiration templates. This is a five stage process. The stages in this process are units of output, fixed cost, variable cost, total cost, sales revenue, profit.
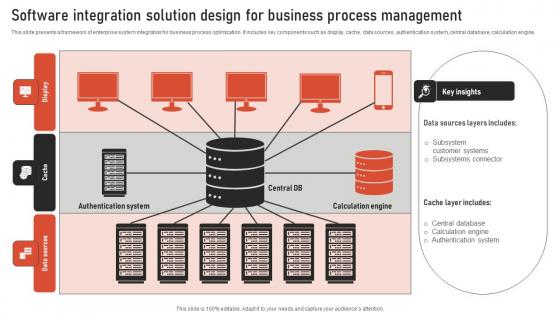
Software Integration Solution Design For Business Process Management Template Pdf
This slide presents a framework of enterprise system integration for business process optimization. It includes key components such as display, cache, data sources, authentication system, central database, calculation engine. Pitch your topic with ease and precision using this Software Integration Solution Design For Business Process Management Template Pdf. This layout presents information on Data Sources Layers, Authentication System, Calculation Engine. It is also available for immediate download and adjustment. So, changes can be made in the color, design, graphics or any other component to create a unique layout. This slide presents a framework of enterprise system integration for business process optimization. It includes key components such as display, cache, data sources, authentication system, central database, calculation engine.

Official Team Collaboration Plan Forecasting Program Impact On Organization Performance Background PDF
This slide provides detailed interpretation of statistics metrics provided in the previous slide highlighting the improvements in organization current human capital state. Deliver an awe-inspiring pitch with this creative official team collaboration plan forecasting program impact on organization performance background pdf bundle. Topics like forecasting program impact on organization performance can be discussed with this completely editable template. It is available for immediate download depending on the needs and requirements of the user.
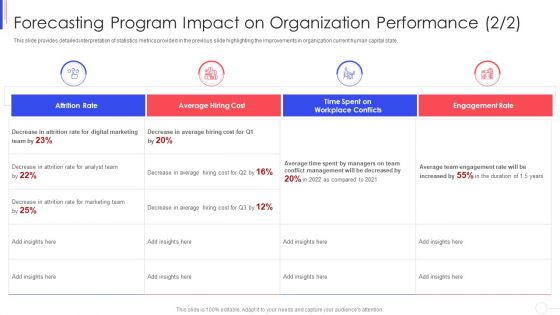
Strategy To Improve Team Proficiency Forecasting Program Impact On Organization Performance Digital Topics PDF
This slide provides detailed interpretation of statistics metrics provided in the previous slide highlighting the improvements in organization current human capital state. Deliver an awe inspiring pitch with this creative strategy to improve team proficiency forecasting program impact on organization performance digital topics pdf bundle. Topics like forecasting program impact on organization performance can be discussed with this completely editable template. It is available for immediate download depending on the needs and requirements of the user.
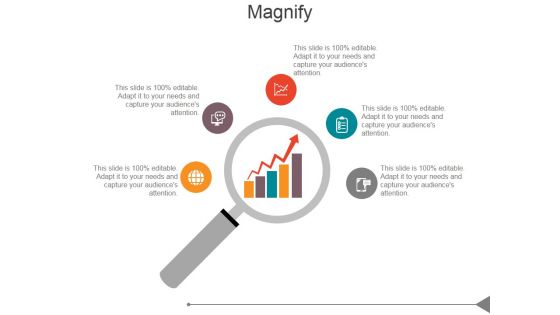
Magnify Ppt PowerPoint Presentation Inspiration
This is a magnify ppt powerpoint presentation inspiration. This is a five stage process. The stages in this process are technology, business, marketing, success, big data.
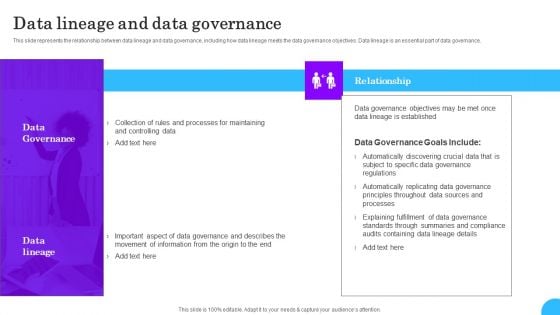
Comprehensive Analysis Of Different Data Lineage Classification Data Lineage And Data Governance Demonstration PDF
This slide represents the relationship between data lineage and data governance, including how data lineage meets the data governance objectives. Data lineage is an essential part of data governance. Slidegeeks is here to make your presentations a breeze with Comprehensive Analysis Of Different Data Lineage Classification Data Lineage And Data Governance Demonstration PDF With our easy to use and customizable templates, you can focus on delivering your ideas rather than worrying about formatting. With a variety of designs to choose from, you are sure to find one that suits your needs. And with animations and unique photos, illustrations, and fonts, you can make your presentation pop. So whether you are giving a sales pitch or presenting to the board, make sure to check out Slidegeeks first
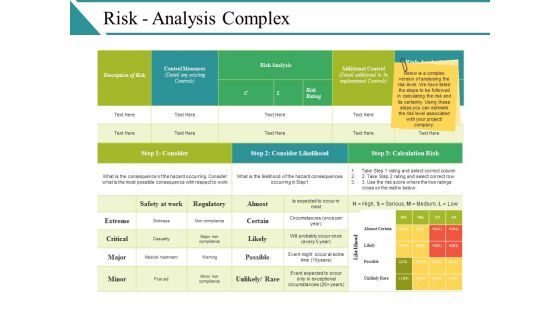
Risk Analysis Complex Ppt PowerPoint Presentation Styles Show
This is a risk analysis complex ppt powerpoint presentation styles show. This is a five stage process. The stages in this process are description of risk, risk analysis, extreme, critical, risk analysis.
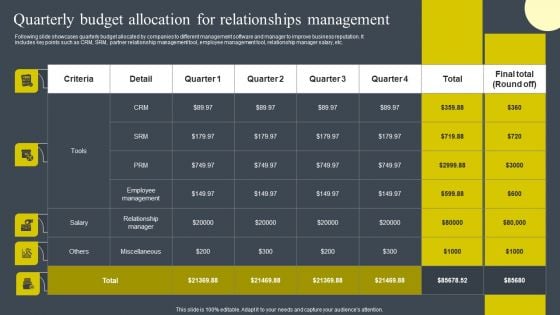
Quarterly Budget Allocation For Relationships Management Clipart PDF
Mentioned slide demonstrates impact of customer management solutions on business key performance indicators. It includes key performance indicators such as customer retention, loyal customer base, customer abandonment rate, customer satisfaction, etc. There are so many reasons you need a Quarterly Budget Allocation For Relationships Management Clipart PDF. The first reason is you can not spend time making everything from scratch, Thus, Slidegeeks has made presentation templates for you too. You can easily download these templates from our website easily.
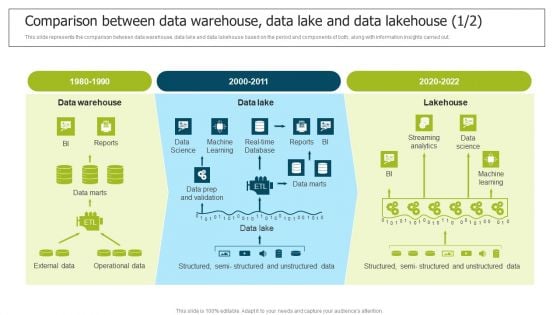
Data Lake Implementation Comparison Between Data Warehouse Data Lake And Data Infographics PDF
This slide represents the comparison between data warehouse, data lake and data lakehouse based on the period and components of both, along with information insights carried out. From laying roadmaps to briefing everything in detail, our templates are perfect for you. You can set the stage with your presentation slides. All you have to do is download these easy-to-edit and customizable templates. Data Lake Implementation Comparison Between Data Warehouse Data Lake And Data Infographics PDF will help you deliver an outstanding performance that everyone would remember and praise you for. Do download this presentation today.
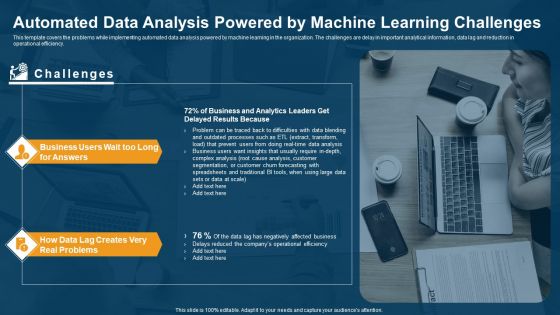
Data Interpretation And Analysis Playbook Automated Data Analysis Powered By Machine Learning Challenges Summary PDF
This template covers the problems while implementing automated data analysis powered by machine learning in the organization. The challenges are delay in important analytical information, data lag and reduction in operational efficiency. Presenting data interpretation and analysis playbook automated data analysis powered by machine learning challenges summary pdf to provide visual cues and insights. Share and navigate important information on two stages that need your due attention. This template can be used to pitch topics like operational, efficiency, business, analysis. In addtion, this PPT design contains high resolution images, graphics, etc, that are easily editable and available for immediate download.
Personal Data Visualization On Computer Screen Ppt PowerPoint Presentation Show Layout Ideas
Presenting this set of slides with name personal data visualization on computer screen ppt powerpoint presentation show layout ideas. This is a one stage process. The stages in this process are data visualization icon, research analysis, business focus. This is a completely editable PowerPoint presentation and is available for immediate download. Download now and impress your audience.
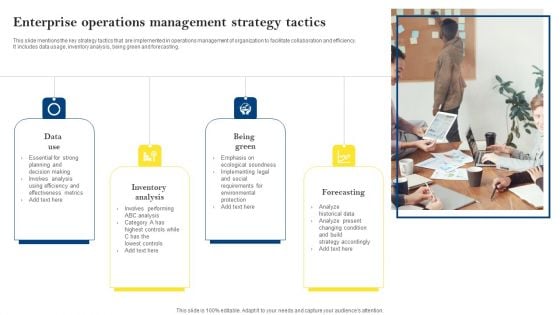
Enterprise Operations Management Strategy Tactics Portrait PDF
This slide mentions the key strategy tactics that are implemented in operations management of organization to facilitate collaboration and efficiency. It includes data usage, inventory analysis, being green and forecasting. Persuade your audience using this Enterprise Operations Management Strategy Tactics Portrait PDF. This PPT design covers four stages, thus making it a great tool to use. It also caters to a variety of topics including Inventory Analysis, Being Green, Forecasting. Download this PPT design now to present a convincing pitch that not only emphasizes the topic but also showcases your presentation skills.
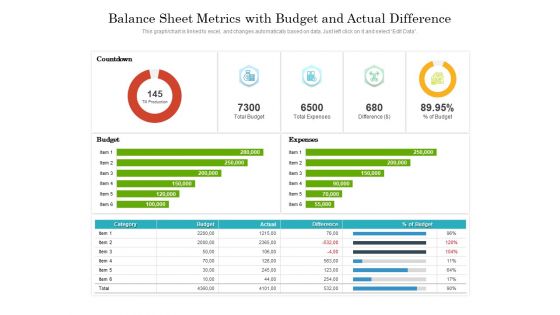
Balance Sheet Metrics With Budget And Actual Difference Ppt PowerPoint Presentation Summary Master Slide PDF
Presenting this set of slides with name balance sheet metrics with budget and actual difference ppt powerpoint presentation summary master slide pdf. The topics discussed in these slides are countdown, total budget, total expenses, difference. This is a completely editable PowerPoint presentation and is available for immediate download. Download now and impress your audience.
Real Estate Policy Support Ppt PowerPoint Presentation Background Images
This is a real estate policy support ppt powerpoint presentation background images. This is a one stage process. The stages in this process are policy support, business, technology, big data, communication.
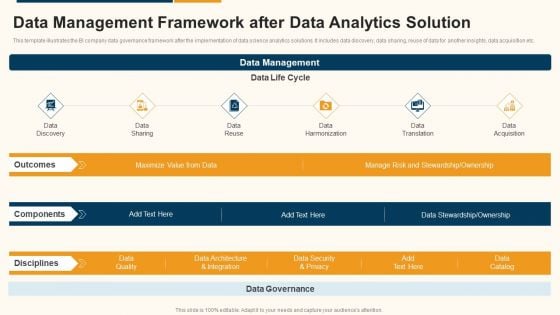
Data Interpretation And Analysis Playbook Data Management Framework After Data Analytics Solution Structure PDF
This template illustrates the BI company data governance framework after the implementation of data science analytics solutions. It includes data discovery, data sharing, reuse of data for another insights, data acquisition etc. This is a data interpretation and analysis playbook data management framework after data analytics solution structure pdf template with various stages. Focus and dispense information on six stages using this creative set, that comes with editable features. It contains large content boxes to add your information on topics like data discovery, data sharing, data reuse, data harmonization, data translation, data acquisition. You can also showcase facts, figures, and other relevant content using this PPT layout. Grab it now.
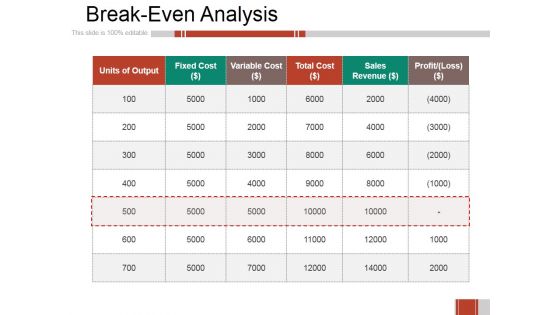
Breakeven Analysis Ppt PowerPoint Presentation Professional Design Templates
This is a breakeven analysis ppt powerpoint presentation professional design templates. This is a six stage process. The stages in this process are units of output, fixed cost, variable cost, total cost, sales revenue.
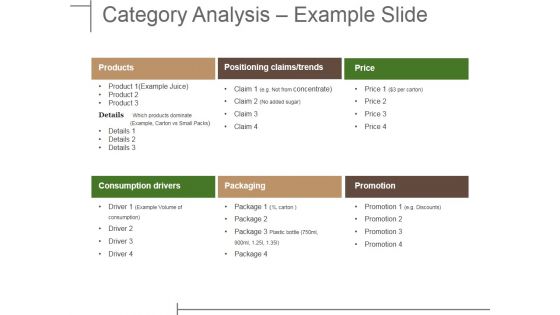
Category Analysis Example Slide Ppt PowerPoint Presentation Ideas Gridlines
This is a category analysis example slide ppt powerpoint presentation ideas gridlines. This is a six stage process. The stages in this process are products, positioning claims trends, price, consumption drivers, packaging, promotion.
Data Interpretation And Analysis Playbook Icons Slide For Data Interpretation And Analysis Playbook Designs PDF
Presenting our innovatively structured data interpretation and analysis playbook icons slide for data interpretation and analysis playbook designs pdf set of slides. The slides contain a hundred percent editable icons. You can replace these icons without any inconvenience. Therefore, pick this set of slides and create a striking presentation.
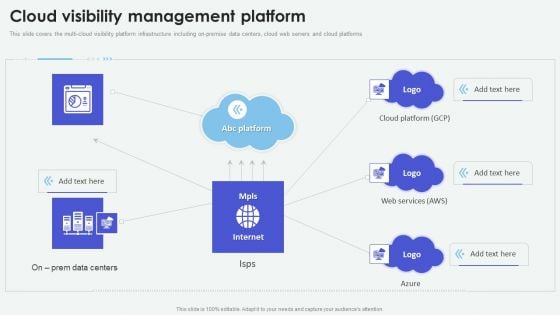
Cloud Based Computing Analysis Cloud Visibility Management Platform Professional PDF
This slide covers the multi-cloud visibility platform infrastructure including on-premise data centers, cloud web servers and cloud platforms. From laying roadmaps to briefing everything in detail, our templates are perfect for you. You can set the stage with your presentation slides. All you have to do is download these easy-to-edit and customizable templates. Cloud Based Computing Analysis Cloud Visibility Management Platform Professional PDF will help you deliver an outstanding performance that everyone would remember and praise you for. Do download this presentation today.
Magnifying Glass With Icons For Research Management Ppt PowerPoint Presentation Influencers
This is a magnifying glass with icons for research management ppt powerpoint presentation influencers. This is a one stage process. The stages in this process are magnifier, icons, search, business, analysis, strategy, success.

Data Lake Architecture Future Of Data Analysis Key Concepts Of Data Lake Architecture Professional PDF
This slide depicts the key concepts of data lake, including data ingestion, data exploration, data lineage, data storage, data auditing, data discovery, data quality and so on.Presenting Data Lake Architecture Future Of Data Analysis Key Concepts Of Data Lake Architecture Professional PDF to provide visual cues and insights. Share and navigate important information on ten stages that need your due attention. This template can be used to pitch topics like Data Ingestion, Data Exploration, Data Lineage. In addtion, this PPT design contains high resolution images, graphics, etc, that are easily editable and available for immediate download.
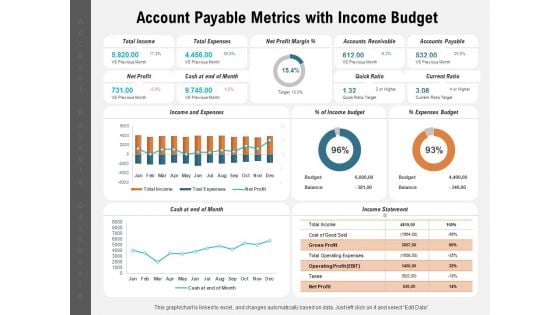
Account Payable Metrics With Income Budget Ppt PowerPoint Presentation Layouts Master Slide PDF
Presenting this set of slides with name account payable metrics with income budget ppt powerpoint presentation layouts master slide pdf. The topics discussed in these slides are total income, total expenses, net profit margin, accounts receivable, accounts payable, net profit, cash at end of month, quick ratio, current ratio, expenses budget, income budget, cash at end of month. This is a completely editable PowerPoint presentation and is available for immediate download. Download now and impress your audience.
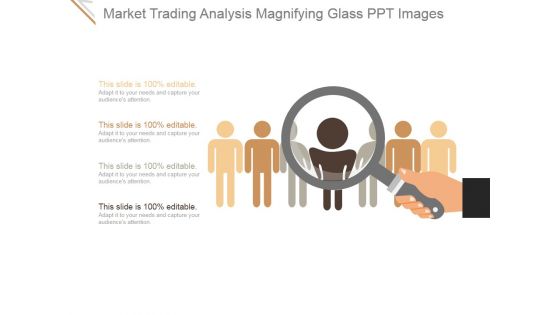
Market Trading Analysis Magnifying Glass Ppt PowerPoint Presentation Templates
This is a market trading analysis magnifying glass ppt powerpoint presentation templates. This is a four stage process. The stages in this process are analysis, market, management, search, magnifying glass.
Percentage Variations Showing Performance Analysis Ppt PowerPoint Presentation Icon
This is a percentage variations showing performance analysis ppt powerpoint presentation icon. This is a four stage process. The stages in this process are percentage, analysis, performance, management, strategy.
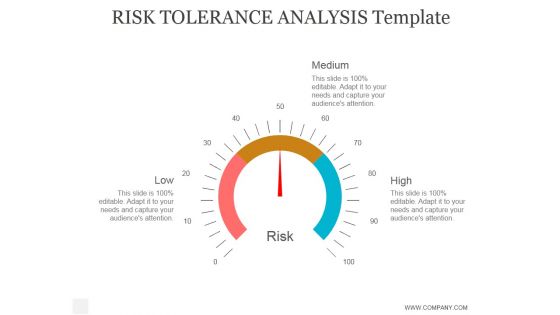
Risk Tolerance Analysis Template Ppt PowerPoint Presentation Example
This is a risk tolerance analysis template ppt powerpoint presentation example. This is a four stage process. The stages in this process are business, strategy, marketing, analysis, success, arrow.
Product Support Service Organizational Model Icons PDF
This slide presents a business model of product support to achieve and maintain customer satisfaction. It includes elements like warfighter, product support arrangement, product support integrators and product support providers. Showcasing this set of slides titled Product Support Service Organizational Model Icons PDF. The topics addressed in these templates are Performance, Data And Metrics, Commercial And Government, Responsibility. All the content presented in this PPT design is completely editable. Download it and make adjustments in color, background, font etc. as per your unique business setting.
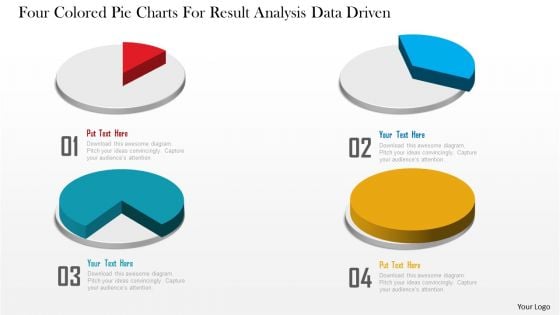
Business Diagram Four Colored Pie Charts For Result Analysis Data Driven PowerPoint Slide
This business diagram displays graphic of pie charts. This business slide is suitable to present and compare business data. Use this diagram to build professional presentations for your viewers.
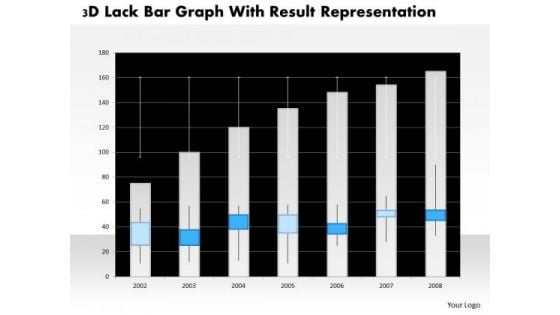
Business Diagram 3d Lack Bar Graph With Result Representation PowerPoint Slide
This business diagram has graphic of 3d lack bar graph. This diagram is a data visualization tool that gives you a simple way to present statistical information. This slide helps your audience examine and interpret the data you present.
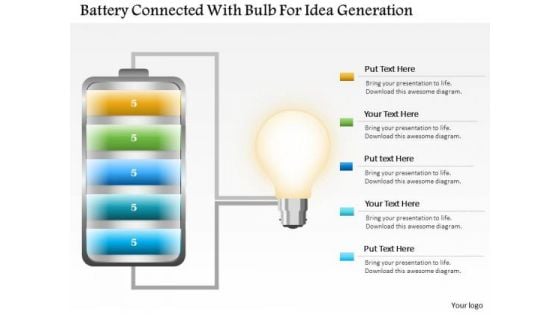
Business Diagram Battery Connected With Bulb For Idea Generation PowerPoint Slide
This business slide displays battery icon connected with bulb. This diagram is a data visualization tool that gives you a simple way to present statistical information. This slide helps your audience examine and interpret the data you present.
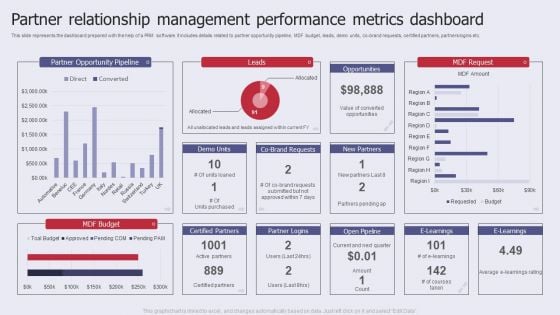
Partner Relationship Management Performance Metrics Dashboard Pictures PDF
This slide represents the dashboard prepared with the help of a PRM software. It includes details related to partner opportunity pipeline, MDF budget, leads, demo units, co brand requests, certified partners, partners logins etc. Showcasing this set of slides titled Partner Relationship Management Performance Metrics Dashboard Pictures PDF. The topics addressed in these templates are Partner Opportunity Pipeline, MDF Budget, Performance Metrics Dashboard. All the content presented in this PPT design is completely editable. Download it and make adjustments in color, background, font etc. as per your unique business setting.
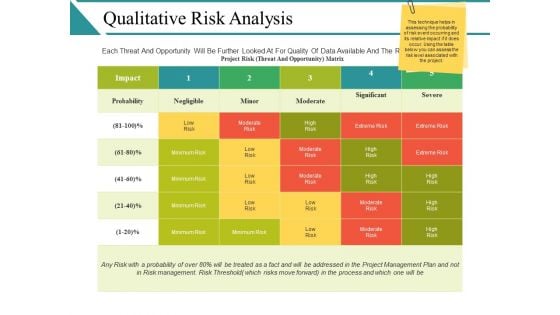
Qualitative Risk Analysis Ppt PowerPoint Presentation Infographics Show
This is a qualitative risk analysis ppt powerpoint presentation infographics show. This is a five stage process. The stages in this process are probability, negligible, minor, moderate, significant.
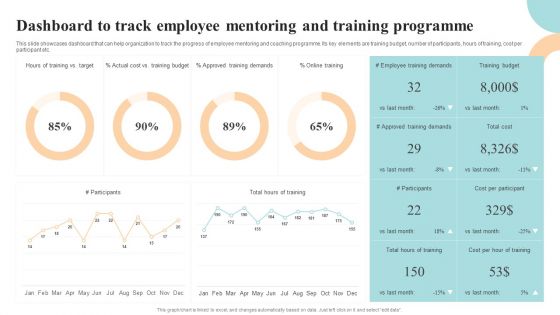
Workforce Growth And Improvement Dashboard To Track Employee Mentoring Guidelines PDF
This slide showcases dashboard that can help organization to track the progress of employee mentoring and coaching programme. Its key elements are training budget, number of participants, hours of training, cost per participant etc. Crafting an eye-catching presentation has never been more straightforward. Let your presentation shine with this tasteful yet straightforward Workforce Growth And Improvement Dashboard To Track Employee Mentoring Guidelines PDF template. It offers a minimalistic and classy look that is great for making a statement. The colors have been employed intelligently to add a bit of playfulness while still remaining professional. Construct the ideal Workforce Growth And Improvement Dashboard To Track Employee Mentoring Guidelines PDF that effortlessly grabs the attention of your audience Begin now and be certain to wow your customers.
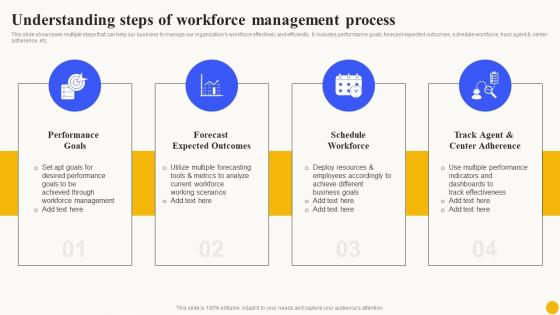
Understanding Steps Of Workforce Planned Workforce Enhancement Infographics Pdf
This slide showcases multiple steps that can help our business to manage our organizations workforce effectively and efficiently. It includes performance goals, forecast expected outcomes, schedule workforce, track agent and center adherence, etc.The Understanding Steps Of Workforce Planned Workforce Enhancement Infographics Pdf is a compilation of the most recent design trends as a series of slides. It is suitable for any subject or industry presentation, containing attractive visuals and photo spots for businesses to clearly express their messages. This template contains a variety of slides for the user to input data, such as structures to contrast two elements, bullet points, and slides for written information. Slidegeeks is prepared to create an impression. This slide showcases multiple steps that can help our business to manage our organizations workforce effectively and efficiently. It includes performance goals, forecast expected outcomes, schedule workforce, track agent and center adherence, etc.

Industry Snapshot Of Global Hospitality Industry Report Lodging And Accommodation Industry IR SS V
This slide represents the industry snapshot of hospitality industry which includes various components such as base year, forecast period, CAGR, fastest growing market, report coverage, key companies profiled, etc. The Industry Snapshot Of Global Hospitality Industry Report Lodging And Accommodation Industry IR SS V is a compilation of the most recent design trends as a series of slides. It is suitable for any subject or industry presentation, containing attractive visuals and photo spots for businesses to clearly express their messages. This template contains a variety of slides for the user to input data, such as structures to contrast two elements, bullet points, and slides for written information. Slidegeeks is prepared to create an impression. This slide represents the industry snapshot of hospitality industry which includes various components such as base year, forecast period, CAGR, fastest growing market, report coverage, key companies profiled, etc.
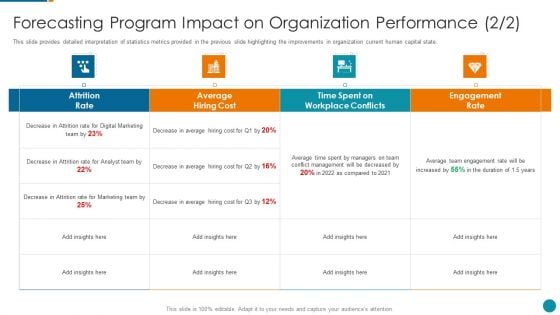
Strategic Procedure To Improve Employee Efficiency Forecasting Program Impact On Sample PDF
This slide provides detailed interpretation of statistics metrics provided in the previous slide highlighting the improvements in organization current human capital state.Deliver and pitch your topic in the best possible manner with this strategic procedure to improve employee efficiency forecasting program impact on sample pdf Use them to share invaluable insights on attrition rate, average hiring cost, workplace conflicts and impress your audience. This template can be altered and modified as per your expectations. So, grab it now.
IT Security Analysis Icon With Magnifying Glass Introduction PDF
Presenting IT Security Analysis Icon With Magnifying Glass Introduction PDF to dispense important information. This template comprises three stages. It also presents valuable insights into the topics including IT Security Analysis Icon, Magnifying Glass. This is a completely customizable PowerPoint theme that can be put to use immediately. So, download it and address the topic impactfully.
Macro Environmental Level Threat Detection And Analysis Icon Demonstration PDF
Presenting Macro Environmental Level Threat Detection And Analysis Icon Demonstration PDF to dispense important information. This template comprises three stages. It also presents valuable insights into the topics including Macro Environmental, Level Threat, Detection And Analysis. This is a completely customizable PowerPoint theme that can be put to use immediately. So, download it and address the topic impactfully.
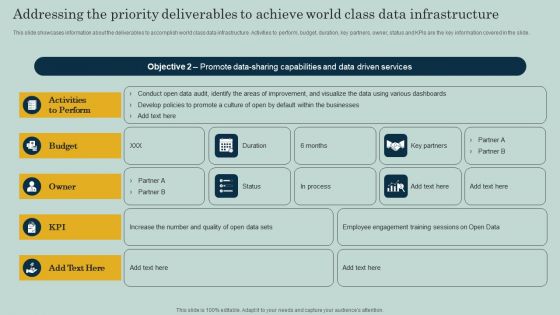
Addressing The Priority Deliverables To Achieve World Class Data Infrastructure Ppt Infographics Smartart PDF
This slide showcases information about the deliverables to accomplish world class data infrastructure. Activities to perform, budget, duration, key partners, owner, status and KPIs are the key information covered in the slide. There are so many reasons you need a Addressing The Priority Deliverables To Achieve World Class Data Infrastructure Ppt Infographics Smartart PDF. The first reason is you cannot spend time making everything from scratch, Thus, Slidegeeks has made presentation templates for you too. You can easily download these templates from our website easily.
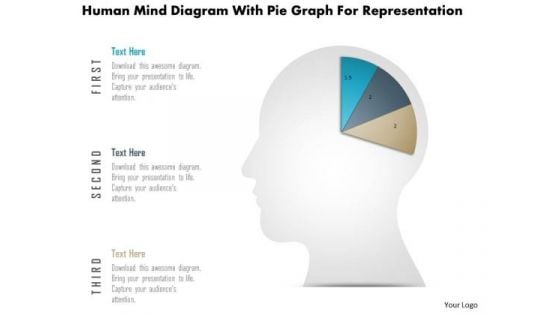
Business Diagram Human Mind Diagram With Pie Graph For Representation PowerPoint Slide
This diagram displays human face graphic divided into sections. This section can be used for data display. Use this diagram to build professional presentations for your viewers.

Business Diagram Six Staged Pie Charts For Text Representation PowerPoint Slide
This slide displays graphic six staged pie charts. Download this diagram to present and compare business data. Use this diagram to display business process workflows in any presentation.
Business Diagram Three Text Boxes For Timer For Time Management PowerPoint Slide
This business diagram displays three text boxes. This diagram contains text boxes for data representation. Use this diagram to display business process workflows in any presentations.
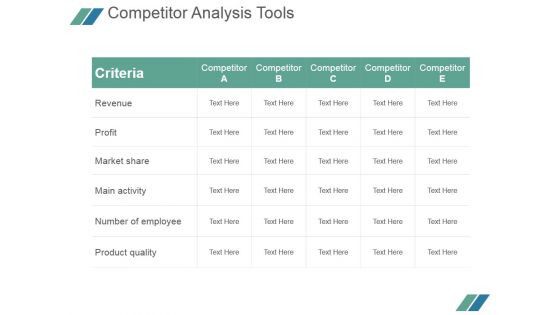
Competitor Analysis Tools Ppt PowerPoint Presentation Example File
This is a competitor analysis tools ppt powerpoint presentation example file. This is a five stage process. The stages in this process are criteria, revenue, profit, market share, main activity, number of employee, product quality.

Business And Financial Analysis Ppt PowerPoint Presentation Inspiration Design Templates
This is a business and financial analysis ppt powerpoint presentation inspiration design templates. This is a eight stage process. The stages in this process are investment, equipment, land cost, interior cost, employee cost.
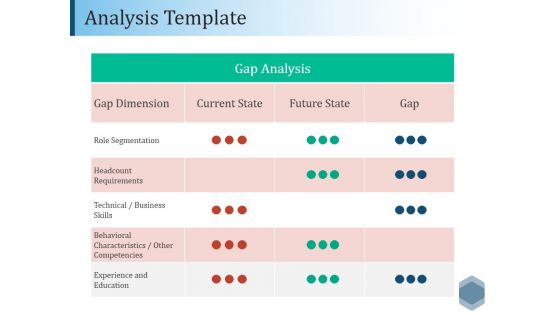
Analysis Template Ppt PowerPoint Presentation Gallery Visual Aids
This is a analysis template ppt powerpoint presentation gallery visual aids. This is a four stage process. The stages in this process are gap dimension, current state, future state, gap.
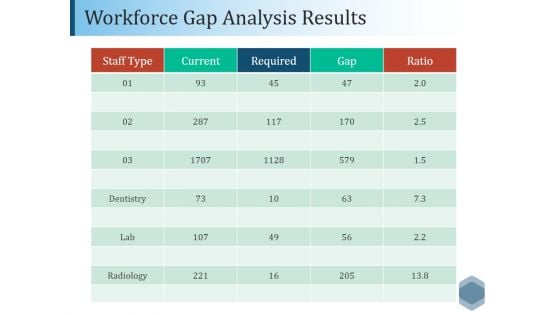
Workforce Gap Analysis Results Ppt PowerPoint Presentation Show Clipart
This is a workforce gap analysis results ppt powerpoint presentation show clipart. This is a five stage process. The stages in this process are staff type, current, required, gap, ratio.
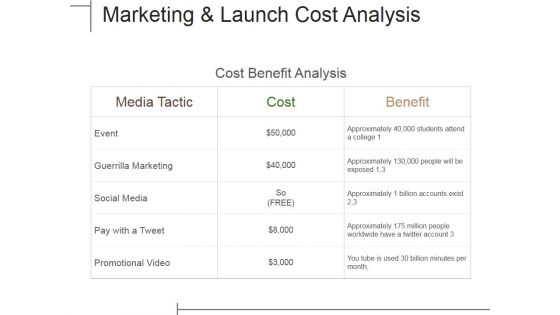
Marketing And Launch Cost Analysis Ppt PowerPoint Presentation Portfolio Good
This is a marketing and launch cost analysis ppt powerpoint presentation portfolio good. This is a three stage process. The stages in this process are media tactic, cost, benefit, event, guerrilla marketing.
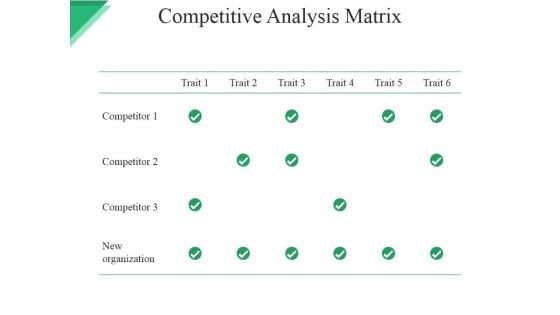
Competitive Analysis Matrix Ppt PowerPoint Presentation Model Deck
This is a competitive analysis matrix ppt powerpoint presentation model deck. This is a six stage process. The stages in this process are new organization, table, business, marketing, strategy.
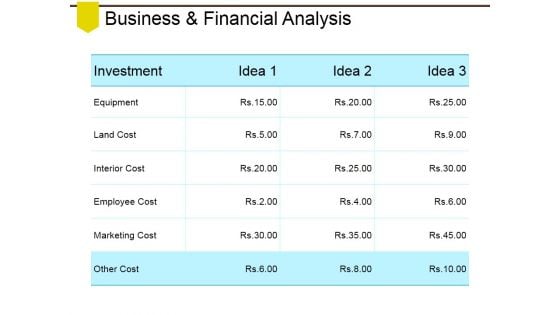
Business And Financial Analysis Ppt PowerPoint Presentation Layouts Portrait
This is a business and financial analysis ppt powerpoint presentation layouts portrait. This is a three stage process. The stages in this process are equipment, land cost, interior cost, employee cost, marketing cost.

Marketing And Launch Cost Analysis Ppt PowerPoint Presentation Gallery Slides
This is a marketing and launch cost analysis ppt powerpoint presentation gallery slides. This is a six stage process. The stages in this process are media tactic, event, guerrilla marketing, social media, pay with a tweet.
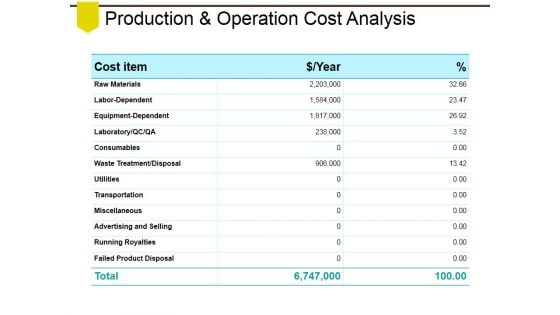
Production And Operation Cost Analysis Ppt PowerPoint Presentation Show Smartart
This is a production and operation cost analysis ppt powerpoint presentation show smartart. This is a three stage process. The stages in this process are raw materials, labor dependent, equipment dependent, consumables, utilities.
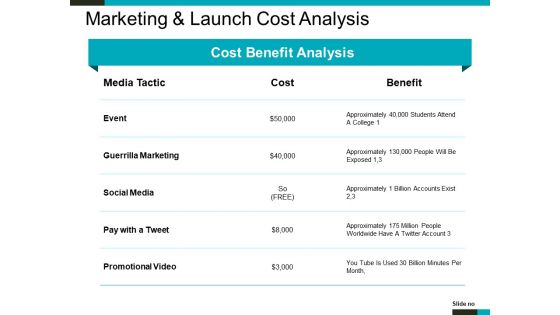
Marketing And Launch Cost Analysis Ppt PowerPoint Presentation Portfolio Structure
This is a marketing and launch cost analysis ppt powerpoint presentation portfolio structure. This is a three stage process. The stages in this process are event, guerrilla marketing, social media, pay with a tweet, promotional video.
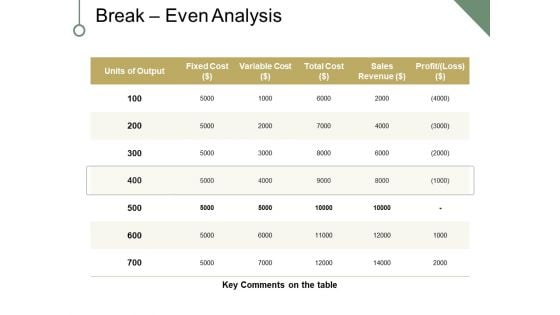
Break Even Analysis Ppt PowerPoint Presentation Portfolio Clipart
This is a break even analysis ppt powerpoint presentation portfolio clipart. This is a five stage process. The stages in this process are fixed cost, variable cost, sales revenue, profit, key comments on the table, units of output.
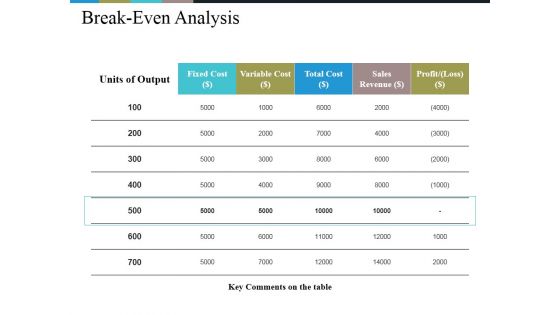
Break Even Analysis Ppt PowerPoint Presentation Styles Template
This is a break even analysis ppt powerpoint presentation styles template. This is a five stage process. The stages in this process are fixed cost, variable cost, key comments on the table, units of output, business.
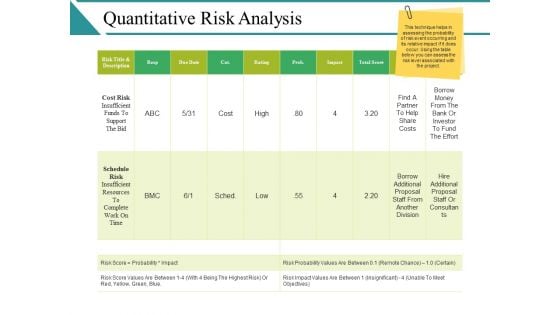
Quantitative Risk Analysis Ppt PowerPoint Presentation Model Influencers
This is a quantitative risk analysis ppt powerpoint presentation model influencers. This is a ten stage process. The stages in this process are cost risk, insufficient funds to support the bid, schedule risk, insufficient resources to complete work on time.


 Continue with Email

 Home
Home


