Project Kpi
Four Stages Of Shipment Services Planning Background PDF
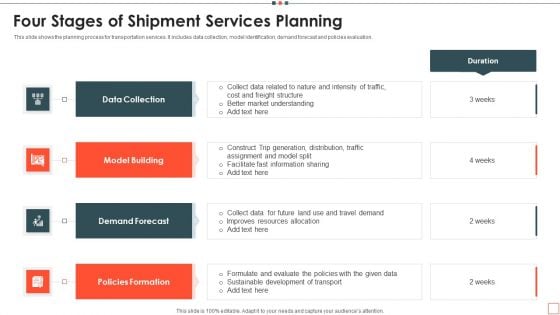
This slide shows the planning process for transportation services. It includes data collection, model identification, demand forecast and policies evaluation. Presenting Four Stages Of Shipment Services Planning Background PDF to dispense important information. This template comprises four stages. It also presents valuable insights into the topics including Model Building, Policies Formation, Data Collection. This is a completely customizable PowerPoint theme that can be put to use immediately. So, download it and address the topic impactfully.
Magnifying Glass For Performance Analysis Ppt PowerPoint Presentation Slides
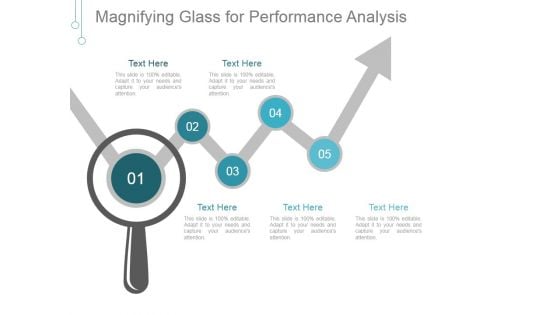
This is a magnifying glass for performance analysis ppt powerpoint presentation slides. This is a five stage process. The stages in this process are magnifying glass, arrows, management, marketing, business.
Product Service Pricing Analysis Ppt PowerPoint Presentation Styles Graphics Example
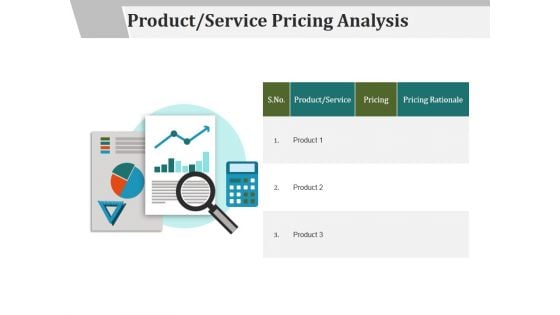
This is a product service pricing analysis ppt powerpoint presentation styles graphics example. This is a one stage process. The stages in this process are product service, pricing, pricing rationale.
Business Research And Analysis Ppt PowerPoint Presentation Ideas Graphics Design
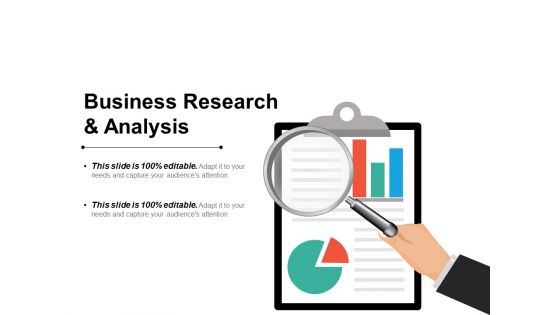
This is a business research and analysis ppt powerpoint presentation ideas graphics design. This is a three stage process. The stages in this process are support, assistance, hand holding.
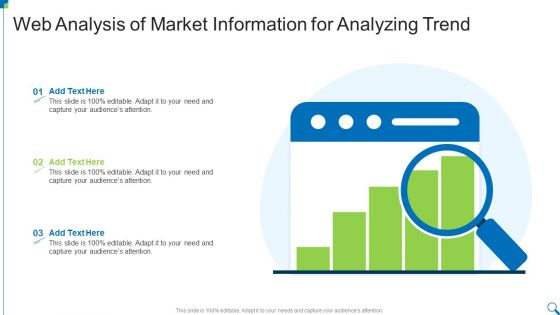
Web Analysis Of Market Information For Analyzing Trend Download PDF
Persuade your audience using this Web Analysis Of Market Information For Analyzing Trend Download PDF This PPT design covers three stages, thus making it a great tool to use. It also caters to a variety of topics including Web Analysis, Market Information, Analyzing Trend Download this PPT design now to present a convincing pitch that not only emphasizes the topic but also showcases your presentation skills.
Marketing Survey Analysis For Understanding Target Market Inspiration PDF
Persuade your audience using this Marketing Survey Analysis For Understanding Target Market Inspiration PDF. This PPT design covers three stages, thus making it a great tool to use. It also caters to a variety of topics including Marketing Survey Analysis, Understanding Target Market. Download this PPT design now to present a convincing pitch that not only emphasizes the topic but also showcases your presentation skills.
Staff Skills Analysis To Identify Gaps Icon Infographics PDF
Persuade your audience using this Staff Skills Analysis To Identify Gaps Icon Infographics PDF. This PPT design covers Three stages, thus making it a great tool to use. It also caters to a variety of topics including Staff Skills Analysis, To Identify Gaps. Download this PPT design now to present a convincing pitch that not only emphasizes the topic but also showcases your presentation skills.
Price Level Mapping Icon Showcasing Competitive Analysis Guidelines PDF
Persuade your audience using this Price Level Mapping Icon Showcasing Competitive Analysis Guidelines PDF. This PPT design covers four stages, thus making it a great tool to use. It also caters to a variety of topics including Price Level Mapping, Showcasing Competitive Analysis. Download this PPT design now to present a convincing pitch that not only emphasizes the topic but also showcases your presentation skills.
Business Diagram Battery Icon With Power Icons Energy Technology PowerPoint Slide
This business diagram displays battery icon with power charging. Use this diagram, in your presentations to display energy saving, battery and technology. Create professional presentations using this diagram slide.
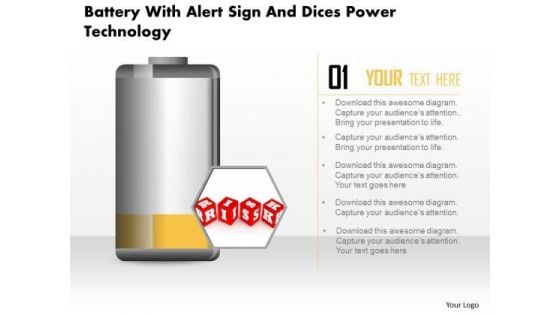
Business Diagram Battery With Alert Sign And Dices Power Technology PowerPoint Slide
This business diagram displays risk alert on battery icon. Use this diagram, in your presentations to display energy saving, battery and technology. Create professional presentations using this diagram slide.
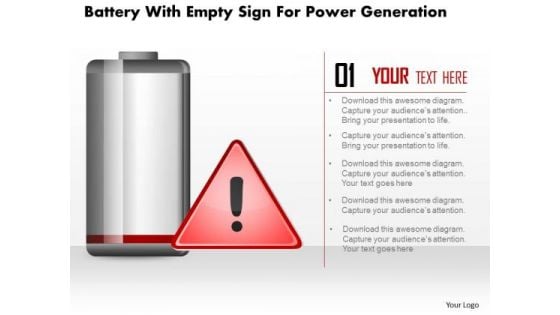
Business Diagram Battery With Empty Sign For Power Generation PowerPoint Slide
This business diagram displays empty sign alert on battery icon. Use this diagram, in your presentations to display energy saving, battery and technology. Create professional presentations using this diagram slide.
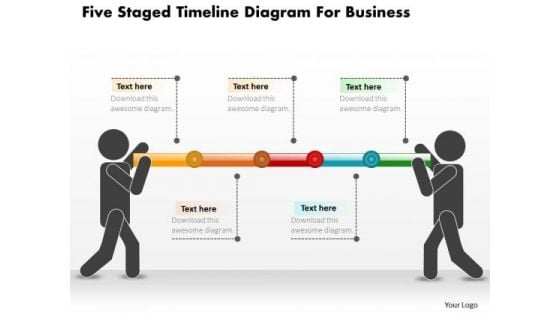
Business Diagram Five Staged Timeline Diagram For Business PowerPoint Slide
This PowerPoint template displays five points timeline diagram. This business diagram has been designed with graphic of timeline with five points, text space and start, end points. Use this diagram, in your presentations to display process steps, stages, timelines and business management. Make wonderful presentations using this business slide.
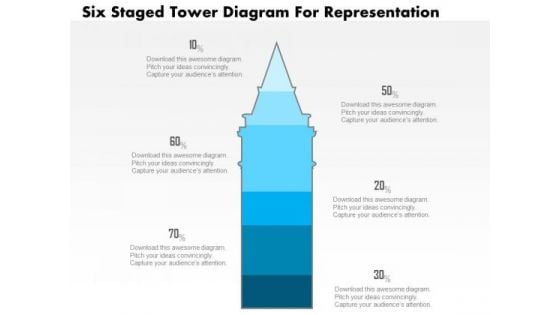
Business Diagram Five Staged Tower Diagram For Representation PowerPoint Slide
This business slide displays five staged tower diagram. It contains blue tower graphic divided into five parts. This diagram slide depicts processes, stages, steps, points, options information display. Use this diagram, in your presentations to express your views innovatively.
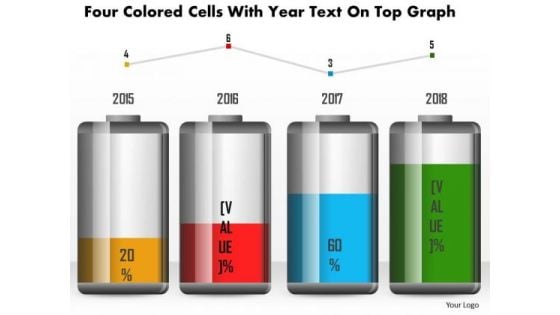
Business Diagram Four Colored Cells With Year Text On Top Graph PowerPoint Slide
This business diagram has been designed with battery cell graphic for business timeline. This slide can be used for business planning and management. Use this diagram for your business and success milestones related presentations.
Business Diagram Green Battery Cell With Full Charging Symbol PowerPoint Slide
This business diagram displays full battery charge icon. Use this diagram, in your presentations to display energy saving, battery and technology. Create professional presentations using this diagram slide.
Business Diagram Hour Glass With 3d Man And Icons PowerPoint Slide
This diagram displays 3d man with hour glass and icons. This diagram contains concept of communication and technology. Use this diagram to display business process workflows in any presentations.
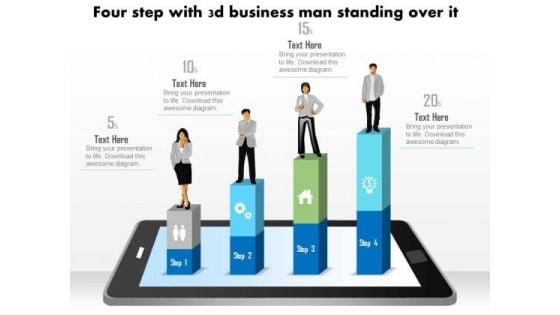
Business Diagram Four Steps With 3d Business Person Standing Over It PowerPoint Slide
This business diagram displays bar graph with business person standing on it. This Power Point template has been designed to display personal growth. You may use this diagram to impart professional appearance to your presentations.
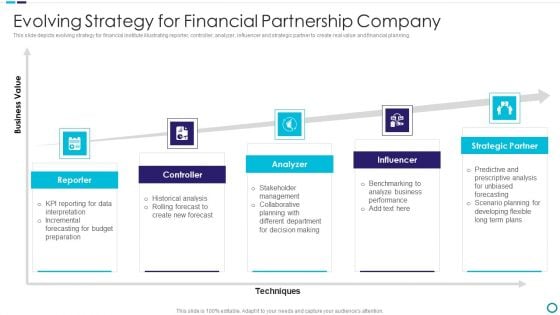
Evolving Strategy For Financial Partnership Company Rules PDF
This slide depicts evolving strategy for financial institute illustrating reporter, controller, analyzer, influencer and strategic partner to create real value and financial planning.Presenting Evolving Strategy For Financial Partnership Company Rules PDF to dispense important information. This template comprises five stages. It also presents valuable insights into the topics including Historical Analysis, Reporting For Data Interpretation, Forecasting For Budget Preparation This is a completely customizable PowerPoint theme that can be put to use immediately. So, download it and address the topic impactfully.
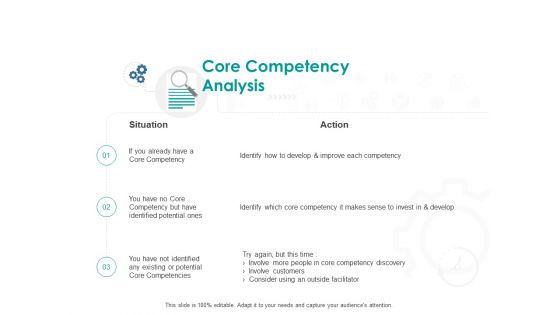
Core Competency Analysis Action Ppt PowerPoint Presentation Infographics Background
Presenting this set of slides with name core competency analysis action ppt powerpoint presentation infographics background. This is a three stage process. The stages in this process are business, management, planning, strategy, marketing. This is a completely editable PowerPoint presentation and is available for immediate download. Download now and impress your audience.
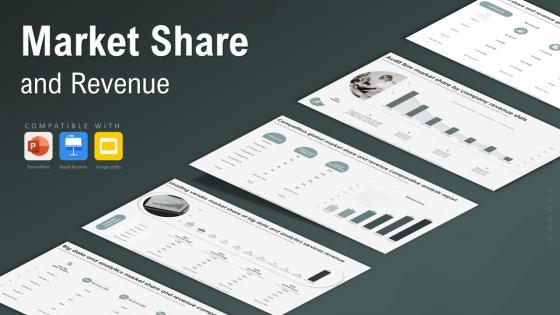
Market Share And Revenue Powerpoint Ppt
This Market Share And Revenue Powerpoint Ppt is designed to help you retain your audiences attention. This content-ready PowerPoint Template enables you to take your audience on a journey and share information in a way that is easier to recall. It helps you highlight the crucial parts of your work so that the audience does not get saddled with information download. This Market Share And Revenue From Sales, Big Data Market Share, Competitors Market Share, Unit Market And Revenue Share-slide PPT Deck comes prepared with the graphs and charts you could need to showcase your information through visuals. You only need to enter your own data in them. Download this editable PowerPoint Theme and walk into that meeting with confidence. The Market Share and Revenue PowerPoint PPT is a dynamic presentation template designed to analyze and showcase a companys market performance. It features visually appealing slides covering market share trends, revenue growth comparisons, and competitive analysis. This template includes charts, graphs, and infographics to clearly communicate key metrics and business insights. Ideal for business analysts, marketing professionals, and executives, it enables users to highlight strategic achievements, performance benchmarks, and growth opportunities effectively.
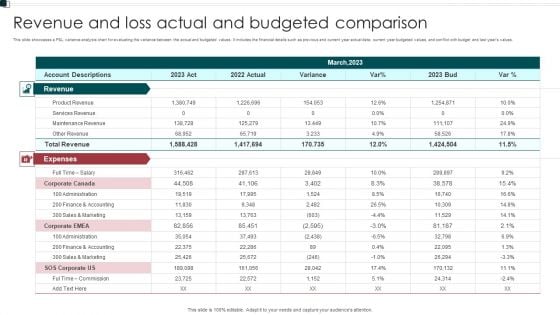
Revenue And Loss Actual And Budgeted Comparison Elements PDF
This slide showcases a P and L variance analysis chart for evaluating the variance between the actual and budgeted values. It includes the financial details such as previous and current year actual data current year budgeted values, and conflict with budget and last years values. Showcasing this set of slides titled Revenue And Loss Actual And Budgeted Comparison Elements PDF. The topics addressed in these templates are Expenses, Administration, Commission. All the content presented in this PPT design is completely editable. Download it and make adjustments in color, background, font etc. as per your unique business setting.
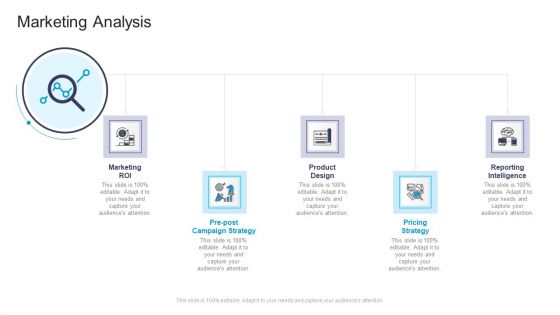
Marketing Analysis Commercial Marketing Guidelines And Tactics Infographics PDF
Presenting marketing analysis commercial marketing guidelines and tactics infographics pdf to provide visual cues and insights. Share and navigate important information on five stages that need your due attention. This template can be used to pitch topics like marketing roi, pre post campaign strategy, product design, pricing strategy, reporting intelligence. In addtion, this PPT design contains high resolution images, graphics, etc, that are easily editable and available for immediate download.
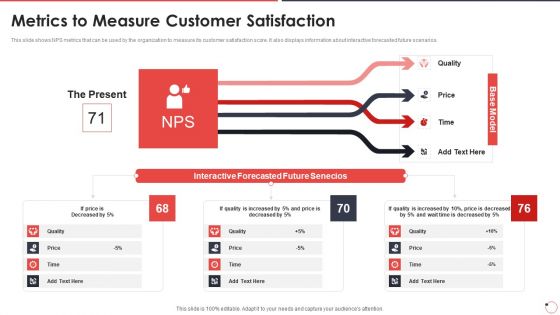
Quality Assurance Templates Set 1 Metrics To Measure Customer Satisfaction Ppt Infographic Template Vector PDF
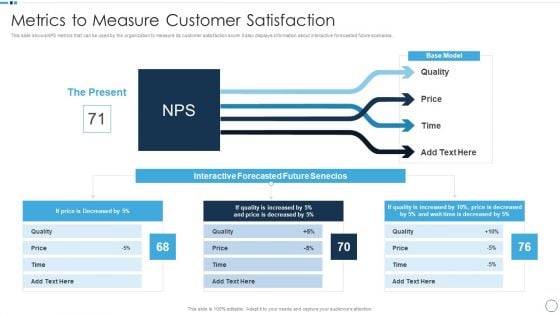
QA Plan Set 1 Metrics To Measure Customer Satisfaction Designs PDF
This slide shows NPS metrics that can be used by the organization to measure its customer satisfaction score. It also displays information about interactive forecasted future scenarios. Deliver and pitch your topic in the best possible manner with this QA Plan Set 1 Metrics To Measure Customer Satisfaction Designs PDF. Use them to share invaluable insights on Price, Quality, Measure Customer and impress your audience. This template can be altered and modified as per your expectations. So, grab it now.
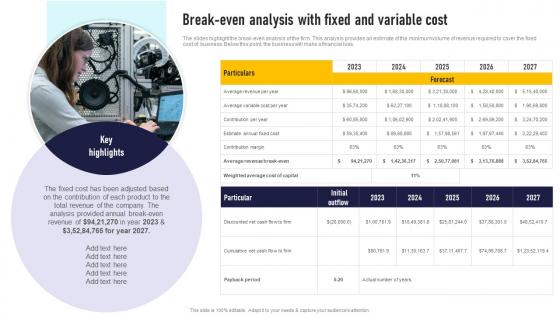
Break Even Analysis With Fixed And Variable Cost Auto Dealership Business Plan Guidelines Pdf
The slides highlight the break-even analysis of the firm. This analysis provides an estimate of the minimum volume of revenue required to cover the fixed cost of business. Below this point, the business will make a financial loss. The Break Even Analysis With Fixed And Variable Cost Auto Dealership Business Plan Guidelines Pdf is a compilation of the most recent design trends as a series of slides. It is suitable for any subject or industry presentation, containing attractive visuals and photo spots for businesses to clearly express their messages. This template contains a variety of slides for the user to input data, such as structures to contrast two elements, bullet points, and slides for written information. Slidegeeks is prepared to create an impression. The slides highlight the break-even analysis of the firm. This analysis provides an estimate of the minimum volume of revenue required to cover the fixed cost of business. Below this point, the business will make a financial loss.
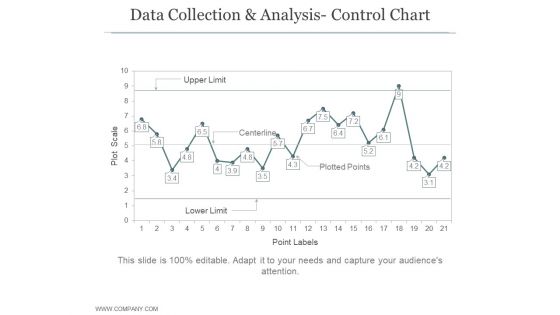
Data Collection And Analysis Control Chart Ppt PowerPoint Presentation Example File
This is a data collection and analysis control chart ppt powerpoint presentation example file. This is a four stage process. The stages in this process are business, strategy, marketing, bar graph, growth strategy.
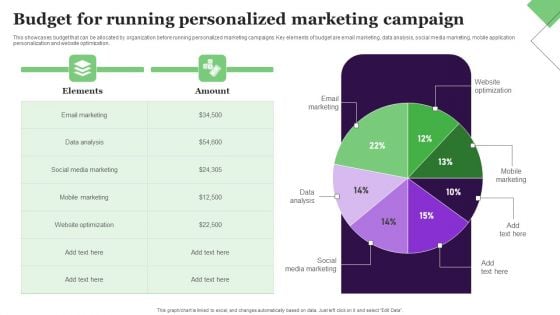
Budget For Running Personalized Marketing Campaign Portrait PDF
This showcases budget that can be allocated by organization before running personalized marketing campaigns. Key elements of budget are email marketing, data analysis, social media marketing, mobile application personalization and website optimization. Find a pre-designed and impeccable Budget For Running Personalized Marketing Campaign Portrait PDF. The templates can ace your presentation without additional effort. You can download these easy-to-edit presentation templates to make your presentation stand out from others. So, what are you waiting for Download the template from Slidegeeks today and give a unique touch to your presentation.
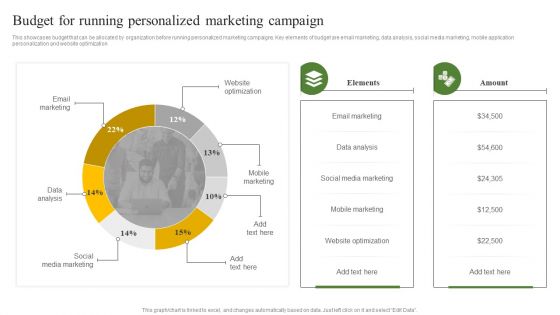
Budget For Running Personalized Marketing Campaign Ppt Infographics Images PDF
This showcases budget that can be allocated by organization before running personalized marketing campaigns. Key elements of budget are email marketing, data analysis, social media marketing, mobile application personalization and website optimization. This Budget For Running Personalized Marketing Campaign Ppt Infographics Images PDF is perfect for any presentation, be it in front of clients or colleagues. It is a versatile and stylish solution for organizing your meetings. The product features a modern design for your presentation meetings. The adjustable and customizable slides provide unlimited possibilities for acing up your presentation. Slidegeeks has done all the homework before launching the product for you. So, do not wait, grab the presentation templates today
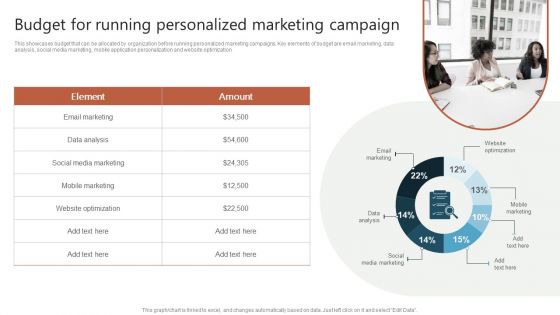
Budget For Running Personalized Marketing Campaign Ppt Portfolio Visuals PDF
This showcases budget that can be allocated by organization before running personalized marketing campaigns. Key elements of budget are email marketing, data analysis, social media marketing, mobile application personalization and website optimization. This Budget For Running Personalized Marketing Campaign Ppt Portfolio Visuals PDF is perfect for any presentation, be it in front of clients or colleagues. It is a versatile and stylish solution for organizing your meetings. The product features a modern design for your presentation meetings. The adjustable and customizable slides provide unlimited possibilities for acing up your presentation. Slidegeeks has done all the homework before launching the product for you. So, do not wait, grab the presentation templates today

Human Resources Planning Development Methods Ppt PowerPoint Presentation Complete Deck With Slides
This is a human resources planning development methods ppt powerpoint presentation complete deck with slides. This is a one stage process. The stages in this process are finance, data analysis, graph representation, planning, process.
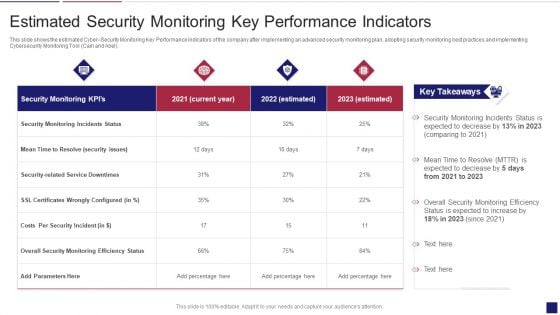
Continuous Development Evaluation Plan Eliminate Cyber Attacks Estimated Security Monitoring Designs PDF
This slide shows the estimated Cyber Security Monitoring Key Performance Indicators of the company after implementing an advanced security monitoring plan, adopting security monitoring best practices and implementing Cybersecurity Monitoring Tool Cain and Abel. Deliver and pitch your topic in the best possible manner with this continuous development evaluation plan eliminate cyber attacks estimated security monitoring designs pdf. Use them to share invaluable insights on estimated security monitoring key performance indicators and impress your audience. This template can be altered and modified as per your expectations. So, grab it now.

Modern Security Observation Plan To Eradicate Cybersecurity Risk And Data Breach Estimated Security Monitoring Guidelines PDF
This slide shows the estimated Cyber Security Monitoring Key Performance Indicators of the company after implementing an advanced security monitoring plan, adopting security monitoring best practices and implementing Cybersecurity Monitoring Tool Cain and Abel. Deliver and pitch your topic in the best possible manner with this modern security observation plan to eradicate cybersecurity risk and data breach estimated security monitoring guidelines pdf. Use them to share invaluable insights on estimated security monitoring key performance indicators and impress your audience. This template can be altered and modified as per your expectations. So, grab it now.
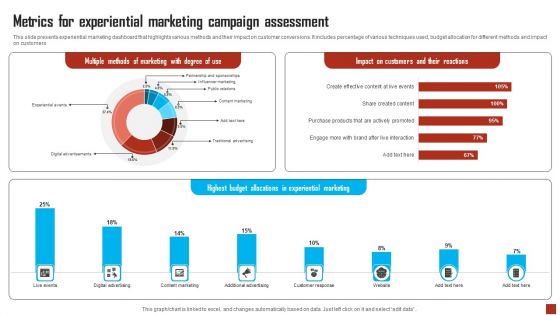
Metrics For Experiential Marketing Campaign Assessment Designs PDF
This slide presents experiential marketing dashboard that highlights various methods and their impact on customer conversions. It includes percentage of various techniques used, budget allocation for different methods and impact on customers. Showcasing this set of slides titled Metrics For Experiential Marketing Campaign Assessment Designs PDF. The topics addressed in these templates are Metrics, Experiential Marketing Campaign Assessment. All the content presented in this PPT design is completely editable. Download it and make adjustments in color, background, font etc. as per your unique business setting.

Progress Assessment Outline Content Ppt PowerPoint Presentation Pictures Design Ideas PDF
Presenting this set of slides with name progress assessment outline content ppt powerpoint presentation pictures design ideas pdf. The topics discussed in these slides are bsc perspectives, bsc perspectives measurement, balanced scorecard implementation, bsc strategy map, scorecard departmental level, bsc execution framework, performance dashboard. This is a completely editable PowerPoint presentation and is available for immediate download. Download now and impress your audience.
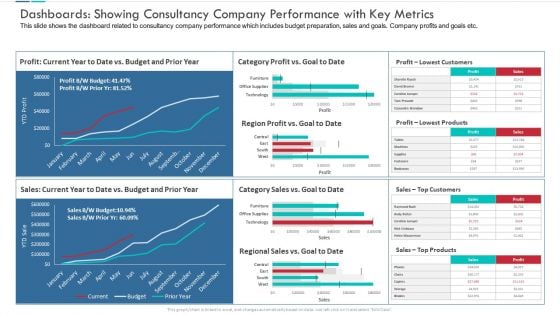
Dashboards Showing Consultancy Company Performance With Key Metrics Microsoft PDF
This slide shows the dashboard related to consultancy company performance which includes budget preparation, sales and goals. Company profits and goals etc.Presenting dashboards showing consultancy company performance with key metrics microsoft pdf to provide visual cues and insights. Share and navigate important information on four stages that need your due attention. This template can be used to pitch topics like dashboards showing consultancy company performance with key metrics. In addtion, this PPT design contains high resolution images, graphics, etc, that are easily editable and available for immediate download.
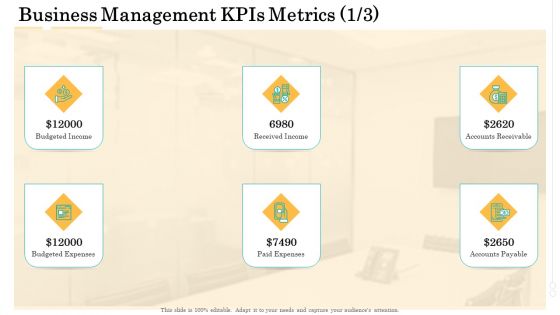
Administrative Regulation Business Management KPIs Metrics Ppt PowerPoint Presentation Slides Shapes PDF
This is a administrative regulation business management kpis metrics ppt powerpoint presentation slides shapes pdf template with various stages. Focus and dispense information on six stages using this creative set, that comes with editable features. It contains large content boxes to add your information on topics like budgeted income, received income, accounts receivable, budgeted expenses, paid expenses, accounts payable. You can also showcase facts, figures, and other relevant content using this PPT layout. Grab it now.
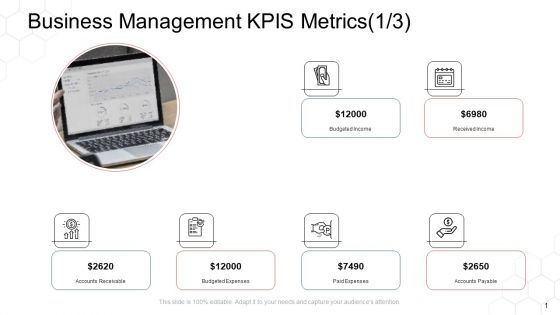
Corporate Regulation Business Management Kpis Metrics Accounts Ppt Layouts Grid PDF
Presenting corporate regulation business management kpis metrics accounts ppt layouts grid pdf to provide visual cues and insights. Share and navigate important information on six stages that need your due attention. This template can be used to pitch topics like budgeted income, received income, accounts receivable, budgeted expenses, paid expenses. In addtion, this PPT design contains high resolution images, graphics, etc, that are easily editable and available for immediate download.
Bar Chart Business Analytics Vector Icon Ppt PowerPoint Presentation Layouts Shapes
Presenting this set of slides with name bar chart business analytics vector icon ppt powerpoint presentation layouts shapes. This is a three stage process. The stages in this process are data visualization icon, research analysis, business focus. This is a completely editable PowerPoint presentation and is available for immediate download. Download now and impress your audience.
Business Focus Vector Icon Ppt PowerPoint Presentation Portfolio Background Image
Presenting this set of slides with name business focus vector icon ppt powerpoint presentation portfolio background image. This is a one stage process. The stages in this process are data visualization icon, research analysis, business focus. This is a completely editable PowerPoint presentation and is available for immediate download. Download now and impress your audience.
Business Performance Graph On Screen Icon Ppt PowerPoint Presentation Show Layouts
Presenting this set of slides with name business performance graph on screen icon ppt powerpoint presentation show layouts. This is a three stage process. The stages in this process are data visualization icon, research analysis, business focus. This is a completely editable PowerPoint presentation and is available for immediate download. Download now and impress your audience.
Business Performance Mapping Vector Icon Ppt PowerPoint Presentation Outline Show
Presenting this set of slides with name business performance mapping vector icon ppt powerpoint presentation outline show. This is a three stage process. The stages in this process are data visualization icon, research analysis, business focus. This is a completely editable PowerPoint presentation and is available for immediate download. Download now and impress your audience.
Computer Screen With Cloud Icon Ppt PowerPoint Presentation Outline Designs
Presenting this set of slides with name computer screen with cloud icon ppt powerpoint presentation outline designs. This is a three stage process. The stages in this process are data visualization icon, research analysis, business focus. This is a completely editable PowerPoint presentation and is available for immediate download. Download now and impress your audience.
Human Eye Observation And Monitoring Icon Ppt PowerPoint Presentation Layouts Graphics
Presenting this set of slides with name human eye observation and monitoring icon ppt powerpoint presentation layouts graphics. This is a three stage process. The stages in this process are data visualization icon, research analysis, business focus. This is a completely editable PowerPoint presentation and is available for immediate download. Download now and impress your audience.
Illustration Of Business Trends Icon Ppt PowerPoint Presentation Gallery Example
Presenting this set of slides with name illustration of business trends icon ppt powerpoint presentation gallery example. This is a two stage process. The stages in this process are data visualization icon, research analysis, business focus. This is a completely editable PowerPoint presentation and is available for immediate download. Download now and impress your audience.
Information Visualization Vector Icon Ppt PowerPoint Presentation Ideas Microsoft
Presenting this set of slides with name information visualization vector icon ppt powerpoint presentation ideas microsoft. This is a three stage process. The stages in this process are data visualization icon, research analysis, business focus. This is a completely editable PowerPoint presentation and is available for immediate download. Download now and impress your audience.
Statistics Dashboard Vector Icon Ppt PowerPoint Presentation Pictures Visual Aids
Presenting this set of slides with name statistics dashboard vector icon ppt powerpoint presentation pictures visual aids. This is a one stage process. The stages in this process are data visualization icon, research analysis, business focus. This is a completely editable PowerPoint presentation and is available for immediate download. Download now and impress your audience.
Upward Profit Growth Arrow Graph Vector Icon Ppt PowerPoint Presentation Styles Templates
Presenting this set of slides with name upward profit growth arrow graph vector icon ppt powerpoint presentation styles templates. This is a one stage process. The stages in this process are data visualization icon, research analysis, business focus. This is a completely editable PowerPoint presentation and is available for immediate download. Download now and impress your audience.
Visual Analytics Vector Icon Ppt PowerPoint Presentation Visual Aids Show
Presenting this set of slides with name visual analytics vector icon ppt powerpoint presentation visual aids show. This is a three stage process. The stages in this process are data visualization icon, research analysis, business focus. This is a completely editable PowerPoint presentation and is available for immediate download. Download now and impress your audience.
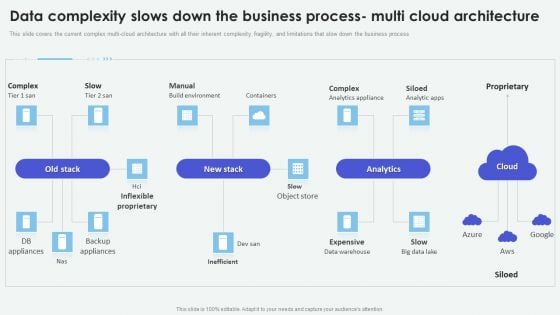
Cloud Based Computing Analysis Data Complexity Slows Down The Business Process Professional PDF
This slide covers the current complex multi-cloud architecture with all their inherent complexity, fragility, and limitations that slow down the business process. Do you have an important presentation coming up Are you looking for something that will make your presentation stand out from the rest Look no further than Cloud Based Computing Analysis Data Complexity Slows Down The Business Process Professional PDF. With our professional designs, you can trust that your presentation will pop and make delivering it a smooth process. And with Slidegeeks, you can trust that your presentation will be unique and memorable. So why wait Grab Cloud Based Computing Analysis Data Complexity Slows Down The Business Process Professional PDF today and make your presentation stand out from the rest
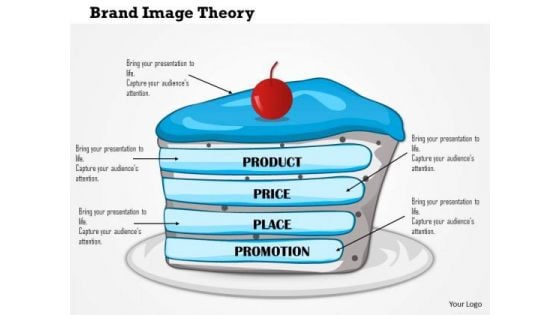
Business Framework Brand Image Theory PowerPoint Presentation
Colored chart graphic with multiple milestones has been used to decorate this Power Point template slide. This PPT slide contains the concept of data prediction. This slide shows big data from descriptive to predictive way. Use this PPT slide for business data analysis related presentation.
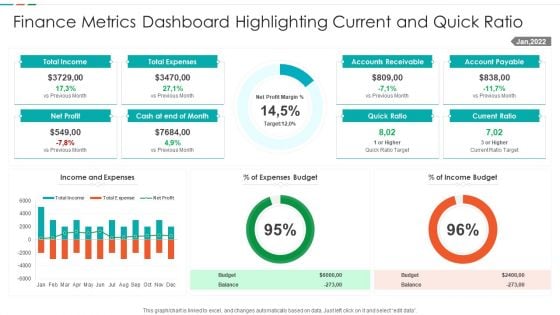
Finance Metrics Dashboard Highlighting Current And Quick Ratio Template PDF
This graph or chart is linked to excel, and changes automatically based on data. Just left click on it and select edit data. Showcasing this set of slides titled Finance Metrics Dashboard Highlighting Current And Quick Ratio Template PDF. The topics addressed in these templates are Total Income Budget, Total Expenses Balance, Net Profit Quick, Ratio Current Ratio. All the content presented in this PPT design is completely editable. Download it and make adjustments in color, background, font etc. as per your unique business setting.
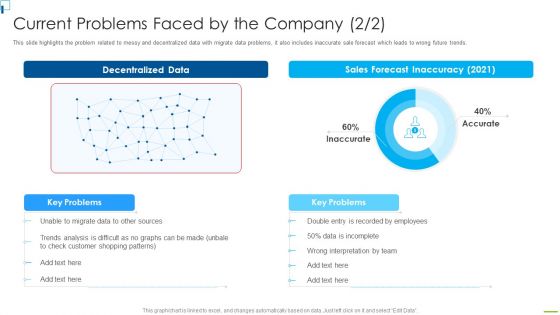
Designing And Deployment Current Problems Faced By The Company Portrait PDF
This slide highlights the problem related to messy and decentralized data with migrate data problems, it also includes inaccurate sale forecast which leads to wrong future trends. Deliver and pitch your topic in the best possible manner with this designing and deployment current problems faced by the company portrait pdf. Use them to share invaluable insights on decentralized data, sales forecast inaccuracy 2021, employees, trends analysis and impress your audience. This template can be altered and modified as per your expectations. So, grab it now.
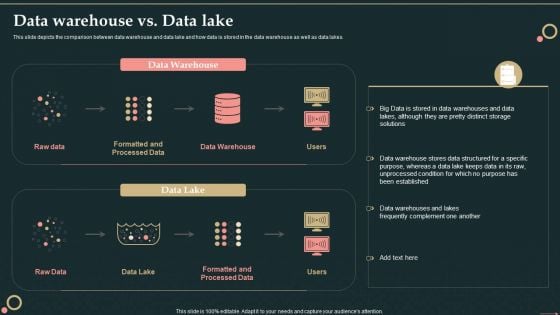
Management Information System Data Warehouse Vs Data Lake Download PDF
This slide depicts the comparison between data warehouse and data lake and how data is stored in the data warehouse as well as data lakes.Deliver and pitch your topic in the best possible manner with this Management Information System Data Warehouse Vs Data Lake Download PDF. Use them to share invaluable insights on Data Warehouse, Formatted, Processed Data and impress your audience. This template can be altered and modified as per your expectations. So, grab it now.
Data Analysis Bar Chart With Magnifying Glass Icon Ppt PowerPoint Presentation Icon Layouts PDF
Presenting this set of slides with name data analysis bar chart with magnifying glass icon ppt powerpoint presentation icon layouts pdf. This is a three stage process. The stages in this process are data analysis bar chart with magnifying glass icon. This is a completely editable PowerPoint presentation and is available for immediate download. Download now and impress your audience.
Data Analysis With Bar Chart In Magnifying Glass Vector Icon Ppt PowerPoint Presentation File Model PDF
Presenting this set of slides with name data analysis with bar chart in magnifying glass vector icon ppt powerpoint presentation file model pdf. This is a one stage process. The stages in this process is data analysis with bar chart in magnifying glass vector icon. This is a completely editable PowerPoint presentation and is available for immediate download. Download now and impress your audience.
Data Identification And Information Analysis Vector Icon Ppt PowerPoint Presentation Gallery Example PDF
Presenting data identification and information analysis vector icon ppt powerpoint presentation gallery example pdf to dispense important information. This template comprises three stages. It also presents valuable insights into the topics including data identification and information analysis vector icon. This is a completely customizable PowerPoint theme that can be put to use immediately. So, download it and address the topic impactfully.
Data Research And Analysis Vector Icon Ppt PowerPoint Presentation Icon Background Image PDF
Presenting data research and analysis vector icon ppt powerpoint presentation icon background image pdf to dispense important information. This template comprises three stages. It also presents valuable insights into the topics including data research and analysis vector icon. This is a completely customizable PowerPoint theme that can be put to use immediately. So, download it and address the topic impactfully.
Vector Showing Data Quality Analysis Method Icon Ppt PowerPoint Presentation Icon Show PDF
Presenting vector showing data quality analysis method icon ppt powerpoint presentation icon show pdf to dispense important information. This template comprises three stages. It also presents valuable insights into the topics including vector showing data quality analysis method icon. This is a completely customizable PowerPoint theme that can be put to use immediately. So, download it and address the topic impactfully.
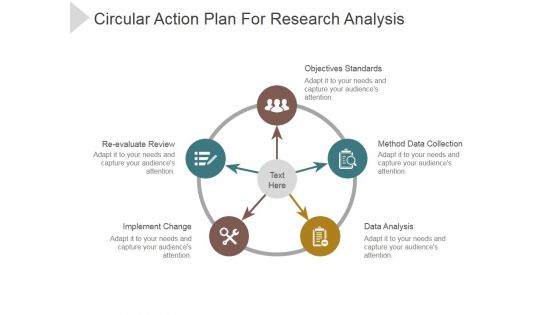
Circular Action Plan For Research Analysis Ppt PowerPoint Presentation Outline
This is a circular action plan for research analysis ppt powerpoint presentation outline. This is a five stage process. The stages in this process are Objectives Standards, Method Data Collection, Data Analysis, Implement Change, Reevaluate Review.
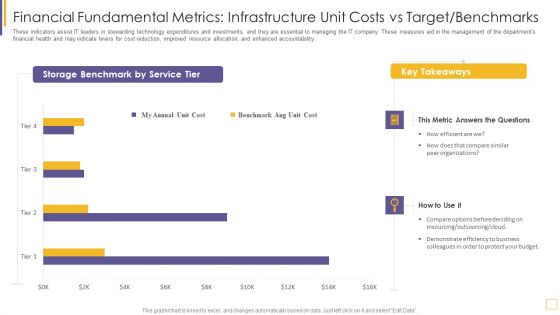
Guidelines For Exhibiting Business Value Of Information And Technology Financial Fundamental Metrics Diagrams PDF
This template covers fundamental financial metrics IT spend vs Plan for both opex and capex budgets, and application and service total cost, which aligns business value communication to IT values. Deliver and pitch your topic in the best possible manner with this guidelines for exhibiting business value of information and technology financial fundamental metrics diagrams pdf. Use them to share invaluable insights on metric, budget, accountability, planned and impress your audience. This template can be altered and modified as per your expectations. So, grab it now.


 Continue with Email

 Home
Home


