Project Portfolio Dashboard
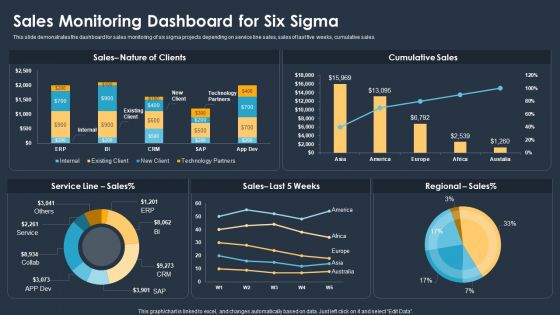
Six Sigma Methodologies For Process Optimization Sales Monitoring Dashboard For Six Sigma Elements PDF
This slide demonstrates the dashboard for sales monitoring of six sigma projects depending on service line sales, sales of last five weeks, cumulative sales. Showcasing this set of slides titled Six Sigma Methodologies For Process Optimization Sales Monitoring Dashboard For Six Sigma Elements PDF. The topics addressed in these templates are Sales, Service Line, Technology Partners. All the content presented in this PPT design is completely editable. Download it and make adjustments in color, background, font etc. as per your unique business setting.
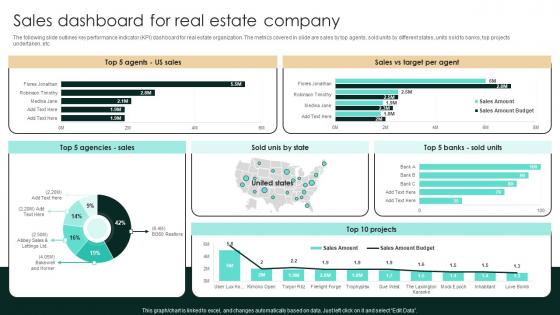
Sales Dashboard For Real Estate Company Strategic Real Estate Introduction Pdf
The following slide outlines key performance indicator KPI dashboard for real estate organization. The metrics covered in slide are sales by top agents, sold units by different states, units sold to banks, top projects undertaken, etc. If you are looking for a format to display your unique thoughts, then the professionally designed Sales Dashboard For Real Estate Company Strategic Real Estate Introduction Pdf is the one for you. You can use it as a Google Slides template or a PowerPoint template. Incorporate impressive visuals, symbols, images, and other charts. Modify or reorganize the text boxes as you desire. Experiment with shade schemes and font pairings. Alter, share or cooperate with other people on your work. Download Sales Dashboard For Real Estate Company Strategic Real Estate Introduction Pdf and find out how to give a successful presentation. Present a perfect display to your team and make your presentation unforgettable. The following slide outlines key performance indicator KPI dashboard for real estate organization. The metrics covered in slide are sales by top agents, sold units by different states, units sold to banks, top projects undertaken, etc.
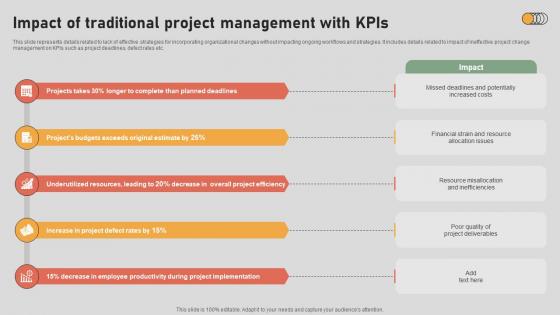
The Digital Project Managers Impact Of Traditional Project Management With Kpis
This slide represents details related to lack of effective strategies for incorporating organizational changes without impacting ongoing workflows and strategies. It includes details related to impact of ineffective project change management on KPIs such as project deadlines, defect rates etc. This The Digital Project Managers Impact Of Traditional Project Management With Kpis is perfect for any presentation, be it in front of clients or colleagues. It is a versatile and stylish solution for organizing your meetings. The The Digital Project Managers Impact Of Traditional Project Management With Kpis features a modern design for your presentation meetings. The adjustable and customizable slides provide unlimited possibilities for acing up your presentation. Slidegeeks has done all the homework before launching the product for you. So, do not wait, grab the presentation templates today This slide represents details related to lack of effective strategies for incorporating organizational changes without impacting ongoing workflows and strategies. It includes details related to impact of ineffective project change management on KPIs such as project deadlines, defect rates etc.
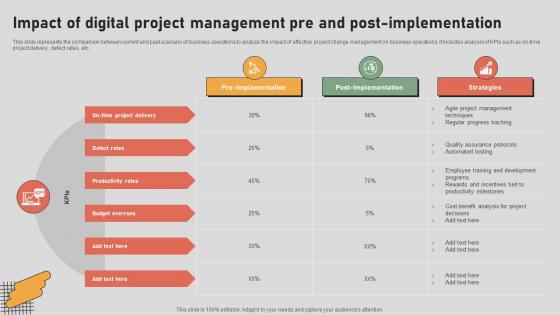
The Digital Project Managers Impact Of Digital Project Management Pre And Post Implementation
This slide represents the comparison between current and past scenario of business operations to analyze the impact of effective project change management on business operations. It includes analysis of KPIs such as on-time project delivery, defect rates, etc. Coming up with a presentation necessitates that the majority of the effort goes into the content and the message you intend to convey. The visuals of a PowerPoint presentation can only be effective if it supplements and supports the story that is being told. Keeping this in mind our experts created The Digital Project Managers Impact Of Digital Project Management Pre And Post Implementation to reduce the time that goes into designing the presentation. This way, you can concentrate on the message while our designers take care of providing you with the right template for the situation. This slide represents the comparison between current and past scenario of business operations to analyze the impact of effective project change management on business operations. It includes analysis of KPIs such as on-time project delivery, defect rates, etc.
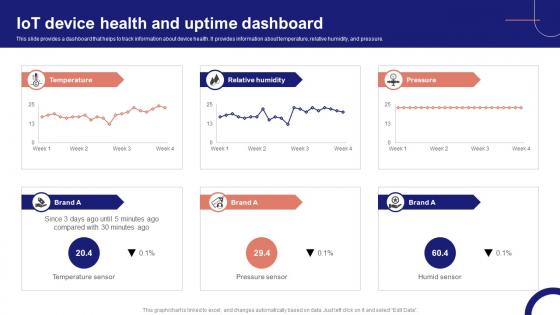
IoT Device Management Fundamentals IoT Device Health And Uptime Dashboard IoT Ss V
This slide provides a dashboard that helps to track information about device health. It provides information about temperature, relative humidity, and pressure. Take your projects to the next level with our ultimate collection of IoT Device Management Fundamentals IoT Device Health And Uptime Dashboard IoT SS V. Slidegeeks has designed a range of layouts that are perfect for representing task or activity duration, keeping track of all your deadlines at a glance. Tailor these designs to your exact needs and give them a truly corporate look with your own brand colors they will make your projects stand out from the rest This slide provides a dashboard that helps to track information about device health. It provides information about temperature, relative humidity, and pressure.
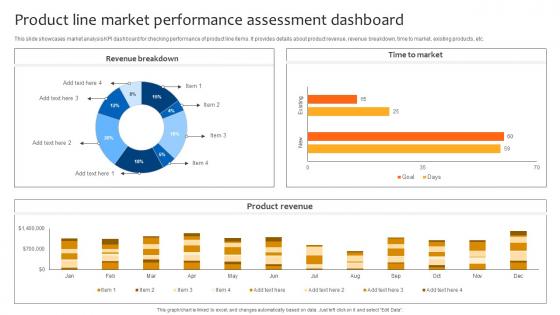
Deploying Strategies For Business Product Line Market Performance Assessment Dashboard Strategy SS V
This slide showcases market analysis KPI dashboard for checking performance of product line items. It provides details about product revenue, revenue breakdown, time to market, existing products, etc. Take your projects to the next level with our ultimate collection of Deploying Strategies For Business Product Line Market Performance Assessment Dashboard Strategy SS V. Slidegeeks has designed a range of layouts that are perfect for representing task or activity duration, keeping track of all your deadlines at a glance. Tailor these designs to your exact needs and give them a truly corporate look with your own brand colors they will make your projects stand out from the rest This slide showcases market analysis KPI dashboard for checking performance of product line items. It provides details about product revenue, revenue breakdown, time to market, existing products, etc.

Introduction To Mobile SEM KPI Metrics Dashboard To Monitor Mobile SEO Performance Diagrams PDF
The purpose of this slide is to outline key performance indicator KPI dashboard which will assist the marketer to analyze mobile search engine optimization SEO performance. The key metrics mentioned in the slide are total sessions, search engine rankings etc. Take your projects to the next level with our ultimate collection of Introduction To Mobile SEM KPI Metrics Dashboard To Monitor Mobile SEO Performance Diagrams PDF. Slidegeeks has designed a range of layouts that are perfect for representing task or activity duration, keeping track of all your deadlines at a glance. Tailor these designs to your exact needs and give them a truly corporate look with your own brand colors they will make your projects stand out from the rest.
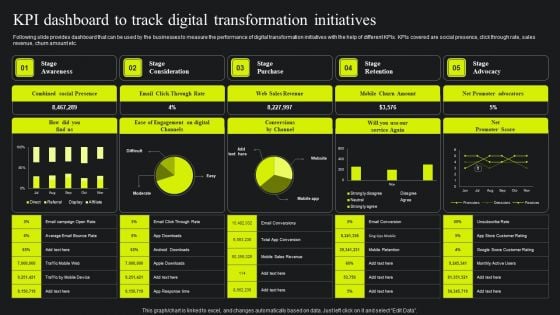
KPI Dashboard To Track Digital Transformation Initiatives Ppt Styles Graphics PDF
Following slide provides dashboard that can be used by the businesses to measure the performance of digital transformation initiatives with the help of different KPIs. KPIs covered are social presence, click through rate, sales revenue, churn amount etc. Take your projects to the next level with our ultimate collection of KPI Dashboard To Track Digital Transformation Initiatives Ppt Styles Graphics PDF. Slidegeeks has designed a range of layouts that are perfect for representing task or activity duration, keeping track of all your deadlines at a glance. Tailor these designs to your exact needs and give them a truly corporate look with your own brand colors they will make your projects stand out from the rest.
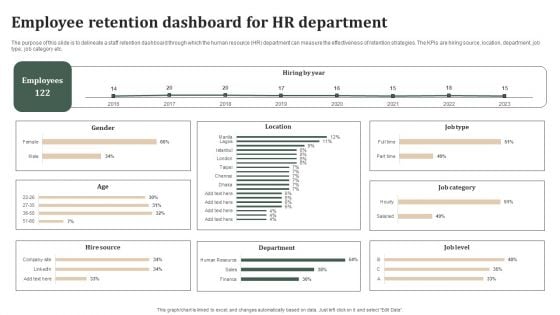
Successful Staff Retention Techniques Employee Retention Dashboard For Hr Department Template PDF
The purpose of this slide is to delineate a staff retention dashboard through which the human resource HR department can measure the effectiveness of retention strategies. The KPIs are hiring source, location, department, job type, job category etc. Take your projects to the next level with our ultimate collection of Successful Staff Retention Techniques Employee Retention Dashboard For Hr Department Template PDF. Slidegeeks has designed a range of layouts that are perfect for representing task or activity duration, keeping track of all your deadlines at a glance. Tailor these designs to your exact needs and give them a truly corporate look with your own brand colors they will make your projects stand out from the rest.
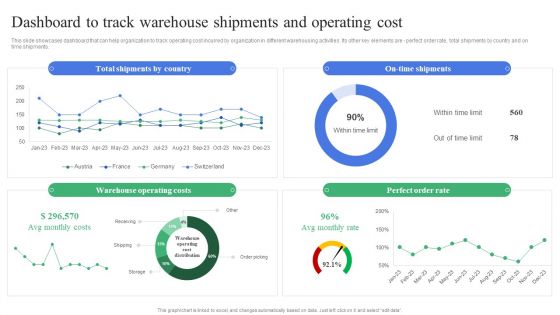
Strategic Guidelines To Administer Dashboard To Track Warehouse Shipments And Operating Sample PDF
This slide showcases dashboard that can help organization to track operating cost incurred by organization in different warehousing activities. Its other key elements are - perfect order rate, total shipments by country and on time shipments. Take your projects to the next level with our ultimate collection of Strategic Guidelines To Administer Dashboard To Track Warehouse Shipments And Operating Sample PDF. Slidegeeks has designed a range of layouts that are perfect for representing task or activity duration, keeping track of all your deadlines at a glance. Tailor these designs to your exact needs and give them a truly corporate look with your own brand colors theyll make your projects stand out from the rest.
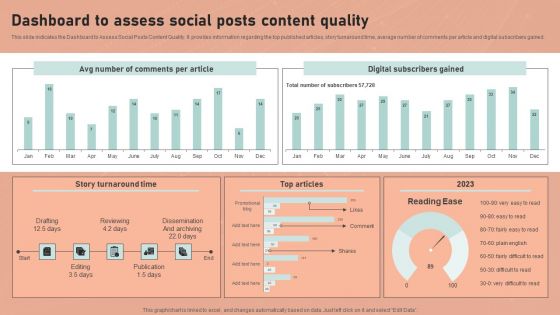
Definitive Guide To Conduct Digital Marketing Inspection Dashboard To Assess Social Posts Content Quality Summary PDF
This slide indicates the Dashboard to Assess Social Posts Content Quality. It provides information regarding the top published articles, story turnaround time, average number of comments per article and digital subscribers gained. Take your projects to the next level with our ultimate collection of Definitive Guide To Conduct Digital Marketing Inspection Dashboard To Assess Social Posts Content Quality Summary PDF. Slidegeeks has designed a range of layouts that are perfect for representing task or activity duration, keeping track of all your deadlines at a glance. Tailor these designs to your exact needs and give them a truly corporate look with your own brand colors they will make your projects stand out from the rest.
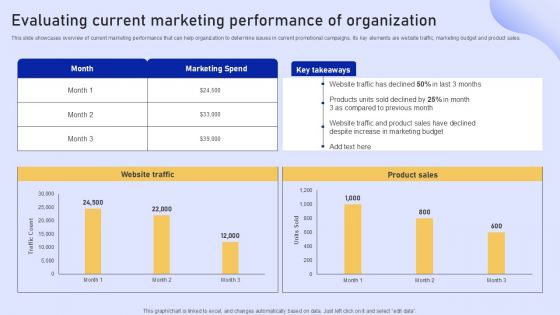
Online Marketing Strategy For Lead Generation Dashboard To Track Website Traffic During Performance Icons PDF
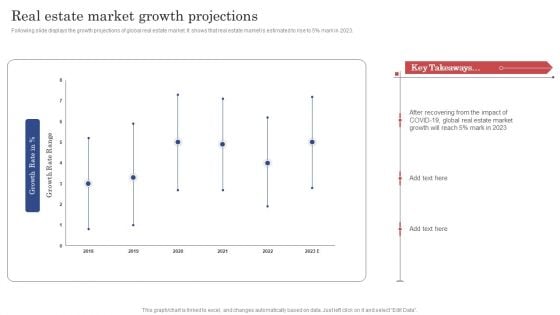
Construction Project Cost Benefit Analysis Report Real Estate Market Growth Projections Rules PDF
Following slide displays the growth projections of global real estate market. It shows that real estate market is estimated to rise to 5 percent mark in 2023. The Construction Project Cost Benefit Analysis Report Real Estate Market Growth Projections Rules PDF is a compilation of the most recent design trends as a series of slides. It is suitable for any subject or industry presentation, containing attractive visuals and photo spots for businesses to clearly express their messages. This template contains a variety of slides for the user to input data, such as structures to contrast two elements, bullet points, and slides for written information. Slidegeeks is prepared to create an impression.
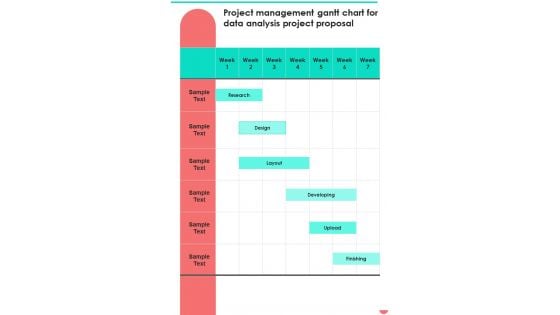
Project Management Gantt Chart For Data Analysis Project Proposal One Pager Sample Example Document
Presenting you an exemplary Project Management Gantt Chart For Data Analysis Project Proposal One Pager Sample Example Document. Our one-pager comprises all the must-have essentials of an inclusive document. You can edit it with ease, as its layout is completely editable. With such freedom, you can tweak its design and other elements to your requirements. Download this Project Management Gantt Chart For Data Analysis Project Proposal One Pager Sample Example Document brilliant piece now.
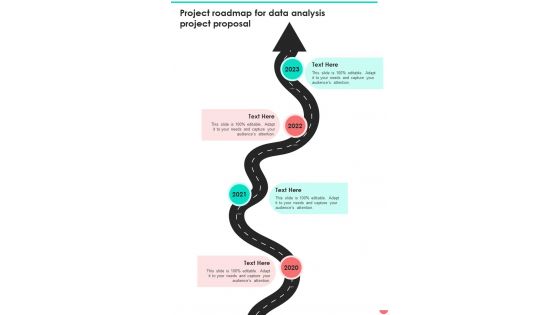
Project Roadmap For Data Analysis Project Proposal One Pager Sample Example Document
Presenting you an exemplary Project Roadmap For Data Analysis Project Proposal One Pager Sample Example Document. Our one-pager comprises all the must-have essentials of an inclusive document. You can edit it with ease, as its layout is completely editable. With such freedom, you can tweak its design and other elements to your requirements. Download this Project Roadmap For Data Analysis Project Proposal One Pager Sample Example Document brilliant piece now.
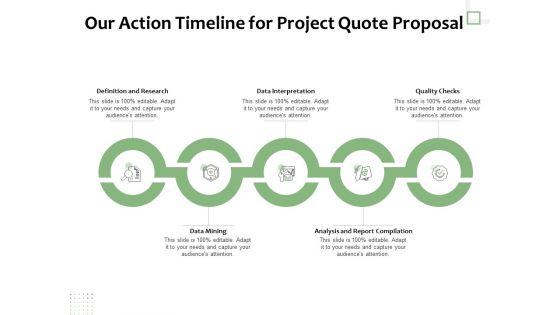
Project Estimate Our Action Timeline For Project Quote Proposal Ppt Inspiration Design Templates PDF
Presenting this set of slides with name project estimate our action timeline for project quote proposal ppt inspiration design templates pdf. This is a five stage process. The stages in this process are data interpretation, quality checks, data mining, analysis, report compilation. This is a completely editable PowerPoint presentation and is available for immediate download. Download now and impress your audience.
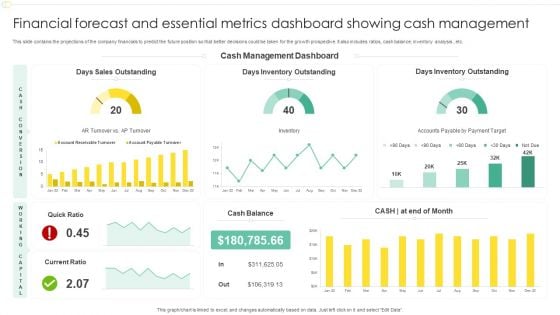
Financial Forecast And Essential Metrics Dashboard Showing Cash Management Designs PDF
This slide contains the projections of the company financials to predict the future position so that better decisions could be taken for the growth prospective. It also includes ratios, cash balance, inventory analysis , etc. Showcasing this set of slides titled Financial Forecast And Essential Metrics Dashboard Showing Cash Management Designs PDF. The topics addressed in these templates are Days Sales Outstanding, Cash Management Dashboard, Days Inventory Outstanding. All the content presented in this PPT design is completely editable. Download it and make adjustments in color, background, font etc. as per your unique business setting.
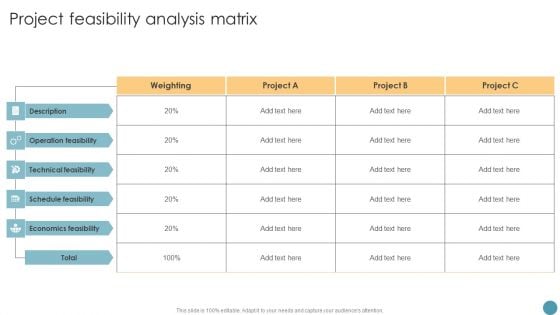
Project Feasibility Analysis Matrix Feasibility Analysis Report For Construction Project Designs PDF
The Project Feasibility Analysis Matrix Feasibility Analysis Report For Construction Project Designs PDF is a compilation of the most recent design trends as a series of slides. It is suitable for any subject or industry presentation, containing attractive visuals and photo spots for businesses to clearly express their messages. This template contains a variety of slides for the user to input data, such as structures to contrast two elements, bullet points, and slides for written information. Slidegeeks is prepared to create an impression.
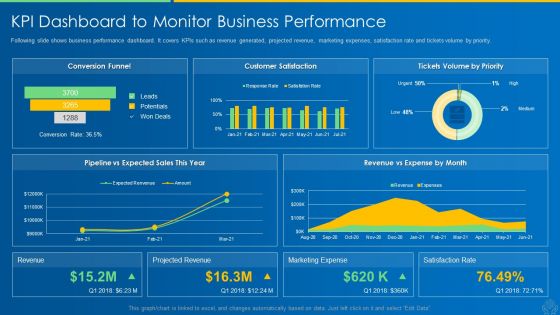
AI And ML Driving Monetary Value For Organization KPI Dashboard To Monitor Business Performance Graphics PDF
Following slide shows business performance dashboard. It covers KPIs such as revenue generated, projected revenue, marketing expenses, satisfaction rate and tickets volume by priority. Deliver and pitch your topic in the best possible manner with this ai and ml driving monetary value for organization kpi dashboard to monitor business performance graphics pdf. Use them to share invaluable insights on business offerings, current impact, product innovations, customer service and impress your audience. This template can be altered and modified as per your expectations. So, grab it now.
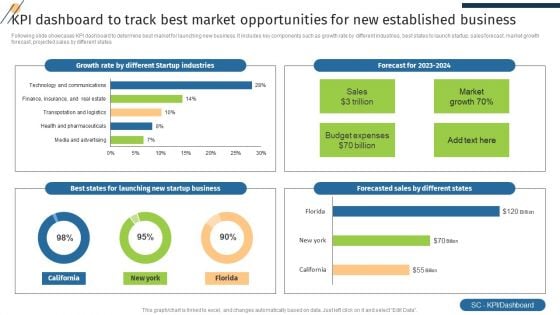
KPI Dashboard To Track Best Market Opportunities For New Established Business Pictures PDF
Following slide showcases KPI dashboard to determine best market for launching new business. It includes key components such as growth rate by different industries, best states to launch startup, sales forecast, market growth forecast, projected sales by different states. Showcasing this set of slides titled KPI Dashboard To Track Best Market Opportunities For New Established Business Pictures PDF. The topics addressed in these templates are Forecasted Sales, Growth Rate, Startup Industries. All the content presented in this PPT design is completely editable. Download it and make adjustments in color, background, font etc. as per your unique business setting.
Ultimate Guide To Cold Sales Agents Call Performance Tracking Dashboard SA SS V
This slide showcases company monthly call activity that helps to track agents performance including total answered calls, total agents, CSAT, etc. Take your projects to the next level with our ultimate collection of Ultimate Guide To Cold Sales Agents Call Performance Tracking Dashboard SA SS V. Slidegeeks has designed a range of layouts that are perfect for representing task or activity duration, keeping track of all your deadlines at a glance. Tailor these designs to your exact needs and give them a truly corporate look with your own brand colors they will make your projects stand out from the rest This slide showcases company monthly call activity that helps to track agents performance including total answered calls, total agents, CSAT, etc.

IoT Solutions For Oil Oil And Gas Production Monitoring KPI Dashboard IoT SS V
This slide exhibits monthly performance of oil and gas production to track wellhead uptime and overall efficiency. It includes various elements such as production efficiency, well uptime, gas production rate, oil production rate, top performing gas producing wells, etc. Take your projects to the next level with our ultimate collection of IoT Solutions For Oil Oil And Gas Production Monitoring KPI Dashboard IoT SS V. Slidegeeks has designed a range of layouts that are perfect for representing task or activity duration, keeping track of all your deadlines at a glance. Tailor these designs to your exact needs and give them a truly corporate look with your own brand colors they will make your projects stand out from the rest This slide exhibits monthly performance of oil and gas production to track wellhead uptime and overall efficiency. It includes various elements such as production efficiency, well uptime, gas production rate, oil production rate, top performing gas producing wells, etc.

Submission Of Project Viability Report For Bank Loan Project Overview Objectives And Deliverables Template PDF
Following slide shows the objective and deliverables of construction project. It also includes the information about project name, its location, duration and cost. The visuals of a PowerPoint presentation can only be effective if it supplements and supports the story that is being told. Keeping this in mind our experts created Submission Of Project Viability Report For Bank Loan Project Overview Objectives And Deliverables Template PDF to reduce the time that goes into designing the presentation. This way, you can concentrate on the message while our designers take care of providing you with the right template for the situation.
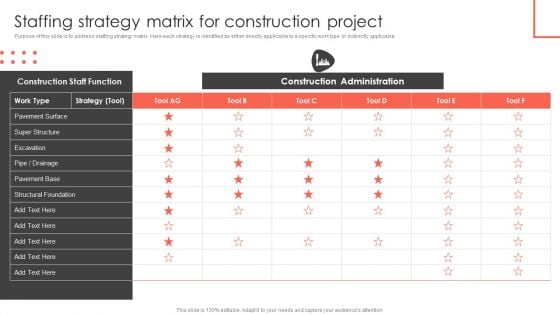
Staffing Strategy Matrix For Construction Project Construct Project Feasibility Analysis Report Themes PDF
Purpose of this slide is to address staffing strategy matrix. Here each strategy is identified as either directly applicable to a specific work type or indirectly applicable. The Staffing Strategy Matrix For Construction Project Construct Project Feasibility Analysis Report Themes PDF is a compilation of the most recent design trends as a series of slides. It is suitable for any subject or industry presentation, containing attractive visuals and photo spots for businesses to clearly express their messages. This template contains a variety of slides for the user to input data, such as structures to contrast two elements, bullet points, and slides for written information. Slidegeeks is prepared to create an impression.
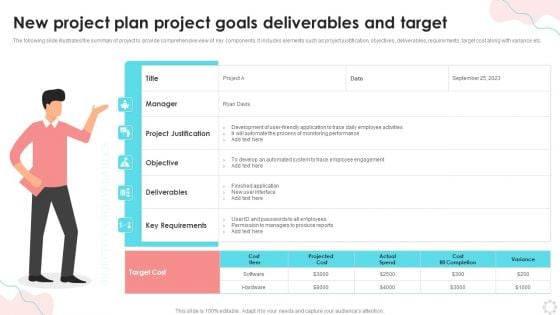
New Project Plan Project Goals Deliverables And Target Ppt PowerPoint Presentation Infographics Graphics Download PDF
The following slide illustrates the summary of project to provide comprehensive view of key components. It includes elements such as project justification, objectives, deliverables, requirements, target cost along with variance etc. Showcasing this set of slides titled New Project Plan Project Goals Deliverables And Target Ppt PowerPoint Presentation Infographics Graphics Download PDF. The topics addressed in these templates are Monitoring Performance, Key Requirements, Permission Managers. All the content presented in this PPT design is completely editable. Download it and make adjustments in color, background, font etc. as per your unique business setting.
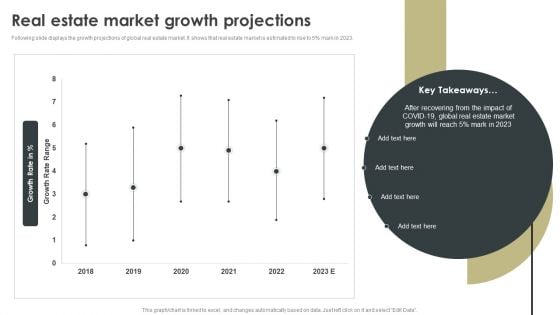
Construction Project Cost Benefit Analysis Report For Mortgage Approval Real Estate Market Growth Projections Formats PDF
Following slide displays the growth projections of global real estate market. It shows that real estate market is estimated to rise to 5 percent mark in 2023. Get a simple yet stunning designed Construction Project Cost Benefit Analysis Report For Mortgage Approval Real Estate Market Growth Projections Formats PDF. It is the best one to establish the tone in your meetings. It is an excellent way to make your presentations highly effective. So, download this PPT today from Slidegeeks and see the positive impacts. Our easy to edit Construction Project Cost Benefit Analysis Report For Mortgage Approval Real Estate Market Growth Projections Formats PDF can be your go to option for all upcoming conferences and meetings. So, what are you waiting for Grab this template today.
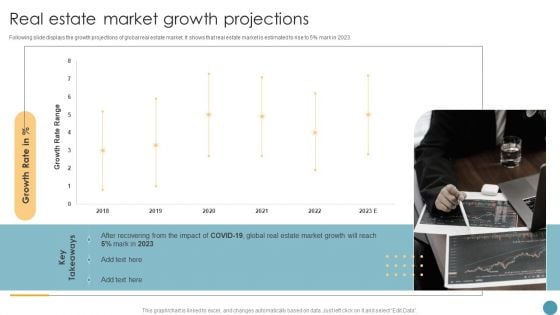
Feasibility Analysis Report For Construction Project Real Estate Market Growth Projections Download PDF
Following slide displays the growth projections of global real estate market. It shows that real estate market is estimated to rise to 5 percent mark in 2023. Get a simple yet stunning designed Feasibility Analysis Report For Construction Project Real Estate Market Growth Projections Download PDF. It is the best one to establish the tone in your meetings. It is an excellent way to make your presentations highly effective. So, download this PPT today from Slidegeeks and see the positive impacts. Our easy to edit Feasibility Analysis Report For Construction Project Real Estate Market Growth Projections Download PDF can be your go to option for all upcoming conferences and meetings. So, what are you waiting for Grab this template today.
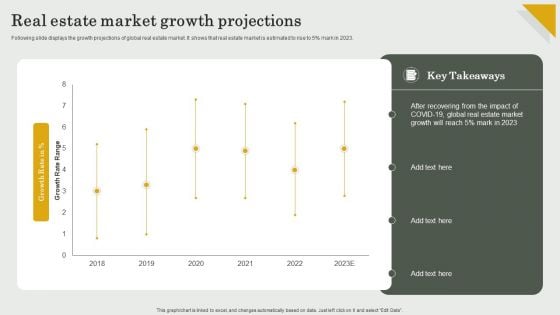
Submission Of Project Viability Report For Bank Loan Real Estate Market Growth Projections Guidelines PDF
Following slide displays the growth projections of global real estate market. It shows that real estate market is estimated to rise to 5 percent mark in 2023. Explore a selection of the finest Submission Of Project Viability Report For Bank Loan Real Estate Market Growth Projections Guidelines PDF here. With a plethora of professionally designed and pre-made slide templates, you can quickly and easily find the right one for your upcoming presentation. You can use our Submission Of Project Viability Report For Bank Loan Real Estate Market Growth Projections Guidelines PDF to effectively convey your message to a wider audience. Slidegeeks has done a lot of research before preparing these presentation templates. The content can be personalized and the slides are highly editable. Grab templates today from Slidegeeks.
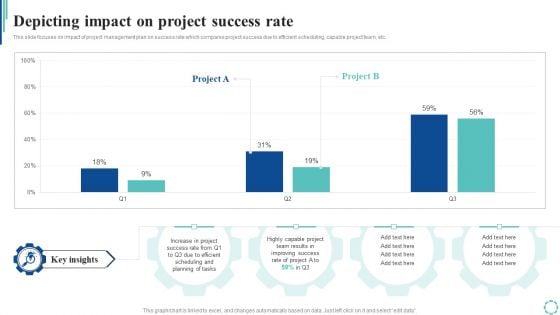
Depicting Impact On Project Success Rate Strategies To Enhance Project Lifecycle Infographics PDF
This slide focuses on impact of project management plan on success rate which compares project success due to efficient scheduling, capable project team, etc.This Depicting Impact On Project Success Rate Strategies To Enhance Project Lifecycle Infographics PDF from Slidegeeks makes it easy to present information on your topic with precision. It provides customization options, so you can make changes to the colors, design, graphics, or any other component to create a unique layout. It is also available for immediate download, so you can begin using it right away. Slidegeeks has done good research to ensure that you have everything you need to make your presentation stand out. Make a name out there for a brilliant performance.
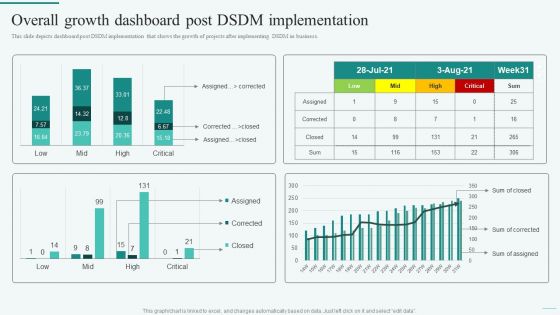
Overall Growth Dashboard Post DSDM Implementation Integration Of Dynamic System To Enhance Processes Designs PDF
This slide depicts dashboard post DSDM implementation that shows the growth of projects after implementing DSDM in business.Here you can discover an assortment of the finest PowerPoint and Google Slides templates. With these templates, you can create presentations for a variety of purposes while simultaneously providing your audience with an eye-catching visual experience. Download Overall Growth Dashboard Post DSDM Implementation Integration Of Dynamic System To Enhance Processes Designs PDF to deliver an impeccable presentation. These templates will make your job of preparing presentations much quicker, yet still, maintain a high level of quality. Slidegeeks has experienced researchers who prepare these templates and write high-quality content for you. Later on, you can personalize the content by editing the Overall Growth Dashboard Post DSDM Implementation Integration Of Dynamic System To Enhance Processes Designs PDF.
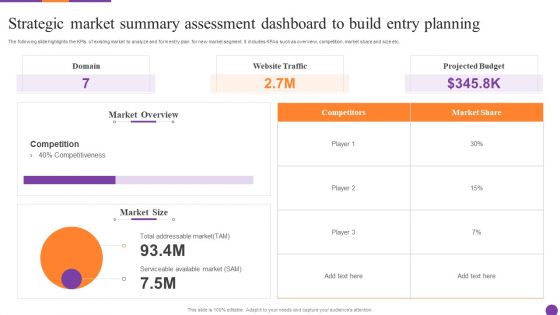
Strategic Market Summary Assessment Dashboard To Build Entry Planning Ppt Layouts Background Image PDF
The following slide highlights the KPIs of existing market to analyze and form entry plan for new market segment. It includes KPAs such as overview, competition, market share and size etc. Persuade your audience using this Strategic Market Summary Assessment Dashboard To Build Entry Planning Ppt Layouts Background Image PDF. This PPT design covers one stages, thus making it a great tool to use. It also caters to a variety of topics including Market Overview, Website Traffic, Projected Budget. Download this PPT design now to present a convincing pitch that not only emphasizes the topic but also showcases your presentation skills.
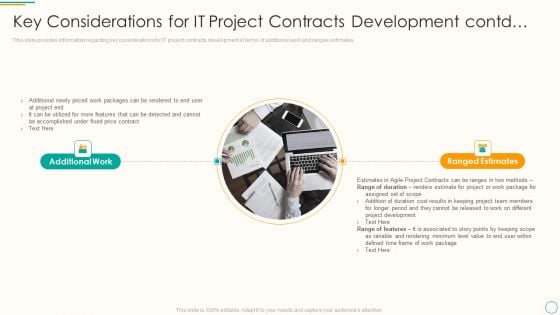
Critical Components Of Project Management IT Key Considerations For IT Project Contracts Development Contd Inspiration PDF
This slide provides information regarding key considerations for IT project contracts development in terms of additional work and ranges estimates. Presenting critical components of project management it determine user persona for better client understanding inspiration pdf to provide visual cues and insights. Share and navigate important information on two stages that need your due attention. This template can be used to pitch topics like merging of teams, performance and quality metrics, parallel testing. In addtion, this PPT design contains high resolution images, graphics, etc, that are easily editable and available for immediate download.

Predictive Maintained Dashboard To Determine Engine Details Optimizing Inventory Management IoT SS V
This slide provides an overview of the predictive maintenance dashboard used to track engine status. The dashboard includes normal, warning and critical engines, optimal condition, etc. Explore a selection of the finest Predictive Maintained Dashboard To Determine Engine Details Optimizing Inventory Management IoT SS V here. With a plethora of professionally designed and pre-made slide templates, you can quickly and easily find the right one for your upcoming presentation. You can use our Predictive Maintained Dashboard To Determine Engine Details Optimizing Inventory Management IoT SS V to effectively convey your message to a wider audience. Slidegeeks has done a lot of research before preparing these presentation templates. The content can be personalized and the slides are highly editable. Grab templates today from Slidegeeks. This slide provides an overview of the predictive maintenance dashboard used to track engine status. The dashboard includes normal, warning and critical engines, optimal condition, etc.
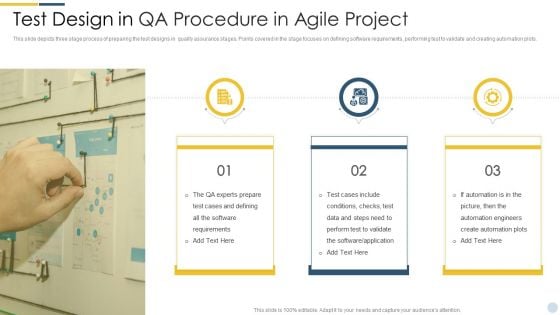
Quality Assurance Procedure In Agile Project Test Design In Qa Procedure In Agile Project Information PDF
This slide depicts three stage process of preparing the test designs in quality assurance stages. Points covered in the stage focuses on defining software requirements, performing test to validate and creating automation plots. This is a quality assurance procedure in agile project test design in qa procedure in agile project information pdf template with various stages. Focus and dispense information on three stages using this creative set, that comes with editable features. It contains large content boxes to add your information on topics like the qa experts prepare test cases, test cases include conditions, checks, test data, automation engineers create automation plots. You can also showcase facts, figures, and other relevant content using this PPT layout. Grab it now.
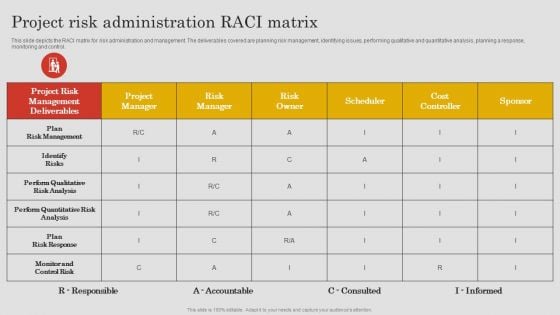
Project Risk Management And Reduction Project Risk Administration Raci Matrix Download PDF
This slide depicts the RACI matrix for risk administration and management. The deliverables covered are planning risk management, identifying issues, performing qualitative and quantitative analysis, planning a response, monitoring and control. The Project Risk Management And Reduction Project Risk Administration Raci Matrix Download PDF is a compilation of the most recent design trends as a series of slides. It is suitable for any subject or industry presentation, containing attractive visuals and photo spots for businesses to clearly express their messages. This template contains a variety of slides for the user to input data, such as structures to contrast two elements, bullet points, and slides for written information. Slidegeeks is prepared to create an impression.
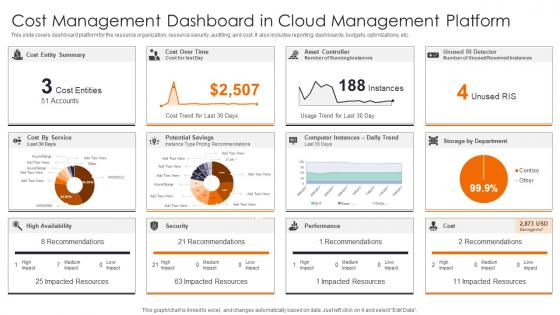
Cost Management Dashboard Enhancing Workload Efficiency Through Cloud Architecture Pictures Pdf
This slide covers dashboard platform for the resource organization, resource security, auditing, and cost. It also includes reporting, dashboards, budgets, optimizations, etc. Explore a selection of the finest Cost Management Dashboard Enhancing Workload Efficiency Through Cloud Architecture Pictures Pdf here. With a plethora of professionally designed and pre made slide templates, you can quickly and easily find the right one for your upcoming presentation. You can use our Cost Management Dashboard Enhancing Workload Efficiency Through Cloud Architecture Pictures Pdf to effectively convey your message to a wider audience. Slidegeeks has done a lot of research before preparing these presentation templates. The content can be personalized and the slides are highly editable. Grab templates today from Slidegeeks. This slide covers dashboard platform for the resource organization, resource security, auditing, and cost. It also includes reporting, dashboards, budgets, optimizations, etc.
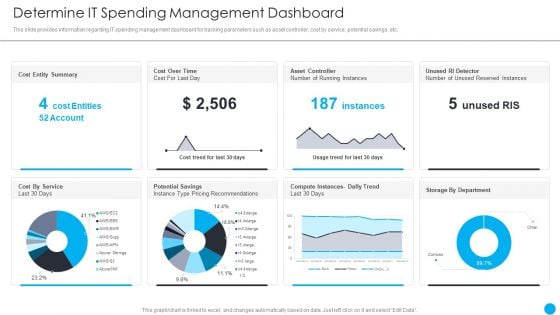
Cios Methodologies To Improve IT Spending Determine It Spending Management Dashboard Professional PDF
This slide provides information regarding IT spending management dashboard for tracking parameters such as asset controller, cost by service, potential savings, etc. Deliver and pitch your topic in the best possible manner with this Cios Methodologies To Improve IT Spending Determine It Spending Management Dashboard Professional PDF Use them to share invaluable insights on Allocated Budget, Across Portfolios, Estimated Cost and impress your audience. This template can be altered and modified as per your expectations. So, grab it now.
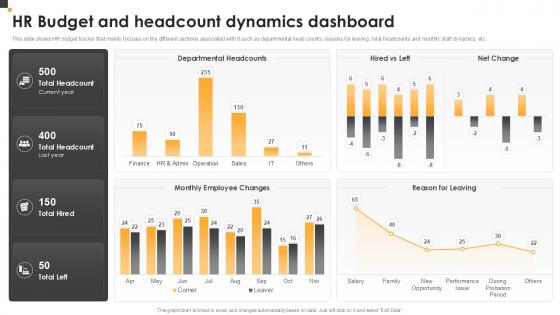
HR Budget And Headcount Dynamics Dashboard HR Budget Planning Ppt Slide
There are so many reasons you need a HR Budget And Headcount Dynamics Dashboard HR Budget Planning Ppt Slide. The first reason is you can not spend time making everything from scratch, Thus, Slidegeeks has made presentation templates for you too. You can easily download these templates from our website easily. This HR Budget Tracker slide provides a comprehensive overview of various key HR metrics, including departmental headcounts, reasons for employee departures, total staff count, and monthly staff dynamics. It is designed to help HR professionals efficiently monitor and manage personnel-related costs, providing valuable insights into workforce changes and trends.
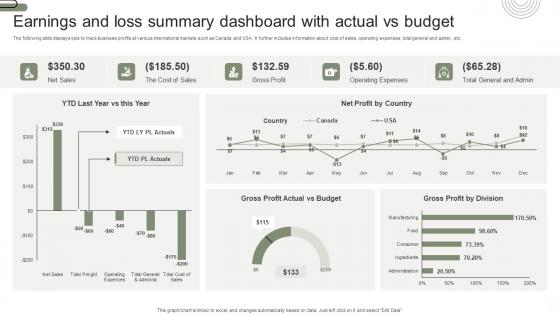
Earnings And Loss Summary Dashboard With Actual Vs Budget Pictures Pdf
The following slide displays kpis to track business profits at various international markets such as Canada and USA. It further includes information about cost of sales, operating expenses, total general and admin, etc. Showcasing this set of slides titled Earnings And Loss Summary Dashboard With Actual Vs Budget Pictures Pdf. The topics addressed in these templates are Earnings And Loss, Summary Dashboard, Actual Vs Budget. All the content presented in this PPT design is completely editable. Download it and make adjustments in color, background, font etc. as per your unique business setting. The following slide displays kpis to track business profits at various international markets such as Canada and USA. It further includes information about cost of sales, operating expenses, total general and admin, etc.
Forecast Analysis Technique IT Predictive Modeling Model Performance Tracking Dashboard Brochure PDF
This slide represents the predictive analytics model performance tracking dashboard, and it covers the details of total visitors, total buyers, total products added to the cart, filters by date and category, visitors to clients conversion rate, and so on. There are so many reasons you need a Forecast Analysis Technique IT Predictive Modeling Model Performance Tracking Dashboard Brochure PDF. The first reason is you can not spend time making everything from scratch, Thus, Slidegeeks has made presentation templates for you too. You can easily download these templates from our website easily.
Effective Product Adaptation Dashboard Tracking Influencer Marketing Campaign Performance Diagrams PDF
If you are looking for a format to display your unique thoughts, then the professionally designed Effective Product Adaptation Dashboard Tracking Influencer Marketing Campaign Performance Diagrams PDF is the one for you. You can use it as a Google Slides template or a PowerPoint template. Incorporate impressive visuals, symbols, images, and other charts. Modify or reorganize the text boxes as you desire. Experiment with shade schemes and font pairings. Alter, share or cooperate with other people on your work. Download Effective Product Adaptation Dashboard Tracking Influencer Marketing Campaign Performance Diagrams PDF and find out how to give a successful presentation. Present a perfect display to your team and make your presentation unforgettable. This slide represents a dashboard monitoring the performance of local influencer marketing campaigns to promote the product in the target market. It tracks KPIs such as, post, Instagram impressions, likes, comments, visitor calculation, campaign insights, and top performers.
Leveraging Logistics Automation Dashboard For Tracking Impact Of Procurement Ideas Pdf
This slide covers the dashboard for analysing procurement performance after automation. It include KPIs such as on time delivery, percentage of returns, compliance index percentage, procurement ROI, cost saving, budget spent on training, etc. Slidegeeks is here to make your presentations a breeze with Leveraging Logistics Automation Dashboard For Tracking Impact Of Procurement Ideas Pdf With our easy to use and customizable templates, you can focus on delivering your ideas rather than worrying about formatting. With a variety of designs to choose from, you are sure to find one that suits your needs. And with animations and unique photos, illustrations, and fonts, you can make your presentation pop. So whether you are giving a sales pitch or presenting to the board, make sure to check out Slidegeeks first. This slide covers the dashboard for analysing procurement performance after automation. It include KPIs such as on time delivery, percentage of returns, compliance index percentage, procurement ROI, cost saving, budget spent on training, etc.
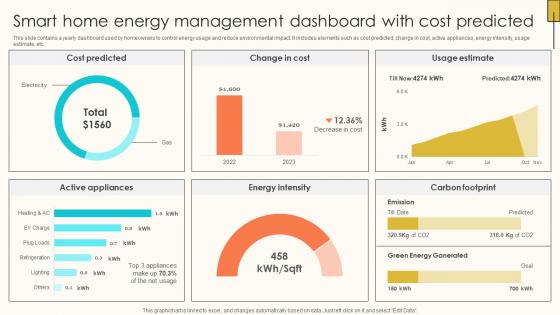
Smart Home Energy Management Dashboard Internet Of Things Solutions To Enhance Energy IoT SS V
This slide contains a yearly dashboard used by homeowners to control energy usage and reduce environmental impact. It includes elements such as cost predicted, change in cost, active appliances, energy intensity, usage estimate, etc. Explore a selection of the finest Smart Home Energy Management Dashboard Internet Of Things Solutions To Enhance Energy IoT SS V here. With a plethora of professionally designed and pre-made slide templates, you can quickly and easily find the right one for your upcoming presentation. You can use our Smart Home Energy Management Dashboard Internet Of Things Solutions To Enhance Energy IoT SS V to effectively convey your message to a wider audience. Slidegeeks has done a lot of research before preparing these presentation templates. The content can be personalized and the slides are highly editable. Grab templates today from Slidegeeks. This slide contains a yearly dashboard used by homeowners to control energy usage and reduce environmental impact. It includes elements such as cost predicted, change in cost, active appliances, energy intensity, usage estimate, etc.
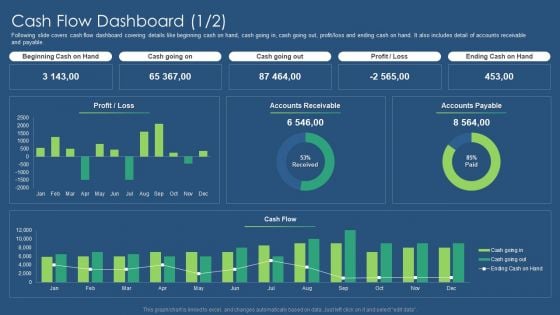
Sustainability Calculation With KPI Cash Flow Dashboard Cash Designs PDF Rules PDF
Deliver an awe inspiring pitch with this creative sustainability calculation with kpi customer satisfaction dashboard target professional pdf bundle. Topics like customer satisfaction dashboard can be discussed with this completely editable template. It is available for immediate download depending on the needs and requirements of the user.
Managing It Services Spending Tracking Dashboard Technological Innovation Playbook Designs Pdf
This slide provides information regarding the management of the digital services performance and IT spending tracking dashboard in terms of ROI, spend vs. budget, IT costs software, hardware, personnel and goals, IT spending in terms of revenues, etc. Do you have an important presentation coming up Are you looking for something that will make your presentation stand out from the rest Look no further than Managing It Services Spending Tracking Dashboard Technological Innovation Playbook Designs Pdf. With our professional designs, you can trust that your presentation will pop and make delivering it a smooth process. And with Slidegeeks, you can trust that your presentation will be unique and memorable. So why wait Grab Managing It Services Spending Tracking Dashboard Technological Innovation Playbook Designs Pdf today and make your presentation stand out from the rest This slide provides information regarding the management of the digital services performance and IT spending tracking dashboard in terms of ROI, spend vs. budget, IT costs software, hardware, personnel and goals, IT spending in terms of revenues, etc.
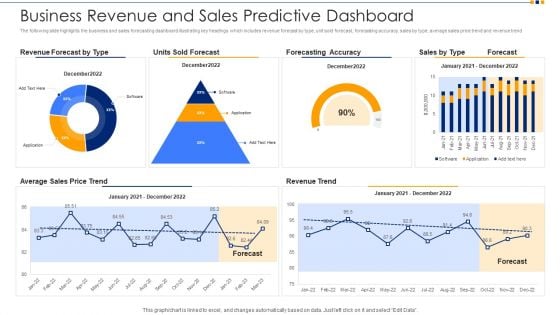
Business Revenue And Sales Predictive Dashboard Ppt Inspiration Background Designs PDF
The following slide highlights the business and sales forecasting dashboard illustrating key headings which includes revenue forecast by type, unit sold forecast, forecasting accuracy, sales by type, average sales price trend and revenue trend. Pitch your topic with ease and precision using this business revenue and sales predictive dashboard ppt inspiration background designs pdf. This layout presents information on revenue forecast by type, units sold forecast, forecasting accuracy, average sales price trend, revenue trend. It is also available for immediate download and adjustment. So, changes can be made in the color, design, graphics or any other component to create a unique layout.
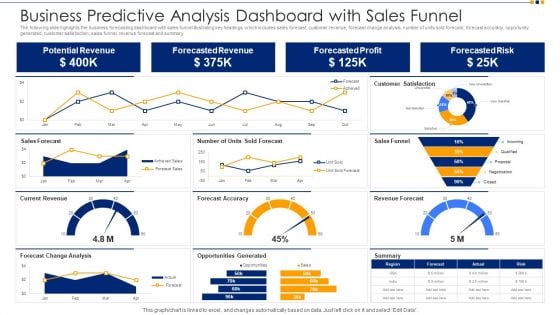
Business Predictive Analysis Dashboard With Sales Funnel Ppt Show Images PDF
The following slide highlights the business forecasting dashboard with sales funnel illustrating key headings which includes sales forecast, customer revenue, forecast change analysis, number of units sold forecast, forecast accuracy, opportunity generated, customer satisfaction, sales funnel, revenue forecast and summary. Pitch your topic with ease and precision using this business predictive analysis dashboard with sales funnel ppt show images pdf. This layout presents information on potential revenue, forecasted revenue, forecasted profit, forecasted risk. It is also available for immediate download and adjustment. So, changes can be made in the color, design, graphics or any other component to create a unique layout.
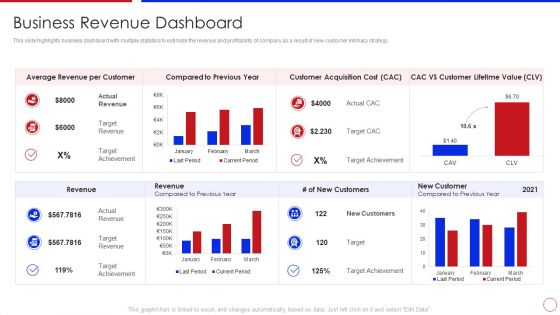
Strategy To Enhance Buyer Intimacy Business Revenue Dashboard Ppt Designs Download PDF
This slide highlights business dashboard with multiple statistics to estimate the revenue and profitability of company as a result of new customer intimacy strategy. Deliver an awe inspiring pitch with this creative strategy to enhance buyer intimacy business revenue dashboard ppt designs download pdf bundle. Topics like business revenue dashboard can be discussed with this completely editable template. It is available for immediate download depending on the needs and requirements of the user.
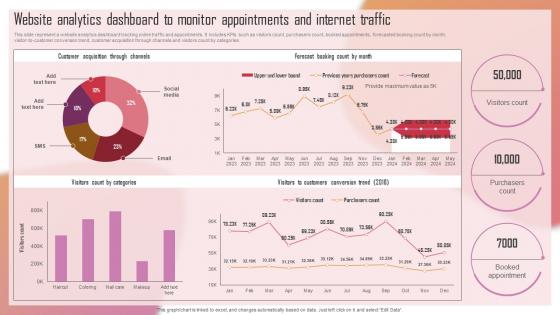
Customizing The Salon Experience Website Analytics Dashboard To Monitor Appointments Strategy SS V
This slide represent a website analytics dashboard tracking online traffic and appointments. It includes KPIs such as visitors count, purchasers count, booked appointments, forecasted booking count by month, visitor-to-customer conversion trend, customer acquisition through channels and visitors count by categories. Retrieve professionally designed Customizing The Salon Experience Website Analytics Dashboard To Monitor Appointments Strategy SS V to effectively convey your message and captivate your listeners. Save time by selecting pre-made slideshows that are appropriate for various topics, from business to educational purposes. These themes come in many different styles, from creative to corporate, and all of them are easily adjustable and can be edited quickly. Access them as PowerPoint templates or as Google Slides themes. You do not have to go on a hunt for the perfect presentation because Slidegeeks got you covered from everywhere. This slide represent a website analytics dashboard tracking online traffic and appointments. It includes KPIs such as visitors count, purchasers count, booked appointments, forecasted booking count by month, visitor-to-customer conversion trend, customer acquisition through channels and visitors count by categories.
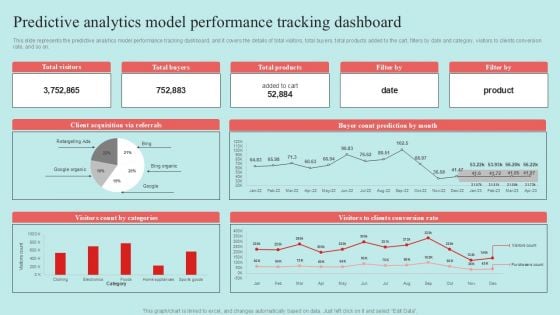
Predictive Data Model Predictive Analytics Model Performance Tracking Dashboard Themes PDF
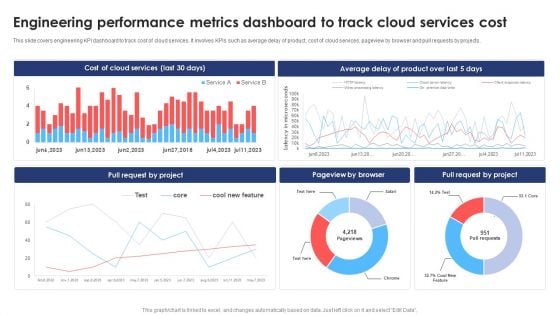
Engineering Performance Metrics Dashboard To Track Cloud Services Cost Clipart PDF
This slide covers engineering KPI dashboard to track cost of cloud services. It involves KPIs such as average delay of product, cost of cloud services, pageview by browser and pull requests by projects. Showcasing this set of slides titled Engineering Performance Metrics Dashboard To Track Cloud Services Cost Clipart PDF. The topics addressed in these templates are Cost Of Cloud Services, Average, Product. All the content presented in this PPT design is completely editable. Download it and make adjustments in color, background, font etc. as per your unique business setting.
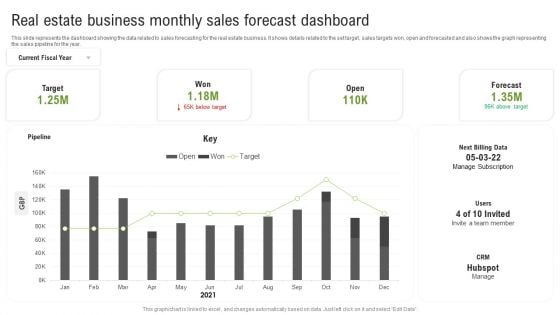
Real Estate Business Monthly Sales Forecast Dashboard Ppt Layouts Grid PDF
This slide represents the dashboard showing the data related to sales forecasting for the real estate business. It shows details related to the set target, sales targets won, open and forecasted and also shows the graph representing the sales pipeline for the year. Showcasing this set of slides titled Real Estate Business Monthly Sales Forecast Dashboard Ppt Layouts Grid PDF. The topics addressed in these templates are Next Billing Data, Pipeline, Current Fiscal Year. All the content presented in this PPT design is completely editable. Download it and make adjustments in color, background, font etc. as per your unique business setting.
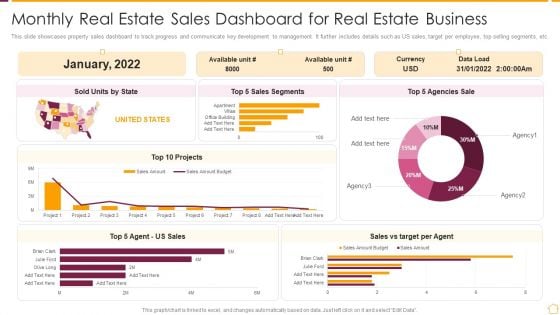
Monthly Real Estate Sales Dashboard For Real Estate Business Ppt PowerPoint Presentation File Skills PDF
This slide showcases property sales dashboard to track progress and communicate key development to management. It further includes details such as US sales, target per employee, top selling segments, etc. Showcasing this set of slides titled Monthly Real Estate Sales Dashboard For Real Estate Business Ppt PowerPoint Presentation File Skills PDF. The topics addressed in these templates are Top 5 Sales Segments, Sold Units By State, Top 10 Projects, Sales Vs Target Per Agent. All the content presented in this PPT design is completely editable. Download it and make adjustments in color, background, font etc. as per your unique business setting.
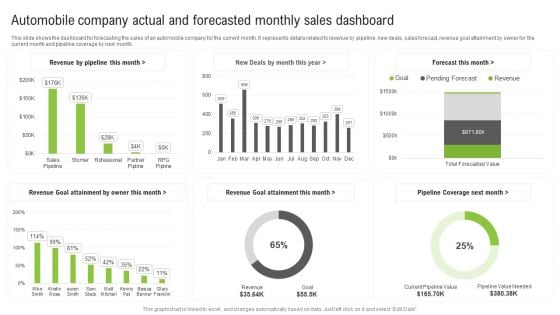
Automobile Company Actual And Forecasted Monthly Sales Dashboard Ppt Infographic Template Aids PDF
This slide shows the dashboard for forecasting the sales of an automobile company for the current month. It represents details related to revenue by pipeline, new deals, sales forecast, revenue goal attainment by owner for the current month and pipeline coverage by next month. Showcasing this set of slides titled Automobile Company Actual And Forecasted Monthly Sales Dashboard Ppt Infographic Template Aids PDF. The topics addressed in these templates are Forecast Month, Revenue Goal Attainment, Revenue Goal Attainment. All the content presented in this PPT design is completely editable. Download it and make adjustments in color, background, font etc. as per your unique business setting.
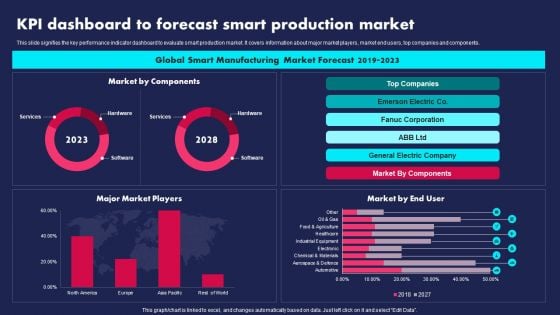
KPI Dashboard To Forecast Smart Production Market Ppt PowerPoint Presentation Gallery Visual Aids PDF
This slide signifies the key performance indicator dashboard to evaluate smart production market. It covers information about major market players, market end users, top companies and components. Pitch your topic with ease and precision using this KPI Dashboard To Forecast Smart Production Market Ppt PowerPoint Presentation Gallery Visual Aids PDF. This layout presents information on Global Smart Manufacturing, Market Forecast, 2019 To 2023. It is also available for immediate download and adjustment. So, changes can be made in the color, design, graphics or any other component to create a unique layout.
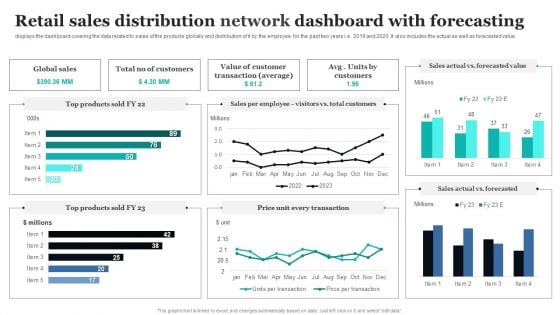
Retail Sales Distribution Network Dashboard With Forecasting Ppt PowerPoint Presentation File Design Templates PDF
Pitch your topic with ease and precision using this Retail Sales Distribution Network Dashboard With Forecasting Ppt PowerPoint Presentation File Design Templates PDF. This layout presents information on Global Sales, Value Customer, Total Customers. It is also available for immediate download and adjustment. So, changes can be made in the color, design, graphics or any other component to create a unique layout.

Enterprise Problem Solving And Intellect Business Intelligence KPI Dashboard Growth Ppt PowerPoint Presentation Model Images PDF
Presenting this set of slides with name enterprise problem solving and intellect business intelligence kpi dashboard growth ppt powerpoint presentation model images pdf. The topics discussed in these slides are sales representative, delighted nps score, standard customers, growth rate, ca customer locations, net income vs projections, revenue type, top customer locations, customer distribution. This is a completely editable PowerPoint presentation and is available for immediate download. Download now and impress your audience.
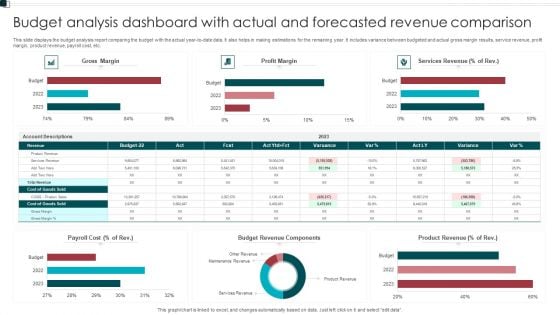
Budget Analysis Dashboard With Actual And Forecasted Revenue Comparison Structure PDF
This slide displays the budget analysis report comparing the budget with the actual year to date data. It also helps in making estimations for the remaining year. It includes variance between budgeted and actual gross margin results, service revenue, profit margin, product revenue, payroll cost, etc. Pitch your topic with ease and precision using this Budget Analysis Dashboard With Actual And Forecasted Revenue Comparison Structure PDF. This layout presents information on Payroll Cost, Budget Revenue Components, Product Revenue. It is also available for immediate download and adjustment. So, changes can be made in the color, design, graphics or any other component to create a unique layout.
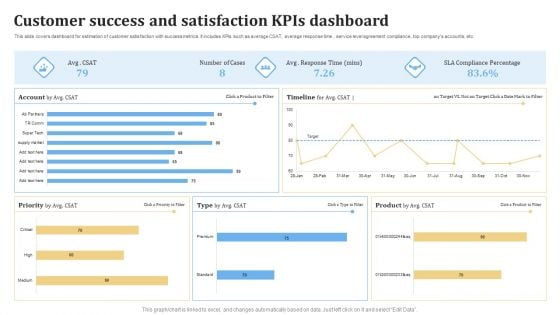
Customer Success And Satisfaction KPIS Dashboard Ppt PowerPoint Presentation Outline Visuals PDF
This slide covers dashboard for estimation of customer satisfaction with success metrics. It includes KPIs such as average CSAT, average response time , service level agreement compliance, top companys accounts, etc. Pitch your topic with ease and precision using this Customer Success And Satisfaction KPIS Dashboard Ppt PowerPoint Presentation Outline Visuals PDF. This layout presents information on Customer Success, Satisfaction KPIs Dashboard. It is also available for immediate download and adjustment. So, changes can be made in the color, design, graphics or any other component to create a unique layout.
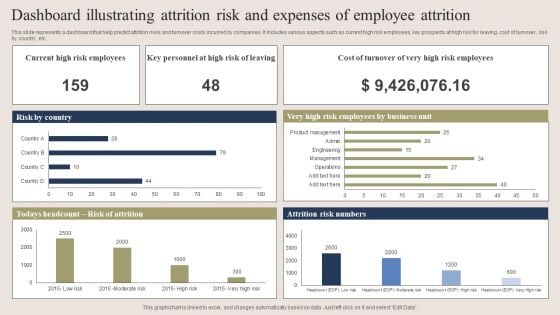
Dashboard Illustrating Attrition Risk And Expenses Of Employee Attrition Clipart PDF
This slide represents a dashboard that help predict attrition risks and turnover costs incurred by companies. It includes various aspects such as current high risk employees, key prospects at high risk for leaving, cost of turnover, risk by country, etc. Pitch your topic with ease and precision using this Dashboard Illustrating Attrition Risk And Expenses Of Employee Attrition Clipart PDF. This layout presents information on Dashboard Illustrating Attrition Risk, Expenses Of Employee Attrition . It is also available for immediate download and adjustment. So, changes can be made in the color, design, graphics or any other component to create a unique layout.


 Continue with Email

 Home
Home


