Project Portfolio Dashboard
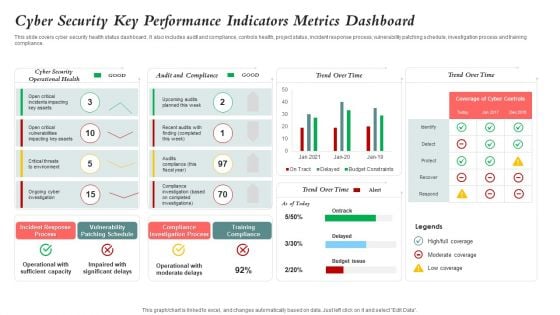
Cyber Security Key Performance Indicators Metrics Dashboard Mockup PDF
This slide covers cyber security health status dashboard . It also includes audit and compliance, controls health, project status, incident response process, vulnerability patching schedule, investigation process and training compliance. Pitch your topic with ease and precision using this Cyber Security Key Performance Indicators Metrics Dashboard Mockup PDF. This layout presents information on Cyber Security, Vulnerability Patching Schedule, Compliance Investigation Process. It is also available for immediate download and adjustment. So, changes can be made in the color, design, graphics or any other component to create a unique layout.
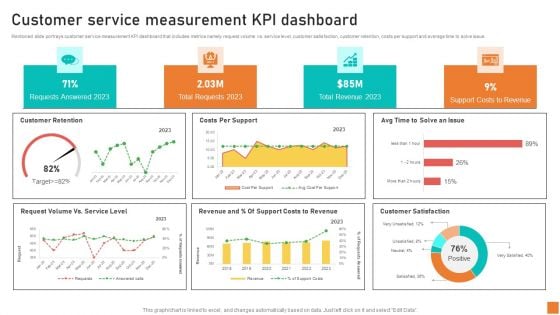
Customer Service Measurement KPI Dashboard Ppt Infographics Themes PDF
Mentioned slide portrays customer service measurement KPI dashboard that includes metrics namely request volume vs. service level, customer satisfaction, customer retention, costs per support and average time to solve issue. If your project calls for a presentation, then Slidegeeks is your go-to partner because we have professionally designed, easy-to-edit templates that are perfect for any presentation. After downloading, you can easily edit Customer Service Measurement KPI Dashboard Ppt Infographics Themes PDF and make the changes accordingly. You can rearrange slides or fill them with different images. Check out all the handy templates
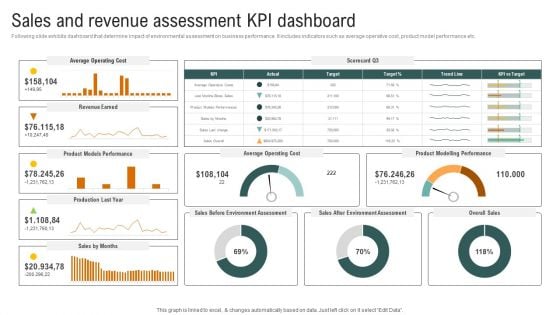
Sales And Revenue Assessment Kpi Dashboard Brochure PDF
Following slide exhibits dashboard that determine impact of environmental assessment on business performance. It includes indicators such as average operative cost, product model performance etc. If your project calls for a presentation, then Slidegeeks is your go-to partner because we have professionally designed, easy-to-edit templates that are perfect for any presentation. After downloading, you can easily edit Sales And Revenue Assessment Kpi Dashboard Brochure PDF and make the changes accordingly. You can rearrange slides or fill them with different images. Check out all the handy templates
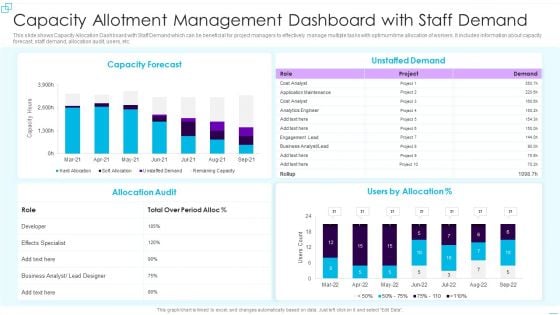
Capacity Allotment Management Dashboard With Staff Demand Rules PDF
This slide shows Capacity Allocation Dashboard with Staff Demand which can be beneficial for project managers to effectively manage multiple tasks with optimum time allocation of workers. It includes information about capacity forecast, staff demand, allocation audit, users, etc. Showcasing this set of slides titled Capacity Allotment Management Dashboard With Staff Demand Rules PDF. The topics addressed in these templates are Capacity Forecast, Allocation Audit, Unstaffed Demand. All the content presented in this PPT design is completely editable. Download it and make adjustments in color, background, font etc. as per your unique business setting.
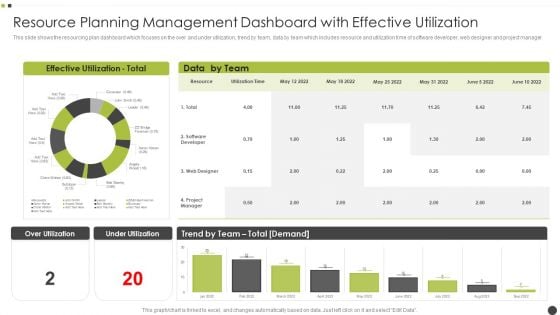
Resource Planning Management Dashboard With Effective Utilization Mockup PDF
This slide shows the resourcing plan dashboard which focuses on the over and under utilization, trend by team, data by team which includes resource and utilization time of software developer, web designer and project manager. Pitch your topic with ease and precision using this Resource Planning Management Dashboard With Effective Utilization Mockup PDF. This layout presents information on Web Designer, Software Developer, Team. It is also available for immediate download and adjustment. So, changes can be made in the color, design, graphics or any other component to create a unique layout.
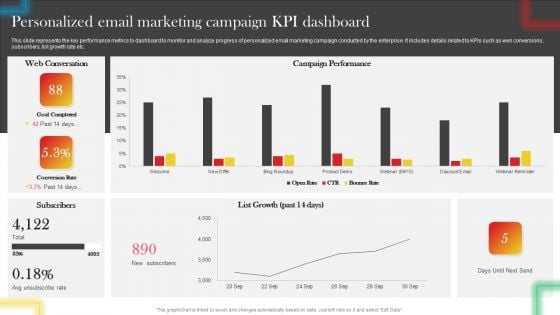
Personalized Email Marketing Campaign KPI Dashboard Inspiration PDF
This slide represents the key performance metrics to dashboard to monitor and analyze progress of personalized email marketing campaign conducted by the enterprise. It includes details related to KPIs such as wen conversions, subscribers, list growth rate etc. If your project calls for a presentation, then Slidegeeks is your go-to partner because we have professionally designed, easy-to-edit templates that are perfect for any presentation. After downloading, you can easily edit Personalized Email Marketing Campaign KPI Dashboard Inspiration PDF and make the changes accordingly. You can rearrange slides or fill them with different images. Check out all the handy templates
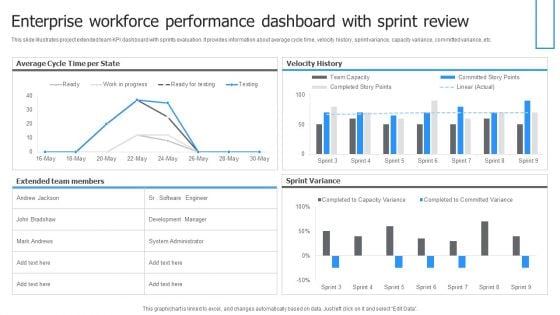
Enterprise Workforce Performance Dashboard With Sprint Review Themes PDF
This slide illustrates project extended team KPI dashboard with sprints evaluation. It provides information about average cycle time, velocity history, sprint variance, capacity variance, committed variance, etc. Showcasing this set of slides titled Enterprise Workforce Performance Dashboard With Sprint Review Themes PDF. The topics addressed in these templates are Velocity History, Sprint Variance, Average Cycle, Time Per State. All the content presented in this PPT design is completely editable. Download it and make adjustments in color, background, font etc. as per your unique business setting.
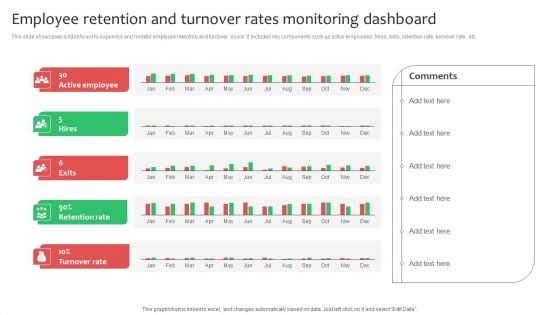
Employee Retention And Turnover Rates Monitoring Dashboard Mockup PDF
This slide showcases a dashboard to supervise and monitor employee retention and turnover score. It includes key components such as active employees, hires, exits, retention rate, turnover rate, etc. If your project calls for a presentation, then Slidegeeks is your go to partner because we have professionally designed, easy to edit templates that are perfect for any presentation. After downloading, you can easily edit Employee Retention And Turnover Rates Monitoring Dashboard Mockup PDF and make the changes accordingly. You can rearrange slides or fill them with different images. Check out all the handy templates
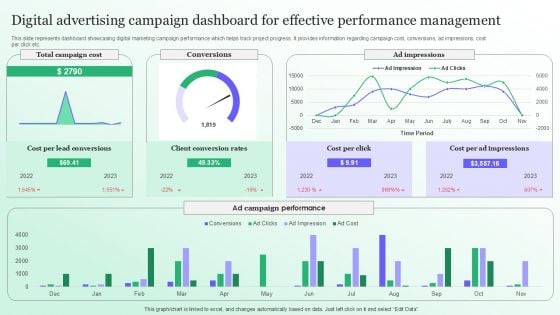
Digital Advertising Campaign Dashboard For Effective Performance Management Sample PDF

Dashboard To Measure Robotic Process Automation Bots Performance Structure PDF
This slide presents a dashboard to measure RPA bots performance in an organization. It includes utilization hours, bot types, average daily utilization, percentage of errors that occurred by bots, and occupied bots by business operations. If your project calls for a presentation, then Slidegeeks is your go-to partner because we have professionally designed, easy-to-edit templates that are perfect for any presentation. After downloading, you can easily edit Dashboard To Measure Robotic Process Automation Bots Performance Structure PDF and make the changes accordingly. You can rearrange slides or fill them with different images. Check out all the handy templates
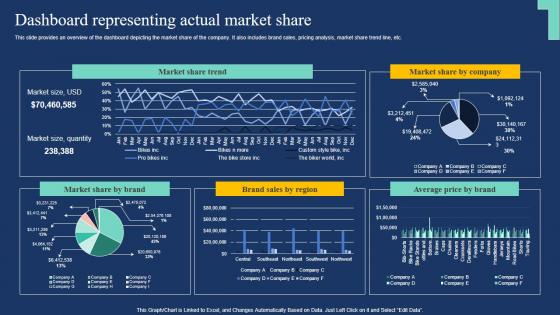
Dashboard Representing Actual Market Share Market Expansion Tactic Topics Pdf
This slide provides an overview of the dashboard depicting the market share of the company. It also includes brand sales, pricing analysis, market share trend line, etc. If your project calls for a presentation, then Slidegeeks is your go-to partner because we have professionally designed, easy-to-edit templates that are perfect for any presentation. After downloading, you can easily edit Dashboard Representing Actual Market Share Market Expansion Tactic Topics Pdf and make the changes accordingly. You can rearrange slides or fill them with different images. Check out all the handy templates This slide provides an overview of the dashboard depicting the market share of the company. It also includes brand sales, pricing analysis, market share trend line, etc.
Enhancing Global Presence Dashboard For Tracking Post Expansion Formats Pdf
This slide covers the dashboard for analyzing fast food business sales by region. It includes KPIs such as sales, sales target, target achievement, gross profit, gross profit margin, sales by channels, sales growth, etc.If your project calls for a presentation, then Slidegeeks is your go-to partner because we have professionally designed, easy-to-edit templates that are perfect for any presentation. After downloading, you can easily edit Enhancing Global Presence Dashboard For Tracking Post Expansion Formats Pdf and make the changes accordingly. You can rearrange slides or fill them with different images. Check out all the handy templates This slide covers the dashboard for analyzing fast food business sales by region. It includes KPIs such as sales, sales target, target achievement, gross profit, gross profit margin, sales by channels, sales growth, etc.
CASB 2 0 IT CASB Performance Tracking Dashboard
This slide outlines the performance tracking dashboard for CASB deployment. The purpose of this slide is to showcase the status of various applications, IP addresses, users, machines, and web traffic. It also includes cloud discovery open alerts, risk levels, and top entities. If your project calls for a presentation, then Slidegeeks is your go-to partner because we have professionally designed, easy-to-edit templates that are perfect for any presentation. After downloading, you can easily edit CASB 2 0 IT CASB Performance Tracking Dashboard and make the changes accordingly. You can rearrange slides or fill them with different images. Check out all the handy templates This slide outlines the performance tracking dashboard for CASB deployment. The purpose of this slide is to showcase the status of various applications, IP addresses, users, machines, and web traffic. It also includes cloud discovery open alerts, risk levels, and top entities.
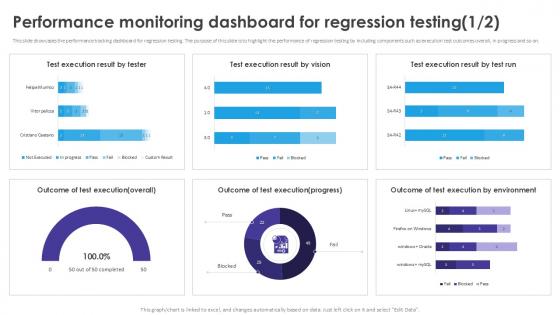
Performance Monitoring Dashboard Automated Regression Testing And Achieving PPT Example
This slide showcases the performance tracking dashboard for regression testing. The purpose of this slide is to highlight the performance of regression testing by including components such as execution test outcomes overall, in progress and so on. If your project calls for a presentation, then Slidegeeks is your go-to partner because we have professionally designed, easy-to-edit templates that are perfect for any presentation. After downloading, you can easily edit Performance Monitoring Dashboard Automated Regression Testing And Achieving PPT Example and make the changes accordingly. You can rearrange slides or fill them with different images. Check out all the handy templates This slide showcases the performance tracking dashboard for regression testing. The purpose of this slide is to highlight the performance of regression testing by including components such as execution test outcomes overall, in progress and so on.
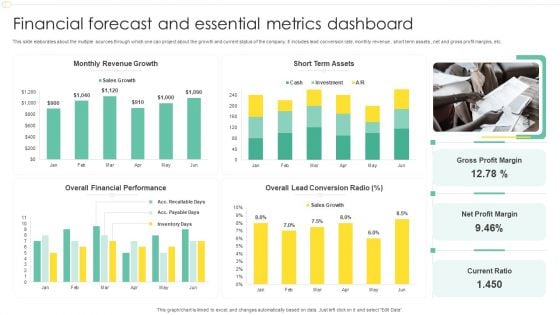
Financial Forecast And Essential Metrics Dashboard Ppt File Show PDF
This slide elaborates about the multiple sources through which one can project about the growth and current status of the company. It includes lead conversion rate, monthly revenue , short term assets , net and gross profit margins, etc. Pitch your topic with ease and precision using this Financial Forecast And Essential Metrics Dashboard Ppt File Show PDF. This layout presents information on Monthly Revenue Growth, Short Term Assets, Overall Financial Performance, Net Profit Margin. It is also available for immediate download and adjustment. So, changes can be made in the color, design, graphics or any other component to create a unique layout.
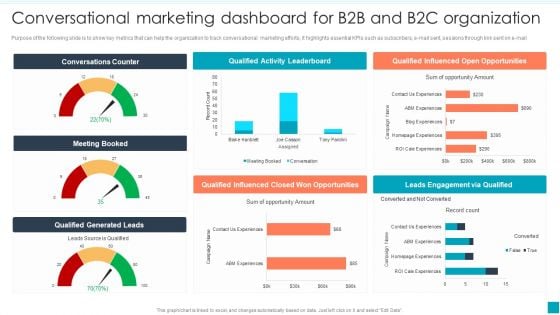
Conversational Marketing Dashboard For B2B And B2C Organization Mockup PDF
Purpose of the following slide is to show key metrics that can help the organization to track conversational marketing efforts, it highlights essential KPIs such as subscribers, e-mail sent, sessions through link sent on e-mail. If your project calls for a presentation, then Slidegeeks is your go-to partner because we have professionally designed, easy-to-edit templates that are perfect for any presentation. After downloading, you can easily edit Conversational Marketing Dashboard For B2B And B2C Organization Mockup PDF and make the changes accordingly. You can rearrange slides or fill them with different images. Check out all the handy templates.
Workforce Productivity Tracking Report Kpi Dashboard Icons PDF
The following slide presents the KPAs of project work stream for transparency and better decision making. It includes KPIs such as work stream status, priority check, planned vs actual budget etc. Showcasing this set of slides titled Workforce Productivity Tracking Report Kpi Dashboard Icons PDF. The topics addressed in these templates are Initiation Meeting, Resource Assessment, Technological Analysis. All the content presented in this PPT design is completely editable. Download it and make adjustments in color, background, font etc. as per your unique business setting.
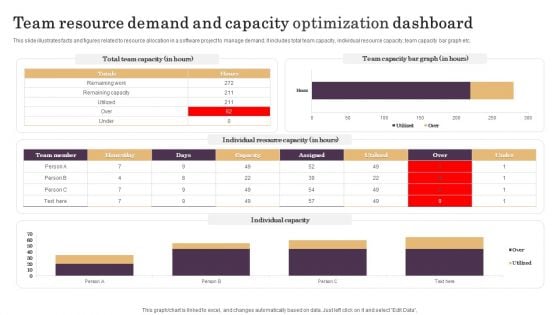
Team Resource Demand And Capacity Optimization Dashboard Demonstration PDF
This slide illustrates facts and figures related to resource allocation in a software project to manage demand. It includes total team capacity, individual resource capacity, team capacity bar graph etc. Showcasing this set of slides titled Team Resource Demand And Capacity Optimization Dashboard Demonstration PDF. The topics addressed in these templates are Individual Resource Capacity, Team Capacity. All the content presented in this PPT design is completely editable. Download it and make adjustments in color, background, font etc. as per your unique business setting.
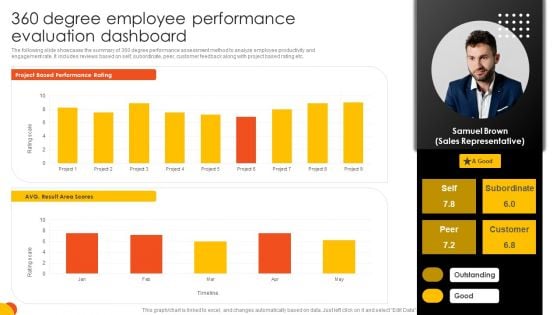
360 Degree Employee Performance Evaluation Dashboard Portrait PDF
The following slide showcases the summary of 360 degree performance assessment method to analyze employee productivity and engagement rate. It includes reviews based on self, subordinate, peer, customer feedback along with project based rating etc. Find a pre designed and impeccable 360 Degree Employee Performance Evaluation Dashboard Portrait PDF. The templates can ace your presentation without additional effort. You can download these easy to edit presentation templates to make your presentation stand out from others. So, what are you waiting for Download the template from Slidegeeks today and give a unique touch to your presentation.
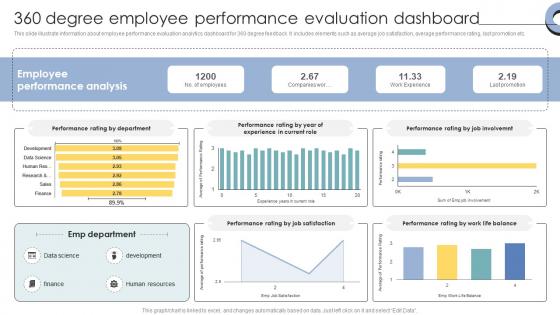
Skill Enhancement Performance 360 Degree Employee Performance Evaluation Dashboard
This slide illustrate information about employee performance evaluation analytics dashboard for 360 degree feedback. It includes elements such as average job satisfaction, average performance rating, last promotion etc. If your project calls for a presentation, then Slidegeeks is your go-to partner because we have professionally designed, easy-to-edit templates that are perfect for any presentation. After downloading, you can easily edit Skill Enhancement Performance 360 Degree Employee Performance Evaluation Dashboard and make the changes accordingly. You can rearrange slides or fill them with different images. Check out all the handy templates This slide illustrate information about employee performance evaluation analytics dashboard for 360 degree feedback. It includes elements such as average job satisfaction, average performance rating, last promotion etc.

KPI Dashboard For Estimating Monthly Cash Flow Infographics Pdf
Following slide demonstrates KPI dashboard to forecast monthly business money flow for cash flow management planning. It includes components such as projected profit before tax, net operating cash flow, net financial cash flow, net investing cash flow, etc. Showcasing this set of slides titled KPI Dashboard For Estimating Monthly Cash Flow Infographics Pdf. The topics addressed in these templates are KPI Dashboard, Estimating Monthly Cash Flow, Net Financial Cash Flow. All the content presented in this PPT design is completely editable. Download it and make adjustments in color, background, font etc. as per your unique business setting. Following slide demonstrates KPI dashboard to forecast monthly business money flow for cash flow management planning. It includes components such as projected profit before tax, net operating cash flow, net financial cash flow, net investing cash flow, etc.
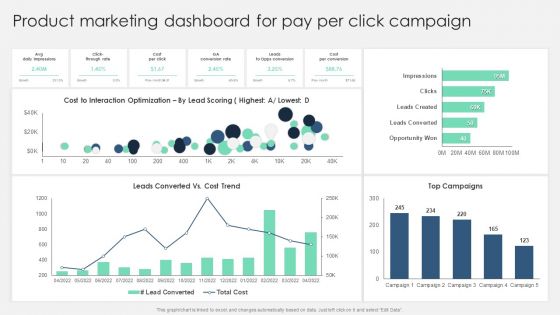
Product Marketing Dashboard For Pay Per Click Campaign Sample PDF
Take your projects to the next level with our ultimate collection of Product Marketing Dashboard For Pay Per Click Campaign Sample PDF. Slidegeeks has designed a range of layouts that are perfect for representing task or activity duration, keeping track of all your deadlines at a glance. Tailor these designs to your exact needs and give them a truly corporate look with your own brand colors they will make your projects stand out from the rest.
Implementing Effective Strategy Staff Training Effectiveness Tracking Dashboard Guidelines PDF
This slide provides information regarding workforce training effectiveness monitoring dashboard. The dashboard includes details such as training cost, cost per participant, number of participants, hours of training, etc. Take your projects to the next level with our ultimate collection of Implementing Effective Strategy Staff Training Effectiveness Tracking Dashboard Guidelines PDF. Slidegeeks has designed a range of layouts that are perfect for representing task or activity duration, keeping track of all your deadlines at a glance. Tailor these designs to your exact needs and give them a truly corporate look with your own brand colors theyll make your projects stand out from the rest.
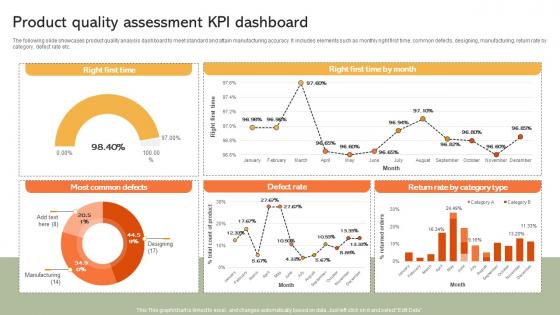
Product Quality Assessment KPI Dashboard Implementing Manufacturing Strategy SS V
The following slide showcases product quality analysis dashboard to meet standard and attain manufacturing accuracy. It includes elements such as monthly right first time, common defects, designing, manufacturing, return rate by category, defect rate etc. Take your projects to the next level with our ultimate collection of Product Quality Assessment KPI Dashboard Implementing Manufacturing Strategy SS V. Slidegeeks has designed a range of layouts that are perfect for representing task or activity duration, keeping track of all your deadlines at a glance. Tailor these designs to your exact needs and give them a truly corporate look with your own brand colors they will make your projects stand out from the rest The following slide showcases product quality analysis dashboard to meet standard and attain manufacturing accuracy. It includes elements such as monthly right first time, common defects, designing, manufacturing, return rate by category, defect rate etc.
Product Branding Performance Tracking Dashboard Effective Brand Maintenance Slides Pdf
This slide provides information regarding product branding performance tracking dashboard in terms of revenues, new customers, customer satisfaction rate. Take your projects to the next level with our ultimate collection of Product Branding Performance Tracking Dashboard Effective Brand Maintenance Slides Pdf Slidegeeks has designed a range of layouts that are perfect for representing task or activity duration, keeping track of all your deadlines at a glance. Tailor these designs to your exact needs and give them a truly corporate look with your own brand colors they well make your projects stand out from the rest. This slide provides information regarding product branding performance tracking dashboard in terms of revenues, new customers, customer satisfaction rate.

The Digital Project Managers Method To Estimate Projects Workflow Efficiency
This slide showcases the method to calculate organizational workflow efficiency and provide the current workflow efficiency of ongoing projects. It includes total cycle time, value added time, wasted activity time etc. The The Digital Project Managers Method To Estimate Projects Workflow Efficiency is a compilation of the most recent design trends as a series of slides. It is suitable for any subject or industry presentation, containing attractive visuals and photo spots for businesses to clearly express their messages. This template contains a variety of slides for the user to input data, such as structures to contrast two elements, bullet points, and slides for written information. Slidegeeks is prepared to create an impression. This slide showcases the method to calculate organizational workflow efficiency and provide the current workflow efficiency of ongoing projects. It includes total cycle time, value added time, wasted activity time etc.
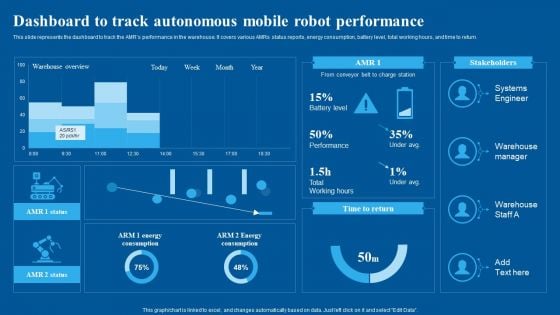
Dashboard To Track Autonomous Mobile Robot Performance Infographics PDF
This slide represents the dashboard to track the AMRs performance in the warehouse. It covers various AMRs status reports, energy consumption, battery level, total working hours, and time to return. Take your projects to the next level with our ultimate collection of Dashboard To Track Autonomous Mobile Robot Performance Infographics PDF. Slidegeeks has designed a range of layouts that are perfect for representing task or activity duration, keeping track of all your deadlines at a glance. Tailor these designs to your exact needs and give them a truly corporate look with your own brand colors they will make your projects stand out from the rest.
Different Brands Performance Tracking Dashboard Ppt Gallery Infographics PDF
This slide provides information regarding different brands performance tracking dashboard in terms of brand metric, brand commitment, advertising metrics, and purchase metrics. Take your projects to the next level with our ultimate collection of Different Brands Performance Tracking Dashboard Ppt Gallery Infographics PDF. Slidegeeks has designed a range of layouts that are perfect for representing task or activity duration, keeping track of all your deadlines at a glance. Tailor these designs to your exact needs and give them a truly corporate look with your own brand colors they will make your projects stand out from the rest.
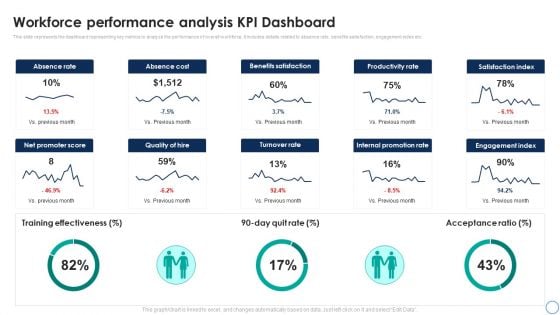
Business Analytics Application Workforce Performance Analysis KPI Dashboard Template PDF
This slide represents the dashboard representing key metrics to analyze the performance of overall workforce. It includes details related to absence rate, benefits satisfaction, engagement index etc. Take your projects to the next level with our ultimate collection of Business Analytics Application Workforce Performance Analysis KPI Dashboard Template PDF. Slidegeeks has designed a range of layouts that are perfect for representing task or activity duration, keeping track of all your deadlines at a glance. Tailor these designs to your exact needs and give them a truly corporate look with your own brand colors theyll make your projects stand out from the rest.
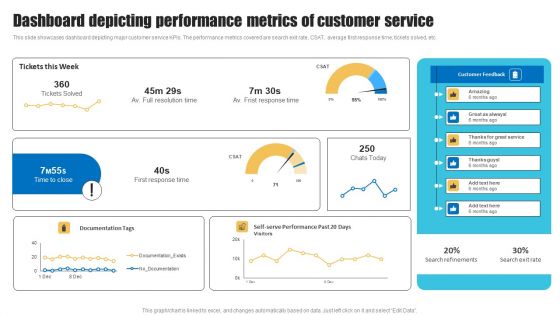
Dashboard Depicting Performance Metrics Of Customer Service Template PDF
This slide showcases dashboard depicting major customer service KPIs. The performance metrics covered are search exit rate, CSAT, average first response time, tickets solved, etc. Take your projects to the next level with our ultimate collection of Dashboard Depicting Performance Metrics Of Customer Service Template PDF. Slidegeeks has designed a range of layouts that are perfect for representing task or activity duration, keeping track of all your deadlines at a glance. Tailor these designs to your exact needs and give them a truly corporate look with your own brand colors they will make your projects stand out from the rest.
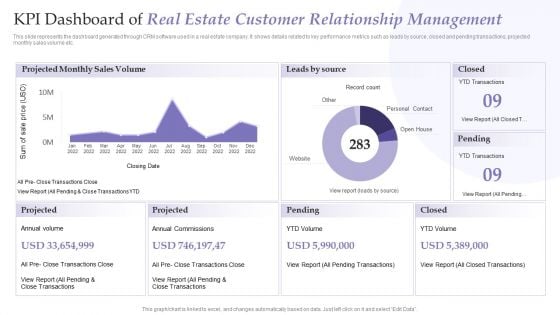
KPI Dashboard Of Real Estate Customer Relationship Management Pictures PDF
This slide represents the dashboard generated through CRM software used in a real estate company. It shows details related to key performance metrics such as leads by source, closed and pending transactions, projected monthly sales volume etc. Showcasing this set of slides titled KPI Dashboard Of Real Estate Customer Relationship Management Pictures PDF. The topics addressed in these templates are Projected Monthly Sales Volume, Leads By Source, Annual Commissions. All the content presented in this PPT design is completely editable. Download it and make adjustments in color, background, font etc. as per your unique business setting.
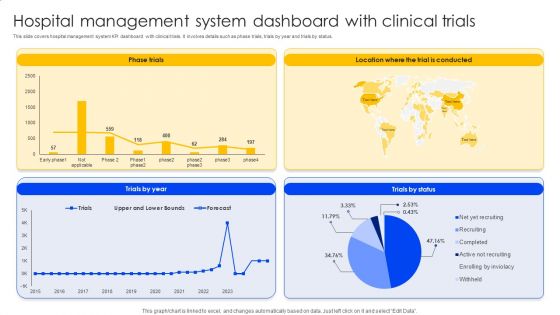
Hospital Management System Dashboard With Clinical Trials Background PDF
This slide covers hospital management system KPI dashboard with clinical trials. It involves details such as phase trials, trials by year and trials by status. Take your projects to the next level with our ultimate collection of Hospital Management System Dashboard With Clinical Trials Background PDF. Slidegeeks has designed a range of layouts that are perfect for representing task or activity duration, keeping track of all your deadlines at a glance. Tailor these designs to your exact needs and give them a truly corporate look with your own brand colors they will make your projects stand out from the rest.
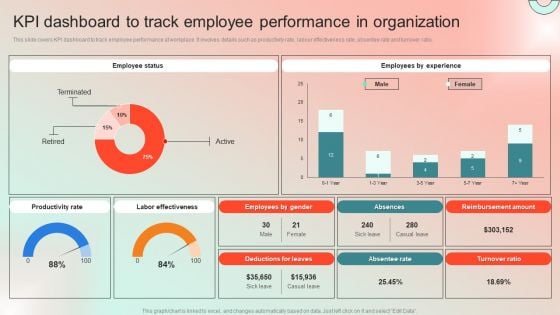
KPI Dashboard To Track Employee Performance In Organization Demonstration PDF
This slide covers KPI dashboard to track employee performance at workplace. It involves details such as productivity rate, labour effectiveness rate, absentee rate and turnover ratio. Take your projects to the next level with our ultimate collection of KPI Dashboard To Track Employee Performance In Organization Demonstration PDF. Slidegeeks has designed a range of layouts that are perfect for representing task or activity duration, keeping track of all your deadlines at a glance. Tailor these designs to your exact needs and give them a truly corporate look with your own brand colors they will make your projects stand out from the rest.
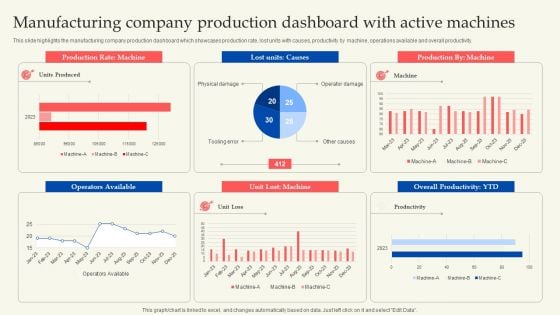
Manufacturing Company Production Dashboard With Active Machines Template PDF
This slide highlights the manufacturing company production dashboard which showcases production rate, lost units with causes, productivity by machine, operations available and overall productivity. Take your projects to the next level with our ultimate collection of Manufacturing Company Production Dashboard With Active Machines Template PDF. Slidegeeks has designed a range of layouts that are perfect for representing task or activity duration, keeping track of all your deadlines at a glance. Tailor these designs to your exact needs and give them a truly corporate look with your own brand colors they will make your projects stand out from the rest.
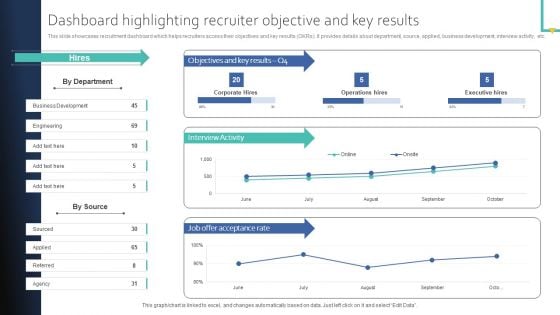
Dashboard Highlighting Recruiter Objective And Key Results Download PDF
This slide showcases recruitment dashboard which helps recruiters access their objectives and key results OKRs. It provides details about department, source, applied, business development, interview activity, etc. Take your projects to the next level with our ultimate collection of Dashboard Highlighting Recruiter Objective And Key Results Download PDF. Slidegeeks has designed a range of layouts that are perfect for representing task or activity duration, keeping track of all your deadlines at a glance. Tailor these designs to your exact needs and give them a truly corporate look with your own brand colors they will make your projects stand out from the rest.
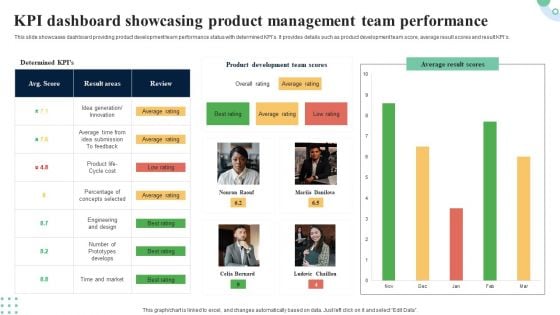
KPI Dashboard Showcasing Product Management Team Performance Demonstration PDF
This slide represents dashboard showcasing revenue assessment for new product development. It projects information regarding revenue breakdown, revenue per product, time to marketing and win or loss analysis. Showcasing this set of slides titled KPI Dashboard Showcasing Product Management Team Performance Demonstration PDF. The topics addressed in these templates are Revenue Per Project, Revenue Breakdown, Loss Analysis. All the content presented in this PPT design is completely editable. Download it and make adjustments in color, background, font etc. as per your unique business setting.
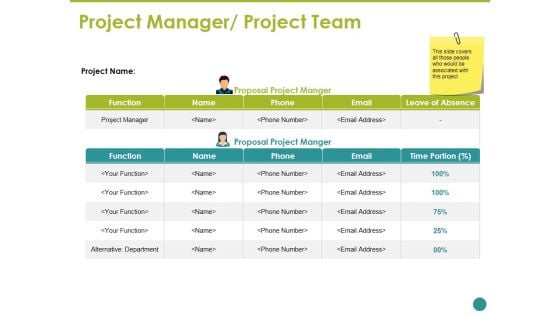
Project Manager Project Team Ppt PowerPoint Presentation Model Samples
This is a project manager project team ppt powerpoint presentation model samples. This is a two stage process. The stages in this process are function, leave of absence, phone, email, name, function.
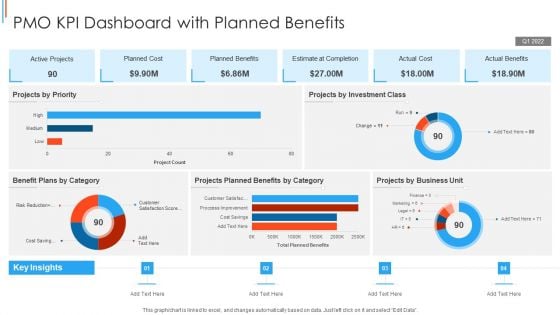
PMO KPI Dashboard With Planned Benefits Inspiration PDF
Showcasing this set of slides titled PMO KPI Dashboard With Planned Benefits Inspiration PDF The topics addressed in these templates are Benefit Plans By Category, Estimate At Completion, Projects By Business All the content presented in this PPT design is completely editable. Download it and make adjustments in color, background, font etc. as per your unique business setting.
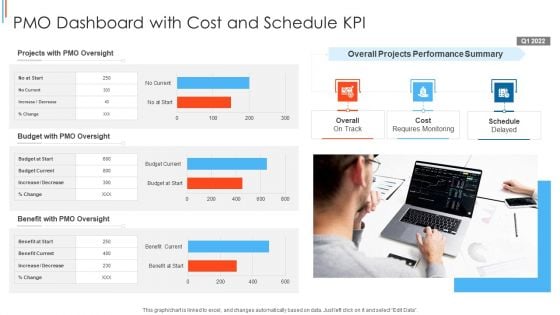
PMO Dashboard With Cost And Schedule KPI Template PDF
Showcasing this set of slides titled PMO Dashboard With Cost And Schedule KPI Themes PDF The topics addressed in these templates are Projects With Pmo Oversight, Budget With Pmo Oversight, Benefit With Pmo Oversight All the content presented in this PPT design is completely editable. Download it and make adjustments in color, background, font etc. as per your unique business setting.
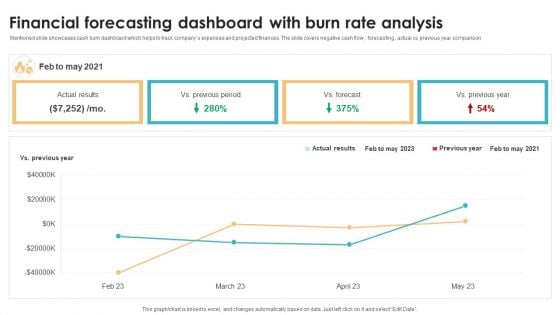
Financial Forecasting Dashboard With Burn Rate Analysis Brochure PDF
Mentioned slide showcases cash burn dashboard which helps to track companys expenses and projected finances. The slide covers negative cash flow , forecasting , actual vs previous year comparison Showcasing this set of slides titled Financial Forecasting Dashboard With Burn Rate Analysis Brochure PDF. The topics addressed in these templates are Previous Year, Analysis, Forecast. All the content presented in this PPT design is completely editable. Download it and make adjustments in color, background, font etc. as per your unique business setting.
Tracking The Cashflow Improvements With Cash Management Dashboard Download PDF
This slide showcases the KPIs that would help our business organization to track the improvements in the new cash management process. It includes quick ratio, cash balance, current ratio, days inventory outstanding, etc.Take your projects to the next level with our ultimate collection of Tracking The Cashflow Improvements With Cash Management Dashboard Download PDF. Slidegeeks has designed a range of layouts that are perfect for representing task or activity duration, keeping track of all your deadlines at a glance. Tailor these designs to your exact needs and give them a truly corporate look with your own brand colors they all make your projects stand out from the rest.
Dashboard Analysis For Tracking Agricultural Tasks Adopting Sustainable Farming Techniques
This slide showcases the KPIs that would help to track the improvements with adoption of new sustainable agriculture practices. It includes current tasks, crops, harvest, todays weather, summary, etc. Take your projects to the next level with our ultimate collection of Dashboard Analysis For Tracking Agricultural Tasks Adopting Sustainable Farming Techniques. Slidegeeks has designed a range of layouts that are perfect for representing task or activity duration, keeping track of all your deadlines at a glance. Tailor these designs to your exact needs and give them a truly corporate look with your own brand colors they will make your projects stand out from the rest This slide showcases the KPIs that would help to track the improvements with adoption of new sustainable agriculture practices. It includes current tasks, crops, harvest, todays weather, summary, etc.
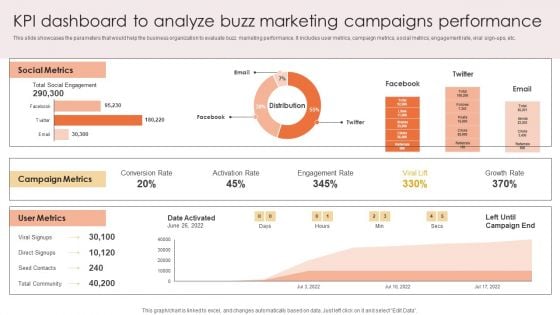
Kpi Dashboard To Analyze Buzz Marketing Campaigns Performance Download PDF
This slide showcases the parameters that would help the business organization to evaluate buzz marketing performance. It includes user metrics, campaign metrics, social metrics, engagement rate, viral sign-ups, etc. Take your projects to the next level with our ultimate collection of Kpi Dashboard To Analyze Buzz Marketing Campaigns Performance Download PDF. Slidegeeks has designed a range of layouts that are perfect for representing task or activity duration, keeping track of all your deadlines at a glance. Tailor these designs to your exact needs and give them a truly corporate look with your own brand colors they will make your projects stand out from the rest.
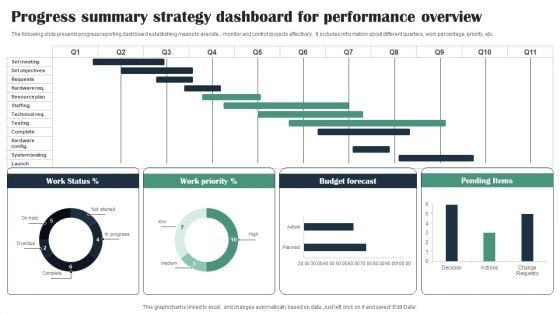
Progress Summary Strategy Dashboard For Performance Overview Diagrams PDF
The following slide presents progress reporting dashboard establishing means to execute , monitor and control projects effectively. It includes information about different quarters, work percentage, priority, etc. Showcasing this set of slides titled Progress Summary Strategy Dashboard For Performance Overview Diagrams PDF. The topics addressed in these templates are Work Status, Work Priority, Budget Forecast. All the content presented in this PPT design is completely editable. Download it and make adjustments in color, background, font etc. as per your unique business setting.
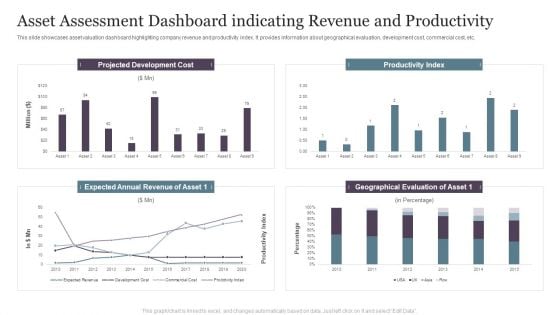
Asset Assessment Dashboard Indicating Revenue And Productivity Infographics PDF
This slide showcases asset valuation dashboard highlighting company revenue and productivity index. It provides information about geographical evaluation, development cost, commercial cost, etc.Pitch your topic with ease and precision using this Asset Assessment Dashboard Indicating Revenue And Productivity Infographics PDF. This layout presents information on Projected Development, Productivity Index, Geographical Evaluation. It is also available for immediate download and adjustment. So, changes can be made in the color, design, graphics or any other component to create a unique layout.

Project Ideation And Administration Project Conclusion Ppt Infographics Styles PDF
Presenting project ideation and administration project conclusion ppt infographics styles pdf to provide visual cues and insights. Share and navigate important information on four stages that need your due attention. This template can be used to pitch topics like project conclusion, performance analysis. In addition, this PPT design contains high-resolution images, graphics, etc, that are easily editable and available for immediate download.
Project Tracking Planned Vs Actual Project Progress Tracker Pictures PDF
The following slide highlights the variations in the project progress to manage the its and ensure timely delivery. It includes KPIs such as completion percentage and the gap in the planned versus actual hours. Pitch your topic with ease and precision using this Project Tracking Planned Vs Actual Project Progress Tracker Pictures PDF. This layout presents information on Project Tracking Planned, Project Progress Tracker. It is also available for immediate download and adjustment. So, changes can be made in the color, design, graphics or any other component to create a unique layout.
Tracking Performance Of Cloud Storage Deployment Dashboard Portrait PDF
The following slide highlights implementation of cloud storage performance tracking dashboard to improve innovation, to attain faster time to market. It includes components such as pinned folders, storage usage, recently used files, documents, images, videos, music, fonts, projects etc. Showcasing this set of slides titled Tracking Performance Of Cloud Storage Deployment Dashboard Portrait PDF. The topics addressed in these templates are Storage Usage, Dashboard, Tracking. All the content presented in this PPT design is completely editable. Download it and make adjustments in color, background, font etc. as per your unique business setting.
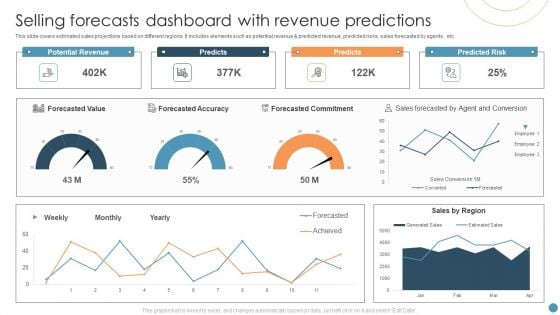
Selling Forecasts Dashboard With Revenue Predictions Elements PDF
This slide covers estimated sales projections based on different regions. It includes elements such as potential revenue and predicted revenue, predicted risks, sales forecasted by agents , etc. Showcasing this set of slides titled Selling Forecasts Dashboard With Revenue Predictions Elements PDF. The topics addressed in these templates are Forecasted Value, Potential Revenue, Predicted Risk. All the content presented in this PPT design is completely editable. Download it and make adjustments in color, background, font etc. as per your unique business setting.
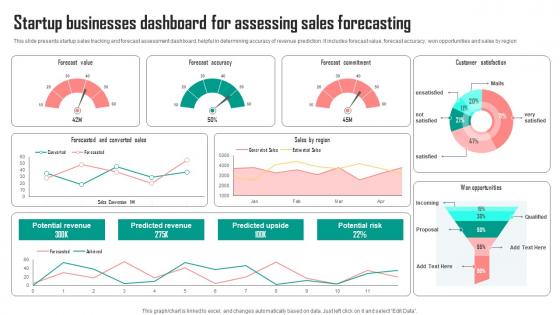
Startup Businesses Dashboard For Assessing Sales Forecasting Background Pdf
This slide presents startup sales tracking and forecast assessment dashboard, helpful in determining accuracy of revenue prediction. It includes forecast value, forecast accuracy, won opportunities and sales by region Pitch your topic with ease and precision using this Startup Businesses Dashboard For Assessing Sales Forecasting Background Pdf. This layout presents information on Forecast Value, Accuracy, Commitment. It is also available for immediate download and adjustment. So, changes can be made in the color, design, graphics or any other component to create a unique layout. This slide presents startup sales tracking and forecast assessment dashboard, helpful in determining accuracy of revenue prediction. It includes forecast value, forecast accuracy, won opportunities and sales by region
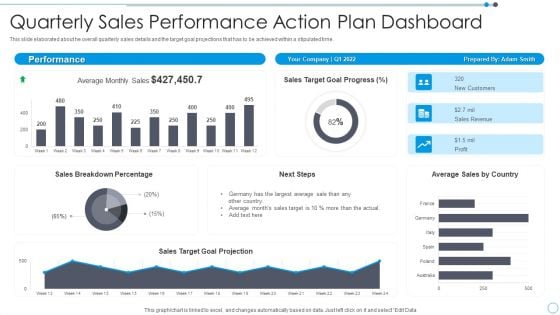
Quarterly Sales Performance Action Plan Dashboard Mockup PDF
This slide elaborated about he overall quarterly sales details and the target goal projections that has to be achieved within a stipulated time. Pitch your topic with ease and precision using this Quarterly Sales Performance Action Plan Dashboard Mockup PDF. This layout presents information on Sales, Target, Goal. It is also available for immediate download and adjustment. So, changes can be made in the color, design, graphics or any other component to create a unique layout.
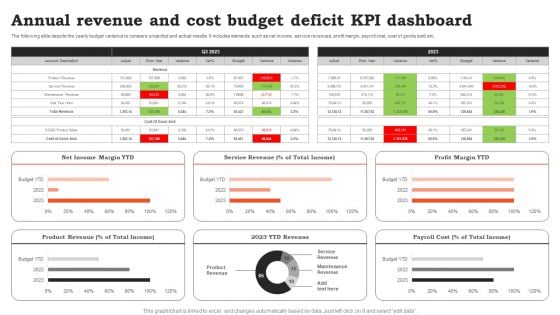
Annual Revenue And Cost Budget Deficit KPI Dashboard Ideas PDF
The following slide depicts the yearly budget variance to compare projected and actual results. It includes elements such as net income, service revenues, profit margin, payroll cost, cost of goods sold etc. Showcasing this set of slides titled Annual Revenue And Cost Budget Deficit KPI Dashboard Ideas PDF. The topics addressed in these templates are Cost Budget, Deficit KPI Dashboard. All the content presented in this PPT design is completely editable. Download it and make adjustments in color, background, font etc. as per your unique business setting.
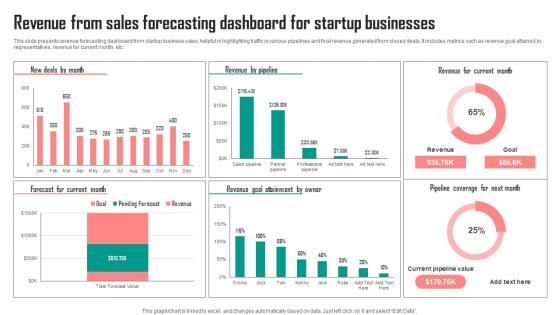
Revenue From Sales Forecasting Dashboard For Startup Businesses Graphics Pdf
This slide presents revenue forecasting dashboard from startup business sales, helpful in highlighting traffic in various pipelines and final revenue generated from closed deals. It includes metrics such as revenue goal attained by representatives, revenue for current month, etc. Showcasing this set of slides titled Revenue From Sales Forecasting Dashboard For Startup Businesses Graphics Pdf. The topics addressed in these templates are Owner, Current Month, Businesses. All the content presented in this PPT design is completely editable. Download it and make adjustments in color, background, font etc. as per your unique business setting. This slide presents revenue forecasting dashboard from startup business sales, helpful in highlighting traffic in various pipelines and final revenue generated from closed deals. It includes metrics such as revenue goal attained by representatives, revenue for current month, etc.
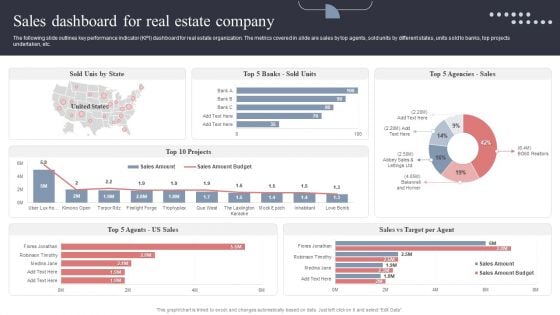
Sales Dashboard For Real Estate Company Topics PDF
The following slide outlines key performance indicator KPI dashboard for real estate organization. The metrics covered in slide are sales by top agents, sold units by different states, units sold to banks, top projects undertaken, etc. This Sales Dashboard For Real Estate Company Topics PDF is perfect for any presentation, be it in front of clients or colleagues. It is a versatile and stylish solution for organizing your meetings. The Sales Dashboard For Real Estate Company Topics PDF features a modern design for your presentation meetings. The adjustable and customizable slides provide unlimited possibilities for acing up your presentation. Slidegeeks has done all the homework before launching the product for you. So, do not wait, grab the presentation templates today
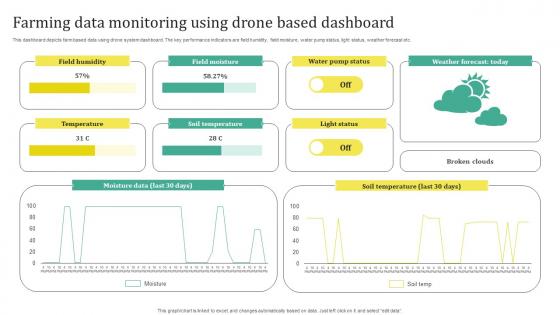
Farming Data Monitoring Using Drone Based Dashboard Sample Pdf
This dashboard depicts farm based data using drone system dashboard. The key performance indicators are field humidity, field moisture, water pump status, light status, weather forecast etc. Pitch your topic with ease and precision using this Farming Data Monitoring Using Drone Based Dashboard Sample Pdf. This layout presents information on Temperature, Soil Temperature, Light Status. It is also available for immediate download and adjustment. So, changes can be made in the color, design, graphics or any other component to create a unique layout. This dashboard depicts farm based data using drone system dashboard. The key performance indicators are field humidity, field moisture, water pump status, light status, weather forecast etc.
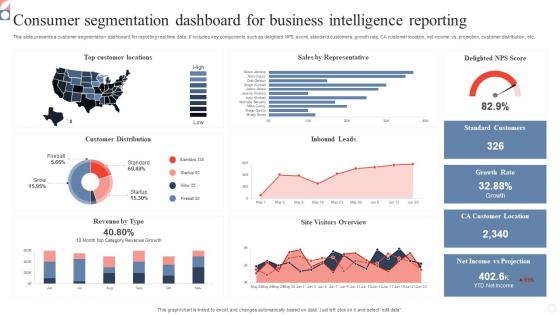
Consumer Segmentation Dashboard For Business Intelligence Reporting Topics Pdf
This slide presents a customer segmentation dashboard for reporting real time data. It includes key components such as delighted NPS score, standard customers, growth rate, CA customer location, net income vs. projection, customer distribution, etc. Pitch your topic with ease and precision using this Consumer Segmentation Dashboard For Business Intelligence Reporting Topics Pdf. This layout presents information on Consumer Segmentation Dashboard, Business Intelligence Reporting, Growth Rate. It is also available for immediate download and adjustment. So, changes can be made in the color, design, graphics or any other component to create a unique layout. This slide presents a customer segmentation dashboard for reporting real time data. It includes key components such as delighted NPS score, standard customers, growth rate, CA customer location, net income vs. projection, customer distribution, etc.
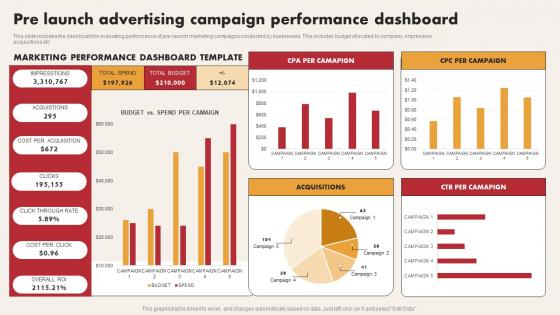
Pre Launch Advertising Campaign Performance Dashboard Graphics Pdf
This slide includes the dashboard for evaluating performance of pre launch marketing campaigns conducted by businesses. This includes budget allocated by company, impression, acquisitions etc Pitch your topic with ease and precision using this Pre Launch Advertising Campaign Performance Dashboard Graphics Pdf. This layout presents information on Pre Launch Advertising Campaign, Performance Dashboard. It is also available for immediate download and adjustment. So, changes can be made in the color, design, graphics or any other component to create a unique layout. This slide includes the dashboard for evaluating performance of pre launch marketing campaigns conducted by businesses. This includes budget allocated by company, impression, acquisitions etc
Track Employee Training Plan KPI Dashboard Icons Pdf
Following slide shows KPI dashboard for tracking employee training plans which help in analyzing where the organization lagging behind in skill development program. It includes the KPI such as training status, budget allocation, monthly cost incurred, etc. Showcasing this set of slides titled Track Employee Training Plan KPI Dashboard Icons Pdf The topics addressed in these templates are Monthly Dashboard, Budget Allocation, Remaining All the content presented in this PPT design is completely editable. Download it and make adjustments in color, background, font etc. as per your unique business setting. Following slide shows KPI dashboard for tracking employee training plans which help in analyzing where the organization lagging behind in skill development program. It includes the KPI such as training status, budget allocation, monthly cost incurred, etc.
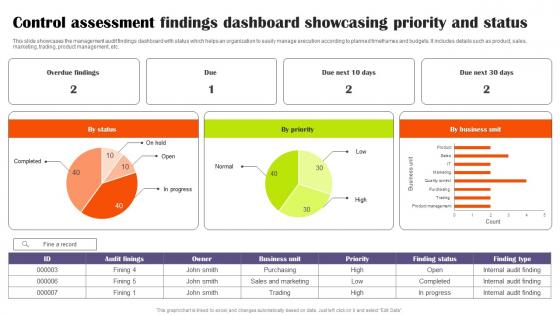
Control Assessment Findings Dashboard Showcasing Priority And Status Sample Pdf
This slide showcases the management audit findings dashboard with status which helps an organization to easily manage execution according to planned timeframes and budgets. It includes details such as product, sales, marketing, trading, product management, etc. Pitch your topic with ease and precision using this Control Assessment Findings Dashboard Showcasing Priority And Status Sample Pdf This layout presents information on Control Assessment, Findings Dashboard, Showcasing Priority It is also available for immediate download and adjustment. So, changes can be made in the color, design, graphics or any other component to create a unique layout. This slide showcases the management audit findings dashboard with status which helps an organization to easily manage execution according to planned timeframes and budgets. It includes details such as product, sales, marketing, trading, product management, etc.
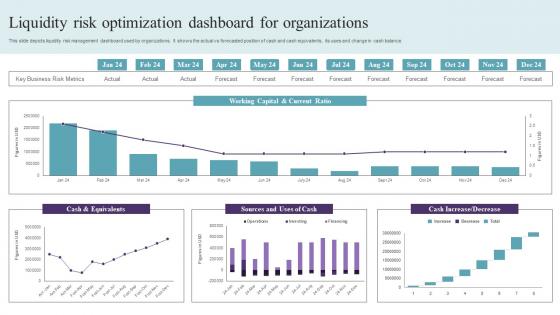
Liquidity Risk Optimization Dashboard For Organizations Graphics Pdf
This slide depicts liquidity risk management dashboard used by organizations. It shows the actual vs forecasted position of cash and cash equivalents, its uses and change in cash balance. Pitch your topic with ease and precision using this Liquidity Risk Optimization Dashboard For Organizations Graphics Pdf. This layout presents information on Cash And Equivalents, Working Capital, Current Ratio. It is also available for immediate download and adjustment. So, changes can be made in the color, design, graphics or any other component to create a unique layout. This slide depicts liquidity risk management dashboard used by organizations. It shows the actual vs forecasted position of cash and cash equivalents, its uses and change in cash balance.


 Continue with Email

 Home
Home


