Project Progress Dashboard
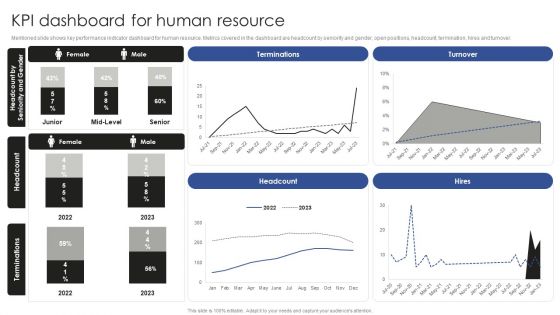
Talent Administration And Succession KPI Dashboard For Human Resource Rules PDF
Mentioned slide shows key performance indicator dashboard for human resource. Metrics covered in the dashboard are headcount by seniority and gender, open positions, headcount, termination, hires and turnover. If your project calls for a presentation, then Slidegeeks is your go-to partner because we have professionally designed, easy-to-edit templates that are perfect for any presentation. After downloading, you can easily edit Talent Administration And Succession KPI Dashboard For Human Resource Rules PDF and make the changes accordingly. You can rearrange slides or fill them with different images. Check out all the handy templates
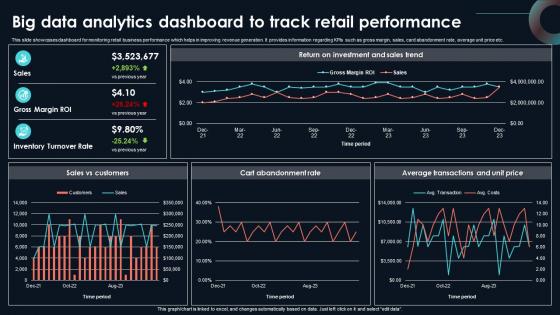
Big Data Analytics Dashboard To Track Developing Strategic Insights Using Big Data Analytics SS V
This slide showcases dashboard for monitoring retail business performance which helps in improving revenue generation. It provides information regarding KPIs such as gross margin, sales, card abandonment rate, average unit price etc. If your project calls for a presentation, then Slidegeeks is your go-to partner because we have professionally designed, easy-to-edit templates that are perfect for any presentation. After downloading, you can easily edit Big Data Analytics Dashboard To Track Developing Strategic Insights Using Big Data Analytics SS V and make the changes accordingly. You can rearrange slides or fill them with different images. Check out all the handy templates This slide showcases dashboard for monitoring retail business performance which helps in improving revenue generation. It provides information regarding KPIs such as gross margin, sales, card abandonment rate, average unit price etc.
Online Marketing Analytics To Enhance Business Growth Website Landing Page KPI Tracking Dashboard Sample PDF
This slide covers a dashboard for analyzing the metrics of the website landing page. It includes KPIs such as conversions, conversion rate, sessions, bounce rate, engagement sickness, etc. If your project calls for a presentation, then Slidegeeks is your go to partner because we have professionally designed, easy to edit templates that are perfect for any presentation. After downloading, you can easily edit Online Marketing Analytics To Enhance Business Growth Website Landing Page KPI Tracking Dashboard Sample PDF and make the changes accordingly. You can rearrange slides or fill them with different images. Check out all the handy templates
Planning Transnational Technique To Improve International Scope Dashboard Tracking Post Expansion Revenue Structure PDF
This slide covers the dashboard for analyzing fast food business sales by location. It includes KPIs such as the companys revenue by location, by type, top 5 expenses by account, top 5 expenses by department, cost of revenue year to date, etc. If your project calls for a presentation, then Slidegeeks is your go to partner because we have professionally designed, easy to edit templates that are perfect for any presentation. After downloading, you can easily edit Planning Transnational Technique To Improve International Scope Dashboard Tracking Post Expansion Revenue Structure PDF and make the changes accordingly. You can rearrange slides or fill them with different images. Check out all the handy templates
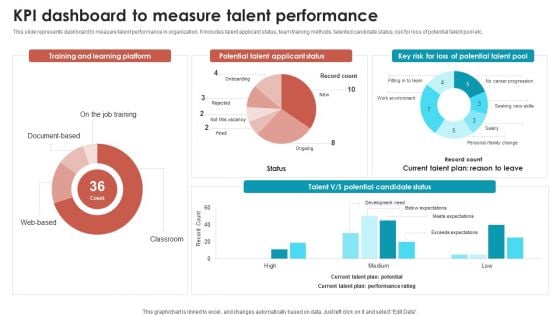
Talent Management Optimization With Workforce Staffing Kpi Dashboard To Measure Talent Performance Sample PDF
This slide represents dashboard to measure talent performance in organization. It includes talent applicant status, team training methods, talented candidate status, risk for loss of potential talent pool etc. If your project calls for a presentation, then Slidegeeks is your go to partner because we have professionally designed, easy to edit templates that are perfect for any presentation. After downloading, you can easily edit Talent Management Optimization With Workforce Staffing Kpi Dashboard To Measure Talent Performance Sample PDF and make the changes accordingly. You can rearrange slides or fill them with different images. Check out all the handy templates.
Ultimate Guide To Improve Customer Support And Services Dashboard For Tracking Aftersales Customer Sample PDF
This slide covers the KPI dashboard for ticket tracking. It includes metrics such as tickets by month, service level, and details of customer service department agents. If your project calls for a presentation, then Slidegeeks is your go to partner because we have professionally designed, easy to edit templates that are perfect for any presentation. After downloading, you can easily edit Ultimate Guide To Improve Customer Support And Services Dashboard For Tracking Aftersales Customer Sample PDF and make the changes accordingly. You can rearrange slides or fill them with different images. Check out all the handy templates
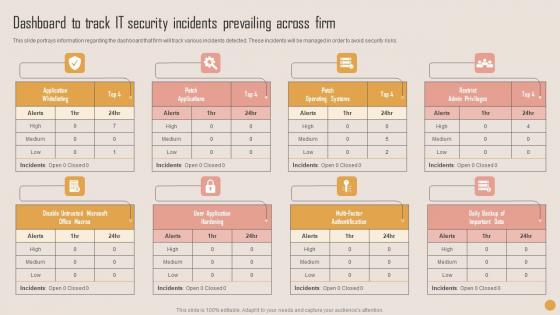
Dashboard To Track IT Security Playbook For Strategic Actions To Improve IT Performance Summary Pdf
This slide portrays information regarding the dashboard that firm will track various incidents detected. These incidents will be managed in order to avoid security risks. If your project calls for a presentation, then Slidegeeks is your go to partner because we have professionally designed, easy to edit templates that are perfect for any presentation. After downloading, you can easily edit Dashboard To Track IT Security Playbook For Strategic Actions To Improve IT Performance Summary Pdf and make the changes accordingly. You can rearrange slides or fill them with different images. Check out all the handy templates This slide portrays information regarding the dashboard that firm will track various incidents detected. These incidents will be managed in order to avoid security risks.
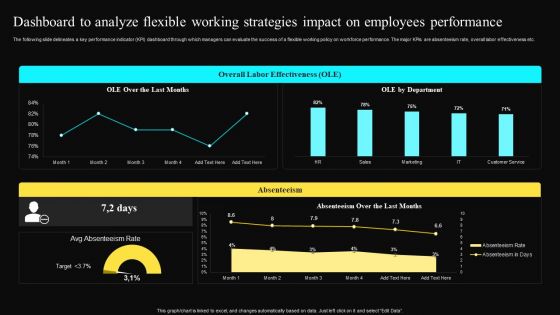
Dashboard To Analyze Flexible Working Strategies Impact On Employees Performance Rules PDF
The following slide delineates a key performance indicator KPI dashboard through which managers can evaluate the success of a flexible working policy on workforce performance. The major KPIs are absenteeism rate, overall labor effectiveness etc.If your project calls for a presentation, then Slidegeeks is your go-to partner because we have professionally designed, easy to edit templates that are perfect for any presentation. After downloading, you can easily edit Dashboard To Analyze Flexible Working Strategies Impact On Employees Performance Rules PDF and make the changes accordingly. You can rearrange slides or fill them with different images. Check out all the handy templates
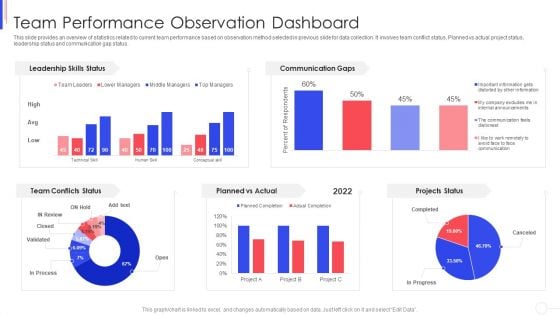
Strategy To Improve Team Proficiency Team Performance Observation Dashboard Diagrams PDF
This slide provides an overview of statistics related to current team performance based on observation method selected in previous slide for data collection. It involves team conflict status, Planned vs actual project status, leadership status and communication gap status. Deliver an awe inspiring pitch with this creative proficiency team performance observation dashboard diagrams pdf bundle. Topics like team performance observation dashboard can be discussed with this completely editable template. It is available for immediate download depending on the needs and requirements of the user.
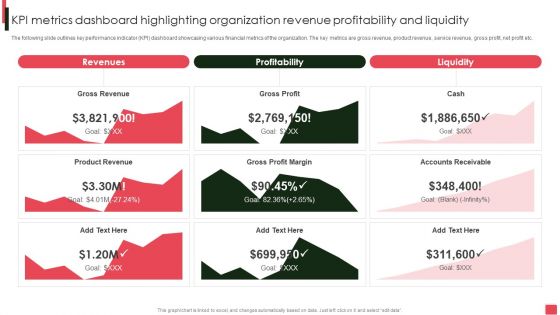
Overview Of Organizational Kpi Metrics Dashboard Highlighting Organization Revenue Brochure PDF
The following slide outlines key performance indicator KPI dashboard showcasing various financial metrics of the organization. The key metrics are gross revenue, product revenue, service revenue, gross profit, net profit etc. If your project calls for a presentation, then Slidegeeks is your go-to partner because we have professionally designed, easy-to-edit templates that are perfect for any presentation. After downloading, you can easily edit Overview Of Organizational Kpi Metrics Dashboard Highlighting Organization Revenue Brochure PDF and make the changes accordingly. You can rearrange slides or fill them with different images. Check out all the handy templates.
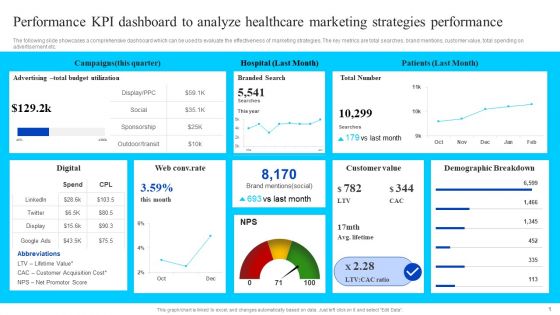
Performance KPI Dashboard To Analyze Healthcare Marketing Strategies Performance Elements PDF
The following slide showcases a comprehensive dashboard which can be used to evaluate the effectiveness of marketing strategies. The key metrics are total searches, brand mentions, customer value, total spending on advertisement etc. If your project calls for a presentation, then Slidegeeks is your go to partner because we have professionally designed, easy to edit templates that are perfect for any presentation. After downloading, you can easily edit Performance KPI Dashboard To Analyze Healthcare Marketing Strategies Performance Elements PDF and make the changes accordingly. You can rearrange slides or fill them with different images. Check out all the handy templates.

Implementing An Effective Ecommerce Management Framework Email Campaign Performance KPI Dashboard Introduction PDF
This slide covers dashboard providing an insight related to how subscribers and resonating with email marketing campaign. It key performance metrics such as sessions from email, sessions from email by campaign, sessions by email by date etc. If your project calls for a presentation, then Slidegeeks is your go-to partner because we have professionally designed, easy-to-edit templates that are perfect for any presentation. After downloading, you can easily edit Implementing An Effective Ecommerce Management Framework Email Campaign Performance KPI Dashboard Introduction PDF and make the changes accordingly. You can rearrange slides or fill them with different images. Check out all the handy templates
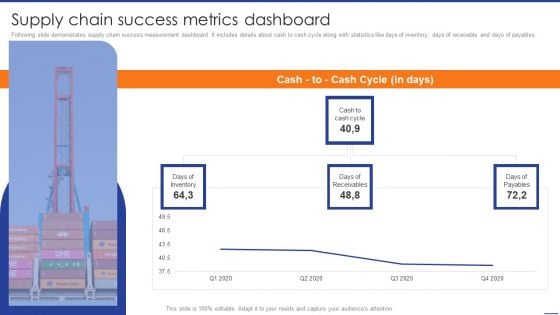
Digital Transformation Of Supply Supply Chain Success Metrics Dashboard Graphics PDF
Following slide demonstrates supply chain success measurement dashboard. It includes details about cash to cash cycle along with statistics like days of inventory, days of receivable and days of payables. If your project calls for a presentation, then Slidegeeks is your go-to partner because we have professionally designed, easy-to-edit templates that are perfect for any presentation. After downloading, you can easily edit Digital Transformation Of Supply Supply Chain Success Metrics Dashboard Graphics PDF and make the changes accordingly. You can rearrange slides or fill them with different images. Check out all the handy templates.
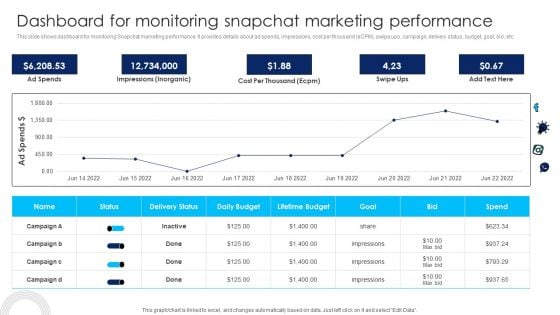
Using Social Media Platforms To Enhance Dashboard For Monitoring Snapchat Marketing Introduction PDF
This slide shows dashboard for monitoring Snapchat marketing performance. It provides details about ad spends, impressions, cost per thousand eCPM, swipe ups, campaign, delivery status, budget, goal, bid, etc. If your project calls for a presentation, then Slidegeeks is your go-to partner because we have professionally designed, easy-to-edit templates that are perfect for any presentation. After downloading, you can easily edit Using Social Media Platforms To Enhance Dashboard For Monitoring Snapchat Marketing Introduction PDF and make the changes accordingly. You can rearrange slides or fill them with different images. Check out all the handy templates
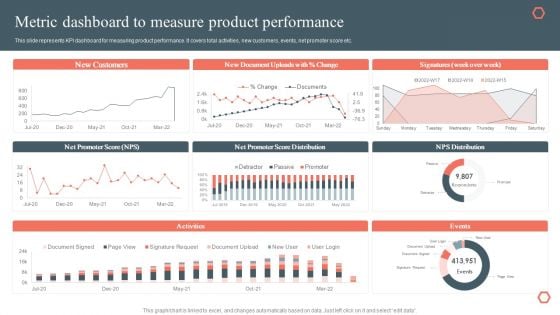
Metric Dashboard To Measure Product Performance Product Development And Management Plan Demonstration PDF
This slide represents dashboard for tracking product success. It covers new customer, total sessions, purchase, total inquires, total crashes etc.If your project calls for a presentation, then Slidegeeks is your go to partner because we have professionally designed, easy to edit templates that are perfect for any presentation. After downloading, you can easily edit Metric Dashboard To Measure Product Performance Product Development And Management Plan Demonstration PDF and make the changes accordingly. You can rearrange slides or fill them with different images. Check out all the handy templates.
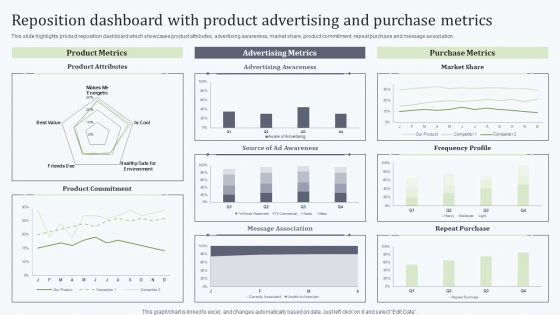
Deploying Revitalization Strategy Enhance Product And Service Sales Reposition Dashboard With Product Slides PDF
This slide highlights product reposition dashboard which showcases product attributes, advertising awareness, market share, product commitment, repeat purchase and message association. If your project calls for a presentation, then Slidegeeks is your go to partner because we have professionally designed, easy to edit templates that are perfect for any presentation. After downloading, you can easily edit Deploying Revitalization Strategy Enhance Product And Service Sales Reposition Dashboard With Product Slides PDF and make the changes accordingly. You can rearrange slides or fill them with different images. Check out all the handy templates
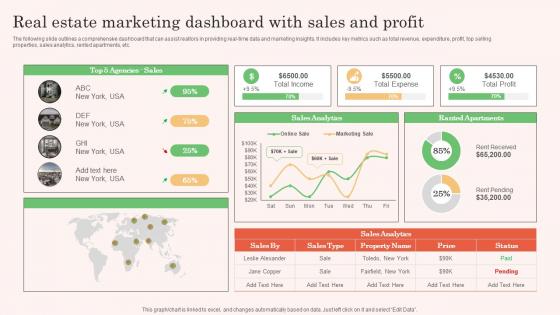
Real Estate Marketing Dashboard With Sales And Profit Real Estate Property Marketing Summary Pdf
The following slide outlines a comprehensive dashboard that can assist realtors in providing real-time data and marketing insights. It includes key metrics such as total revenue, expenditure, profit, top selling properties, sales analytics, rented apartments, etc.If your project calls for a presentation, then Slidegeeks is your go-to partner because we have professionally designed, easy-to-edit templates that are perfect for any presentation. After downloading, you can easily edit Real Estate Marketing Dashboard With Sales And Profit Real Estate Property Marketing Summary Pdf and make the changes accordingly. You can rearrange slides or fill them with different images. Check out all the handy templates The following slide outlines a comprehensive dashboard that can assist realtors in providing real-time data and marketing insights. It includes key metrics such as total revenue, expenditure, profit, top selling properties, sales analytics, rented apartments, etc.
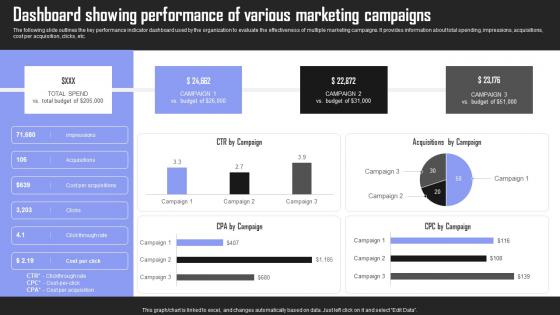
Dashboard Showing Performance Brand Building Techniques To Gain Competitive Edge Topics Pdf
The following slide outlines the key performance indicator dashboard used by the organization to evaluate the effectiveness of multiple marketing campaigns. It provides information about total spending, impressions, acquisitions, cost per acquisition, clicks, etc. If your project calls for a presentation, then Slidegeeks is your go to partner because we have professionally designed, easy to edit templates that are perfect for any presentation. After downloading, you can easily edit Dashboard Showing Performance Brand Building Techniques To Gain Competitive Edge Topics Pdf and make the changes accordingly. You can rearrange slides or fill them with different images. Check out all the handy templates The following slide outlines the key performance indicator dashboard used by the organization to evaluate the effectiveness of multiple marketing campaigns. It provides information about total spending, impressions, acquisitions, cost per acquisition, clicks, etc.

How To Create Cost Effective Facebook Ads Dashboard With Campaign Strategy SS V
The following slide outlines comprehensive dashboard through which advertisers can monitor Facebook ads performance. The KPIs outlined in slide are ad spend, conversions, cost per conversion, cost per action, brand impressions, clicks, etc. If your project calls for a presentation, then Slidegeeks is your go-to partner because we have professionally designed, easy-to-edit templates that are perfect for any presentation. After downloading, you can easily edit How To Create Cost Effective Facebook Ads Dashboard With Campaign Strategy SS V and make the changes accordingly. You can rearrange slides or fill them with different images. Check out all the handy templates The following slide outlines comprehensive dashboard through which advertisers can monitor Facebook ads performance. The KPIs outlined in slide are ad spend, conversions, cost per conversion, cost per action, brand impressions, clicks, etc.

Equity Asset Allocation Dashboard Analytics Strategic Investment Plan For Optimizing Risk SS V
This slide represents an equity asset allocation dashboard to measure and manage the performance of equity overtime. It tracks KPIs such as, average position size, market cap distribution, average PE distribution, ratio and yield, by geography, industry, currency and holding lists.If your project calls for a presentation, then Slidegeeks is your go-to partner because we have professionally designed, easy-to-edit templates that are perfect for any presentation. After downloading, you can easily edit Equity Asset Allocation Dashboard Analytics Strategic Investment Plan For Optimizing Risk SS V and make the changes accordingly. You can rearrange slides or fill them with different images. Check out all the handy templates This slide represents an equity asset allocation dashboard to measure and manage the performance of equity overtime. It tracks KPIs such as, average position size, market cap distribution, average PE distribution, ratio and yield, by geography, industry, currency and holding lists.
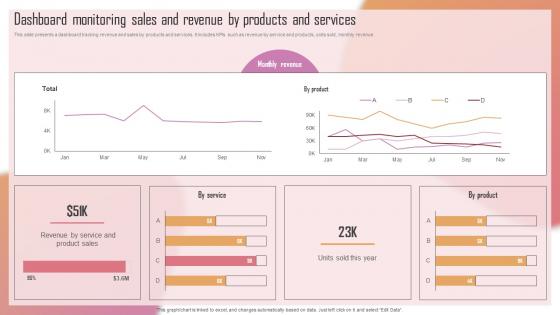
Customizing The Salon Experience Dashboard Monitoring Sales And Revenue By Products Strategy SS V
This slide presents a dashboard tracking revenue and sales by products and services. It includes KPIs such as revenue by service and products, units sold, monthly revenue. If your project calls for a presentation, then Slidegeeks is your go-to partner because we have professionally designed, easy-to-edit templates that are perfect for any presentation. After downloading, you can easily edit Customizing The Salon Experience Dashboard Monitoring Sales And Revenue By Products Strategy SS V and make the changes accordingly. You can rearrange slides or fill them with different images. Check out all the handy templates This slide presents a dashboard tracking revenue and sales by products and services. It includes KPIs such as revenue by service and products, units sold, monthly revenue.
Managing It Services Spending Tracking Dashboard Playbook For Managing Us Inspiration Pdf
This slide provides information regarding the management of the digital services performance and IT spending tracking dashboard in terms of ROI, spend vs. budget, IT costs software, hardware, personnel and goals, IT spending in terms of revenues, etc. If your project calls for a presentation, then Slidegeeks is your go-to partner because we have professionally designed, easy-to-edit templates that are perfect for any presentation. After downloading, you can easily edit Managing It Services Spending Tracking Dashboard Playbook For Managing Us Inspiration Pdf and make the changes accordingly. You can rearrange slides or fill them with different images. Check out all the handy templates This slide provides information regarding the management of the digital services performance and IT spending tracking dashboard in terms of ROI, spend vs. budget, IT costs software, hardware, personnel and goals, IT spending in terms of revenues, etc.
Managing It Services Spending Tracking Dashboard Gen Tech Stack Playbook Inspiration Pdf
This slide provides information regarding the management of the digital services performance and IT spending tracking dashboard in terms of ROI, spend vs. budget, IT costs software, hardware, personnel and goals, IT spending in terms of revenues, etc. If your project calls for a presentation, then Slidegeeks is your go-to partner because we have professionally designed, easy-to-edit templates that are perfect for any presentation. After downloading, you can easily edit Managing It Services Spending Tracking Dashboard Gen Tech Stack Playbook Inspiration Pdf and make the changes accordingly. You can rearrange slides or fill them with different images. Check out all the handy templates This slide provides information regarding the management of the digital services performance and IT spending tracking dashboard in terms of ROI, spend vs. budget, IT costs software, hardware, personnel and goals, IT spending in terms of revenues, etc.
Techniques To Optimize Business Performance Dashboard To Measure Display Advertising Icons Pdf
This slide provides a dashboard to monitor the display advertising campaign performance in order to reduce overall marketing cost. It incorporates advertising cost, average number of clicks and impressions, clicks per day, revenue by campaign, etc. If your project calls for a presentation, then Slidegeeks is your go-to partner because we have professionally designed, easy-to-edit templates that are perfect for any presentation. After downloading, you can easily edit Techniques To Optimize Business Performance Dashboard To Measure Display Advertising Icons Pdf and make the changes accordingly. You can rearrange slides or fill them with different images. Check out all the handy templates This slide provides a dashboard to monitor the display advertising campaign performance in order to reduce overall marketing cost. It incorporates advertising cost, average number of clicks and impressions, clicks per day, revenue by campaign, etc.
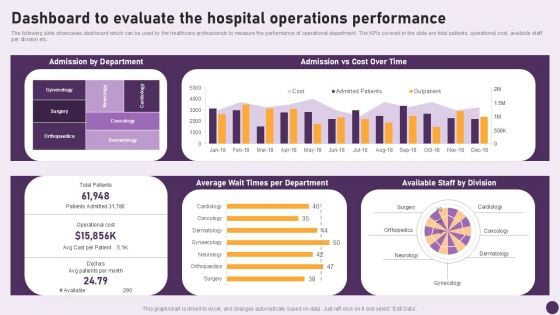
Guide To Healthcare Services Administration Dashboard To Evaluate The Hospital Operations Performance Infographics PDF
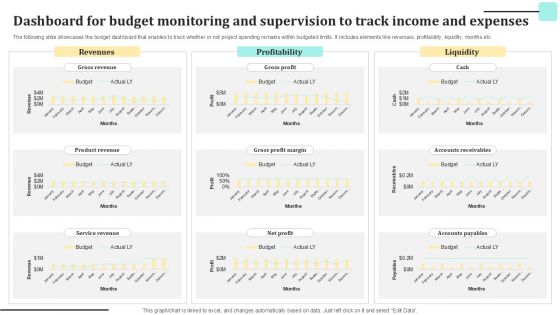
Dashboard For Budget Monitoring And Supervision To Track Income And Expenses Guidelines PDF
Robotic Process Automation Shipping And Logistics Tracking Dashboard With Shipments Clipart PDF
This slide covers Key performance indicators to track the automation system of the company. This dashboard includes Logistics Efficiency Status, delivery time accuracy etc. If your project calls for a presentation, then Slidegeeks is your go-to partner because we have professionally designed, easy-to-edit templates that are perfect for any presentation. After downloading, you can easily edit Robotic Process Automation Shipping And Logistics Tracking Dashboard With Shipments Clipart PDF and make the changes accordingly. You can rearrange slides or fill them with different images. Check out all the handy templates
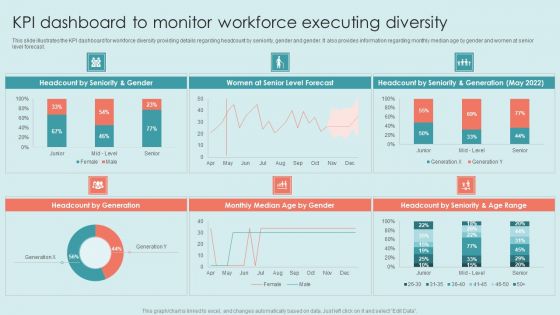
Executing Diversity KPI Dashboard To Monitor Workforce Executing Diversity Background PDF
This slide covers information regarding the key traits of inclusive leadership such as commitment, courage, cognize bias, curiosity etc. It also provides details about thinking to develop and behavior to adopt for becoming an effective inclusive leader. If your project calls for a presentation, then Slidegeeks is your go-to partner because we have professionally designed, easy-to-edit templates that are perfect for any presentation. After downloading, you can easily edit Executing Diversity KPI Dashboard To Monitor Workforce Executing Diversity Background PDF and make the changes accordingly. You can rearrange slides or fill them with different images. Check out all the handy templates.
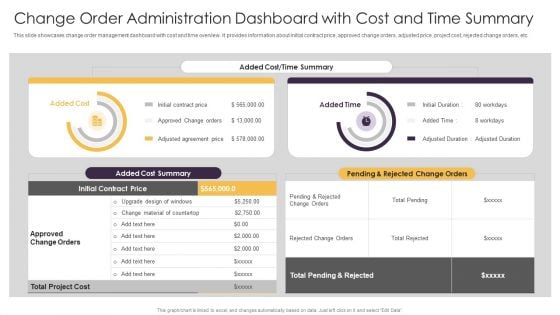
Change Order Administration Dashboard With Cost And Time Summary Ppt Infographics Sample PDF
This slide showcases change order management dashboard with cost and time overview. It provides information about initial contract price, approved change orders, adjusted price, project cost, rejected change orders, etc. Showcasing this set of slides titled Change Order Administration Dashboard With Cost And Time Summary Ppt Infographics Sample PDF. The topics addressed in these templates are Added Cost Summary, Initial Contract Price, Rejected Change Orders. All the content presented in this PPT design is completely editable. Download it and make adjustments in color, background, font etc. as per your unique business setting.
Reverse Proxy Web Server Dashboard For Reverse Proxy Performance Tracking Elements PDF
This slide represents the dashboard for reverse proxy performance tracking by covering details of CPU load, available memory, and connections. If your project calls for a presentation, then Slidegeeks is your go-to partner because we have professionally designed, easy-to-edit templates that are perfect for any presentation. After downloading, you can easily edit Reverse Proxy Web Server Dashboard For Reverse Proxy Performance Tracking Elements PDF and make the changes accordingly. You can rearrange slides or fill them with different images. Check out all the handy templates
Conformance Testing Performance Tracking Dashboard Compliance Assessment Ppt Layouts Graphics PDF
This slide depicts the conformance testing performance tracking dashboard by covering details of test case analysis, tests linked to requirements, test case breakdown, tests per requirement, and so on. If your project calls for a presentation, then Slidegeeks is your go-to partner because we have professionally designed, easy-to-edit templates that are perfect for any presentation. After downloading, you can easily edit Conformance Testing Performance Tracking Dashboard Compliance Assessment Ppt Layouts Graphics PDF and make the changes accordingly. You can rearrange slides or fill them with different images. Check out all the handy templates
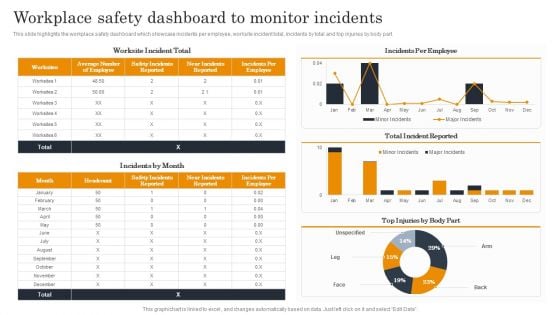
Employee Health And Safety Workplace Safety Dashboard To Monitor Incidents Ideas PDF
This slide highlights the workplace safety dashboard which showcase incidents per employee, worksite incident total, incidents by total and top injuries by body part. If your project calls for a presentation, then Slidegeeks is your go-to partner because we have professionally designed, easy-to-edit templates that are perfect for any presentation. After downloading, you can easily edit Employee Health And Safety Workplace Safety Dashboard To Monitor Incidents Ideas PDF and make the changes accordingly. You can rearrange slides or fill them with different images. Check out all the handy templates.

Effective Brand Reputation Management Brand Equity Performance Assessment Dashboard Slides PDF
This slide provides information regarding brand equity performance assessment dashboard that highlights customer lifecycle value, customer adoption rate, mentions, engagement, etc. If your project calls for a presentation, then Slidegeeks is your go-to partner because we have professionally designed, easy-to-edit templates that are perfect for any presentation. After downloading, you can easily edit Effective Brand Reputation Management Brand Equity Performance Assessment Dashboard Slides PDF and make the changes accordingly. You can rearrange slides or fill them with different images. Check out all the handy templates.
Critical Measures For Ensuring Threats Handling Activities Tracking Dashboard Summary PDF
This slide provides details regarding various threats management activities tracking dashboard in terms of breach risk trends, risk issues by owner, breach likelihood, etc. If your project calls for a presentation, then Slidegeeks is your go-to partner because we have professionally designed, easy-to-edit templates that are perfect for any presentation. After downloading, you can easily edit Critical Measures For Ensuring Threats Handling Activities Tracking Dashboard Summary PDF and make the changes accordingly. You can rearrange slides or fill them with different images. Check out all the handy templates.
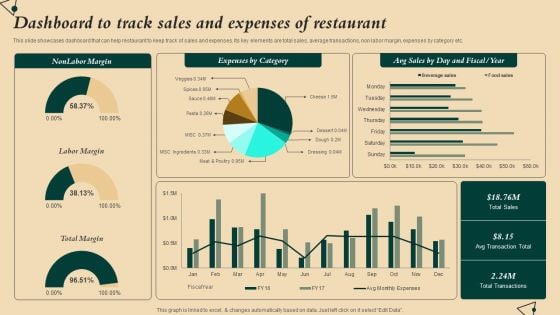
Coffeehouse Promotion Techniques To Boost Revenue Dashboard To Track Sales Expenses Restaurant Clipart PDF
This slide showcases dashboard that can help restaurant to keep track of sales and expenses. Its key elements are total sales, average transactions, non labor margin, expenses by category etc. If your project calls for a presentation, then Slidegeeks is your go-to partner because we have professionally designed, easy-to-edit templates that are perfect for any presentation. After downloading, you can easily edit Coffeehouse Promotion Techniques To Boost Revenue Dashboard To Track Sales Expenses Restaurant Clipart PDF and make the changes accordingly. You can rearrange slides or fill them with different images. Check out all the handy templates
Dashboard To Measure Performance Of E Commerce Retail Business Growth Marketing Techniques Icons PDF
This following slide displays the key metrics that can help an organization to measure effectiveness of e-commerce strategies. These can be revenue generated using e-commerce platform, conversion rates etc. If your project calls for a presentation, then Slidegeeks is your go to partner because we have professionally designed, easy to edit templates that are perfect for any presentation. After downloading, you can easily edit Dashboard To Measure Performance Of E Commerce Retail Business Growth Marketing Techniques Icons PDF and make the changes accordingly. You can rearrange slides or fill them with different images. Check out all the handy templates
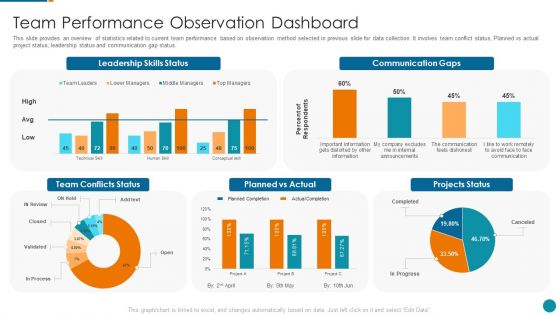
Strategic Procedure To Improve Employee Efficiency Team Performance Observation Dashboard Formats PDF
This slide provides an overview of statistics related to current team performance based on observation method selected in previous slide for data collection. It involves team conflict status, Planned vs actual project status, leadership status and communication gap status.Deliver an awe inspiring pitch with this creative strategic procedure to improve employee efficiency team performance observation dashboard formats pdf bundle. Topics like leadership skills status, communication gaps, planned vs actual can be discussed with this completely editable template. It is available for immediate download depending on the needs and requirements of the user.
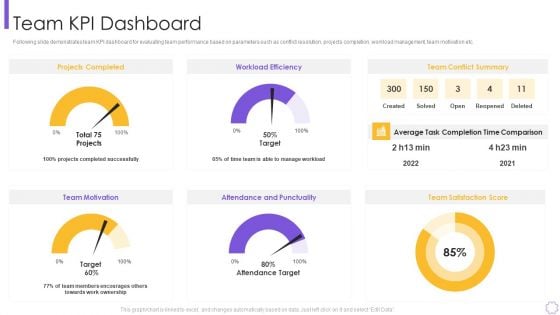
Organizational Program To Improve Team Productivity And Efficiency Team Kpi Dashboard Clipart PDF
Following slide demonstrates team KPI dashboard for evaluating team performance based on parameters such as conflict resolution, projects completion, workload management, team motivation etc. Deliver and pitch your topic in the best possible manner with this organizational program to improve team productivity and efficiency team kpi dashboard clipart pdf Use them to share invaluable insights on projects completed, workload efficiency, attendance and punctualityand impress your audience. This template can be altered and modified as per your expectations. So, grab it now.
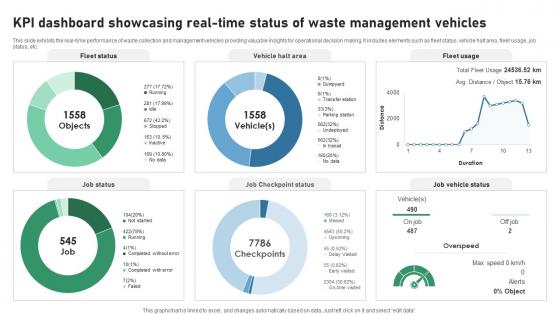
KPI Dashboard Showcasing Real Time Status Of Waste IOT Applications In Smart Waste IoT SS V
This slide exhibits the real-time performance of waste collection and management vehicles providing valuable insights for operational decision making. It includes elements such as fleet status, vehicle halt area, fleet usage, job status, etc. Take your projects to the next level with our ultimate collection of KPI Dashboard Showcasing Real Time Status Of Waste IOT Applications In Smart Waste IoT SS V. Slidegeeks has designed a range of layouts that are perfect for representing task or activity duration, keeping track of all your deadlines at a glance. Tailor these designs to your exact needs and give them a truly corporate look with your own brand colors they will make your projects stand out from the rest This slide exhibits the real-time performance of waste collection and management vehicles providing valuable insights for operational decision making. It includes elements such as fleet status, vehicle halt area, fleet usage, job status, etc.
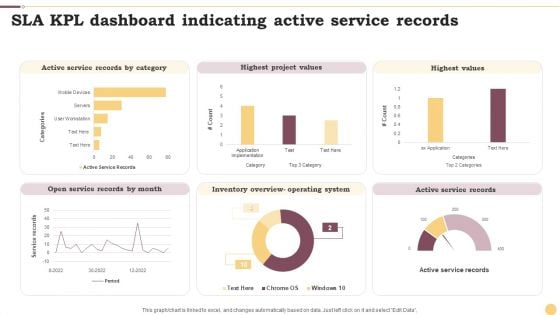
SLA KPL Dashboard Indicating Active Service Records Ppt Professional Graphics Example PDF
This graph or chart is linked to excel, and changes automatically based on data. Just left click on it and select Edit Data. Pitch your topic with ease and precision using this SLA KPL Dashboard Indicating Active Service Records Ppt Professional Graphics Example PDF. This layout presents information on Active Service Records, Highest Project Values, Highest Values. It is also available for immediate download and adjustment. So, changes can be made in the color, design, graphics or any other component to create a unique layout.
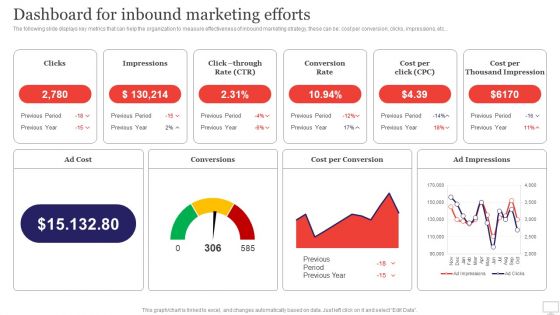
Target Audience Strategy For B2B And B2C Business Dashboard For Inbound Marketing Efforts Graphics PDF
The following slide displays key metrics that can help the organization to measure effectiveness of inbound marketing strategy, these can be cost per conversion, clicks, impressions, etc. If your project calls for a presentation, then Slidegeeks is your go-to partner because we have professionally designed, easy-to-edit templates that are perfect for any presentation. After downloading, you can easily edit Target Audience Strategy For B2B And B2C Business Dashboard For Inbound Marketing Efforts Graphics PDF and make the changes accordingly. You can rearrange slides or fill them with different images. Check out all the handy templates
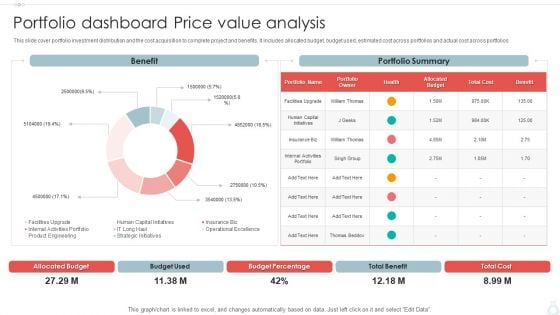
Portfolio Dashboard Price Value Analysis Ppt PowerPoint Presentation Gallery Model PDF
This slide cover portfolio investment distribution and the cost acquisition to complete project and benefits. It includes allocated budget, budget used, estimated cost across portfolios and actual cost across portfolios. Showcasing this set of slides titled Portfolio Dashboard Price Value Analysis Ppt PowerPoint Presentation Gallery Model PDF. The topics addressed in these templates are Portfolio Summary, Budget Percentage, Total Benefit, Total Cost. All the content presented in this PPT design is completely editable. Download it and make adjustments in color, background, font etc. as per your unique business setting.
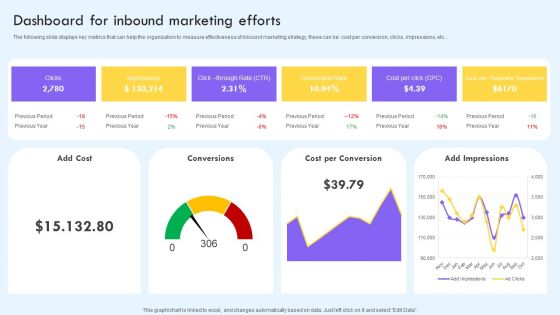
Dashboard For Inbound Marketing Efforts Ppt PowerPoint Presentation File Infographic Template PDF
The following slide displays key metrics that can help the organization to measure effectiveness of inbound marketing strategy, these can be cost per conversion, clicks, impressions, etc. If your project calls for a presentation, then Slidegeeks is your go to partner because we have professionally designed, easy to edit templates that are perfect for any presentation. After downloading, you can easily edit Dashboard For Inbound Marketing Efforts Ppt PowerPoint Presentation File Infographic Template PDF and make the changes accordingly. You can rearrange slides or fill them with different images. Check out all the handy templates.
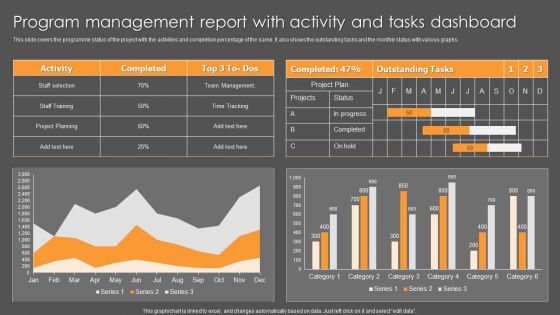
Program Management Report With Activity And Tasks Dashboard Ppt File Objects PDF
This slide covers the programme status of the project with the activities and completion percentage of the same. It also shows the outstanding tasks and the monthly status with various graphs. Pitch your topic with ease and precision using this Program Management Report With Activity And Tasks Dashboard Ppt File Objects PDF. This layout presents information on Activity, Team Management, Time Tracking. It is also available for immediate download and adjustment. So, changes can be made in the color, design, graphics or any other component to create a unique layout.
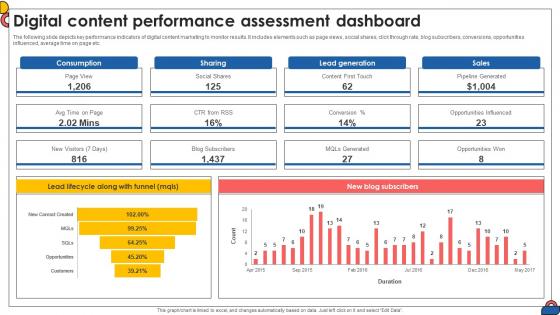
Digital Content Performance Assessment Dashboard Comprehensive Guide To Implement Strategy SS V
The following slide depicts key performance indicators of digital content marketing to monitor results. It includes elements such as page views, social shares, click through rate, blog subscribers, conversions, opportunities influenced, average time on page etc.If your project calls for a presentation, then Slidegeeks is your go-to partner because we have professionally designed, easy-to-edit templates that are perfect for any presentation. After downloading, you can easily edit Digital Content Performance Assessment Dashboard Comprehensive Guide To Implement Strategy SS V and make the changes accordingly. You can rearrange slides or fill them with different images. Check out all the handy templates The following slide depicts key performance indicators of digital content marketing to monitor results. It includes elements such as page views, social shares, click through rate, blog subscribers, conversions, opportunities influenced, average time on page etc.

Marketing Growth Strategy Performance Dashboard To Measure Marketing Strategy SS V
The following slide outlines key performance indicator KPI dashboard that can assist digital marketers to evaluate marketing campaign performance. The success metrics outlined in slide are total spend on advertisement, cost per thousand CPM, cost per click CPC, click-through rate CTR, etc. Take your projects to the next level with our ultimate collection of Marketing Growth Strategy Performance Dashboard To Measure Marketing Strategy SS V. Slidegeeks has designed a range of layouts that are perfect for representing task or activity duration, keeping track of all your deadlines at a glance. Tailor these designs to your exact needs and give them a truly corporate look with your own brand colors they will make your projects stand out from the rest The following slide outlines key performance indicator KPI dashboard that can assist digital marketers to evaluate marketing campaign performance. The success metrics outlined in slide are total spend on advertisement, cost per thousand CPM, cost per click CPC, click-through rate CTR, etc.
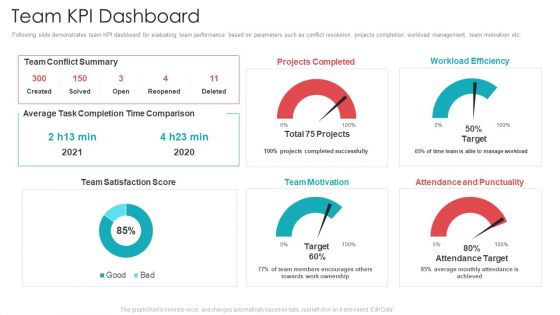
Official Team Collaboration Plan Team KPI Dashboard Ppt Gallery Backgrounds PDF
Following slide demonstrates team KPI dashboard for evaluating team performance based on parameters such as conflict resolution, projects completion, workload management, team motivation etc. Deliver an awe-inspiring pitch with this creative official team collaboration plan team kpi dashboard ppt gallery backgrounds pdf bundle. Topics like projects completed, workload efficiency, team motivation, attendance and punctuality, team satisfaction score can be discussed with this completely editable template. It is available for immediate download depending on the needs and requirements of the user.
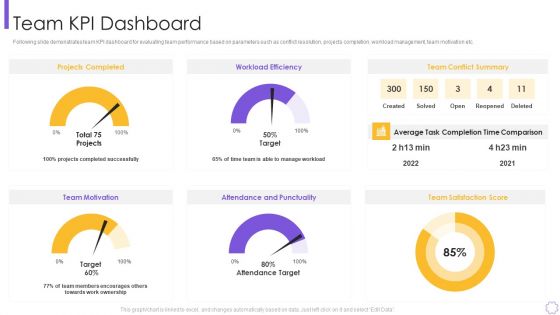
Process Optimization Through Product Life Process Management Techniques Team KPI Dashboard Mockup PDF
Following slide demonstrates team KPI dashboard for evaluating team performance based on parameters such as conflict resolution, projects completion, workload management, team motivation etc. Deliver and pitch your topic in the best possible manner with this process optimization through product life process management techniques team kpi dashboard mockup pdf Use them to share invaluable insights on projects completed, workload efficiency, team conflict summary and impress your audience. This template can be altered and modified as per your expectations. So, grab it now.
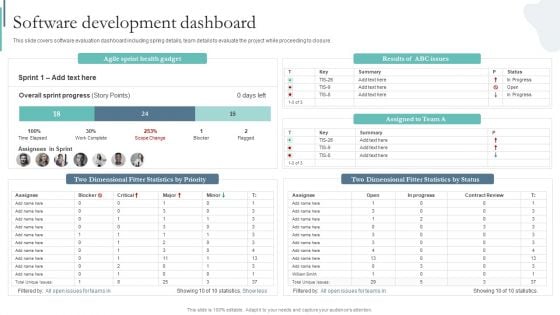
Agile Playbook For Program Designers Software Development Dashboard Ppt Infographics Brochure PDF
This slide covers software evaluation dashboard including spring details, team details to evaluate the project while proceeding to closure. If you are looking for a format to display your unique thoughts, then the professionally designed Agile Playbook For Program Designers Software Development Dashboard Ppt Infographics Brochure PDF is the one for you. You can use it as a Google Slides template or a PowerPoint template. Incorporate impressive visuals, symbols, images, and other charts. Modify or reorganize the text boxes as you desire. Experiment with shade schemes and font pairings. Alter, share or cooperate with other people on your work. Download Agile Playbook For Program Designers Software Development Dashboard Ppt Infographics Brochure PDF and find out how to give a successful presentation. Present a perfect display to your team and make your presentation unforgettable.
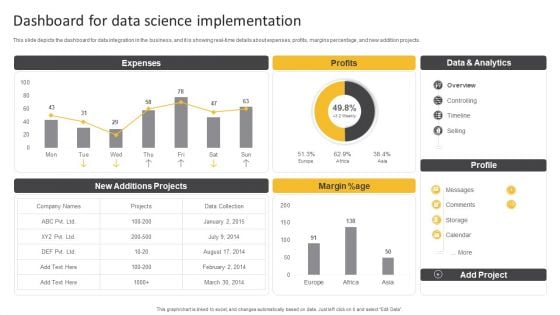
Information Science Dashboard For Data Science Implementation Ppt PowerPoint Presentation Slides Maker PDF
This slide depicts the dashboard for data integration in the business, and it is showing real-time details about expenses, profits, margins percentage, and new addition projects.Deliver and pitch your topic in the best possible manner with this Information Science Dashboard For Data Science Implementation Ppt PowerPoint Presentation Slides Maker PDF. Use them to share invaluable insights on Expenses, Data Analytics, New Projects and impress your audience. This template can be altered and modified as per your expectations. So, grab it now.
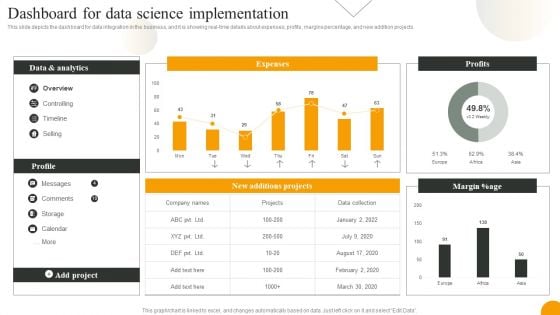
Using Data Science Technologies For Business Transformation Dashboard For Data Science Implementation Portrait PDF
This slide depicts the dashboard for data integration in the business, and it is showing real-time details about expenses, profits, margins percentage, and new addition projects. Take your projects to the next level with our ultimate collection of Using Data Science Technologies For Business Transformation Dashboard For Data Science Implementation Portrait PDF. Slidegeeks has designed a range of layouts that are perfect for representing task or activity duration, keeping track of all your deadlines at a glance. Tailor these designs to your exact needs and give them a truly corporate look with your own brand colors they will make your projects stand out from the rest.
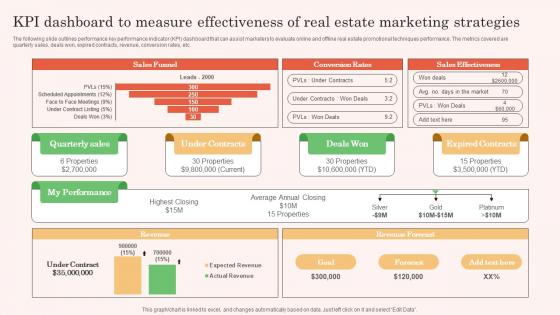
KPI Dashboard To Measure Effectivenesss Real Estate Property Marketing Themes Pdf
The following slide outlines performance key performance indicator KPI dashboard that can assist marketers to evaluate online and offline real estate promotional techniques performance. The metrics covered are quarterly sales, deals won, expired contracts, revenue, conversion rates, etc. Take your projects to the next level with our ultimate collection of KPI Dashboard To Measure Effectivenesss Real Estate Property Marketing Themes Pdf. Slidegeeks has designed a range of layouts that are perfect for representing task or activity duration, keeping track of all your deadlines at a glance. Tailor these designs to your exact needs and give them a truly corporate look with your own brand colors they all make your projects stand out from the rest. The following slide outlines performance key performance indicator KPI dashboard that can assist marketers to evaluate online and offline real estate promotional techniques performance. The metrics covered are quarterly sales, deals won, expired contracts, revenue, conversion rates, etc.
Undertaking Handover Strategy Icon For Project Transferred To New Manager Download PDF
Presenting Undertaking Handover Strategy Icon For Project Transferred To New Manager Download PDF to dispense important information. This template comprises three stages. It also presents valuable insights into the topics including Undertaking Handover Strategy Icon, Project Transferred New Manager. This is a completely customizable PowerPoint theme that can be put to use immediately. So, download it and address the topic impactfully.
KPI Dashboard For Tracking Monthly Personal Comprehensive Smartphone Banking Introduction Pdf
This slide shows dashboard which can be used by individuals to track monthly expenses in order to get better understanding of hisorher finances. It includes metrics such as users spending, savings, debt, etc.Take your projects to the next level with our ultimate collection of KPI Dashboard For Tracking Monthly Personal Comprehensive Smartphone Banking Introduction Pdf. Slidegeeks has designed a range of layouts that are perfect for representing task or activity duration, keeping track of all your deadlines at a glance. Tailor these designs to your exact needs and give them a truly corporate look with your own brand colors they all make your projects stand out from the rest. This slide shows dashboard which can be used by individuals to track monthly expenses in order to get better understanding of hisorher finances. It includes metrics such as users spending, savings, debt, etc.
KPI Dashboard For Tracking Social Implementing Marketing Tactics To Drive Sample Pdf
This slide covers the dashboard for analyzing social media marketing campaigns. It includes metrics such as tweets, followers, followings, listed favorites, reach, views, Facebook engagement, clicks, likes, Instagram photos, etc. Take your projects to the next level with our ultimate collection of KPI Dashboard For Tracking Social Implementing Marketing Tactics To Drive Sample Pdf. Slidegeeks has designed a range of layouts that are perfect for representing task or activity duration, keeping track of all your deadlines at a glance. Tailor these designs to your exact needs and give them a truly corporate look with your own brand colors they well make your projects stand out from the rest. This slide covers the dashboard for analyzing social media marketing campaigns. It includes metrics such as tweets, followers, followings, listed favorites, reach, views, Facebook engagement, clicks, likes, Instagram photos, etc.
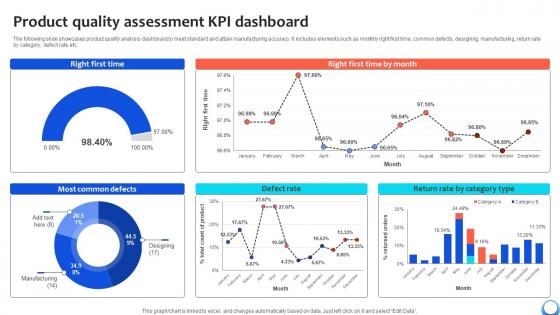
Product Quality Assessment KPI Dashboard Automating Production Process Strategy SS V
The following slide showcases product quality analysis dashboard to meet standard and attain manufacturing accuracy. It includes elements such as monthly right first time, common defects, designing, manufacturing, return rate by category, defect rate etc. Take your projects to the next level with our ultimate collection of Product Quality Assessment KPI Dashboard Automating Production Process Strategy SS V. Slidegeeks has designed a range of layouts that are perfect for representing task or activity duration, keeping track of all your deadlines at a glance. Tailor these designs to your exact needs and give them a truly corporate look with your own brand colors they will make your projects stand out from the rest The following slide showcases product quality analysis dashboard to meet standard and attain manufacturing accuracy. It includes elements such as monthly right first time, common defects, designing, manufacturing, return rate by category, defect rate etc.
Icon For Measuring Customer Satisfaction In Quality Kpis Of Project Management Template PDF
Presenting Icon For Measuring Customer Satisfaction In Quality Kpis Of Project Management Template PDF to dispense important information. This template comprises three stages. It also presents valuable insights into the topics including Icon For Measuring Customer, Satisfaction In Quality, Kpis Of Project Management. This is a completely customizable PowerPoint theme that can be put to use immediately. So, download it and address the topic impactfully.
Icon For Quality Kpis In Project Management Showing Business Crisis Portrait PDF
Persuade your audience using this Icon For Quality Kpis In Project Management Showing Business Crisis Portrait PDF. This PPT design covers three stages, thus making it a great tool to use. It also caters to a variety of topics including Icon For Quality Kpis, Project Management, Showing Business Crisis. Download this PPT design now to present a convincing pitch that not only emphasizes the topic but also showcases your presentation skills.
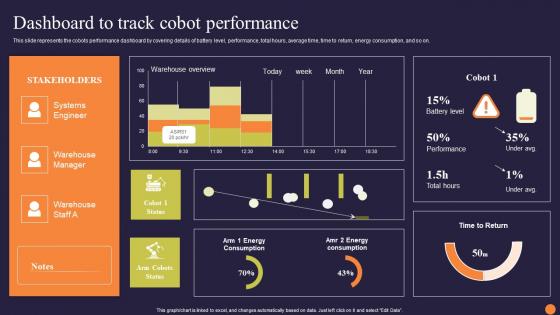
Collaborative Robots Revolutionizing Workforce Efficiency Dashboard To Track Cobot Download Pdf
This slide represents the cobots performance dashboard by covering details of battery level, performance, total hours, average time, time to return, energy consumption, and so on. If your project calls for a presentation, then Slidegeeks is your go to partner because we have professionally designed, easy to edit templates that are perfect for any presentation. After downloading, you can easily edit Collaborative Robots Revolutionizing Workforce Efficiency Dashboard To Track Cobot Download Pdf and make the changes accordingly. You can rearrange slides or fill them with different images. Check out all the handy templates. This slide represents the cobots performance dashboard by covering details of battery level, performance, total hours, average time, time to return, energy consumption, and so on.
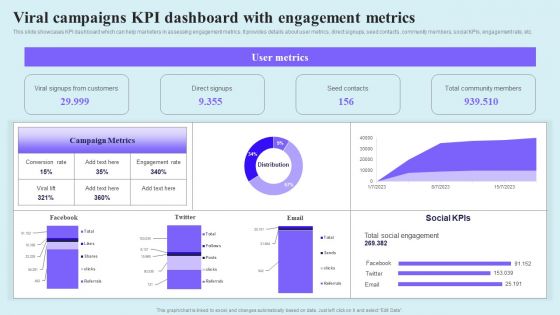
Go Viral Campaign Strategies To Increase Engagement Viral Campaigns KPI Dashboard With Engagement Demonstration PDF
This slide showcases KPI dashboard which can help marketers in assessing engagement metrics. It provides details about user metrics, direct signups, seed contacts, community members, social KPIs, engagement rate, etc. Take your projects to the next level with our ultimate collection of Go Viral Campaign Strategies To Increase Engagement Viral Campaigns KPI Dashboard With Engagement Demonstration PDF. Slidegeeks has designed a range of layouts that are perfect for representing task or activity duration, keeping track of all your deadlines at a glance. Tailor these designs to your exact needs and give them a truly corporate look with your own brand colors they will make your projects stand out from the rest.


 Continue with Email

 Home
Home


