Project Progress Dashboard
Roadmap For Predictive Analytics Model Predictive Analytics For Improved Rules Pdf
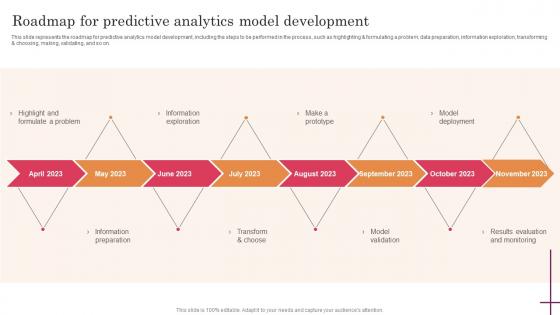
This slide represents the roadmap for predictive analytics model development, including the steps to be performed in the process, such as highlighting and formulating a problem, data preparation, information exploration, transforming and choosing, making, validating, and so on. Create an editable Roadmap For Predictive Analytics Model Predictive Analytics For Improved Rules Pdf that communicates your idea and engages your audience. Whether you are presenting a business or an educational presentation, pre-designed presentation templates help save time. Roadmap For Predictive Analytics Model Predictive Analytics For Improved Rules Pdf is highly customizable and very easy to edit, covering many different styles from creative to business presentations. Slidegeeks has creative team members who have crafted amazing templates. So, go and get them without any delay. This slide represents the roadmap for predictive analytics model development, including the steps to be performed in the process, such as highlighting and formulating a problem, data preparation, information exploration, transforming and choosing, making, validating, and so on.
Functional Data Analysis To Predict Stock Market Trends Ppt PowerPoint Presentation Pictures Graphic Tips
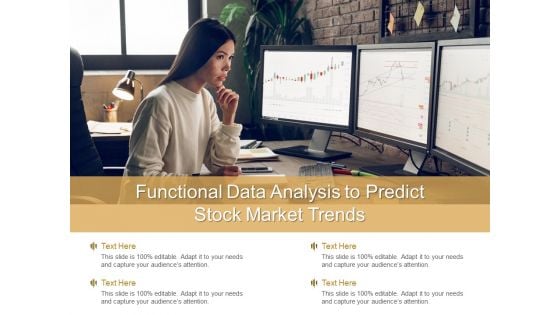
Presenting this set of slides with name functional data analysis to predict stock market trends ppt powerpoint presentation pictures graphic tips. This is a one stage process. The stages in this process are functional data analysis to predict stock market trends. This is a completely editable PowerPoint presentation and is available for immediate download. Download now and impress your audience.
Business Diagram Big Data From Descriptive To Predictive Presentation Template
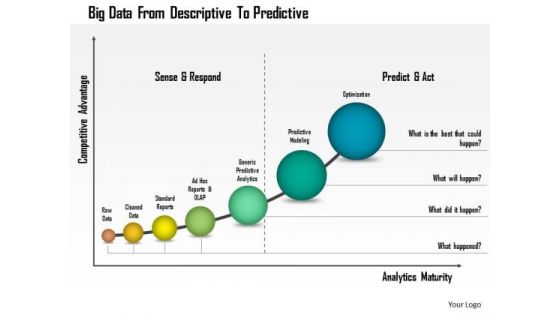
This business diagram has been designed with graphic of linear bar graph. This growing bar graph depicts the concept of big data analysis. Use this professional diagram for your financial and business analysis.
AI Model To Calculate Probability Of Debt Payment Rules Pdf
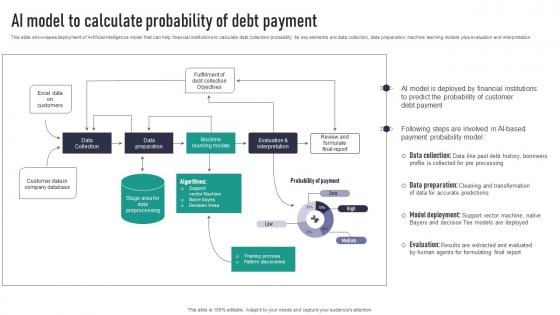
This slide showcases deployment of Artificial intelligence model that can help financial institutions to calculate debt collection probability. Its key elements are data collection, data preparation, machine learning models plus evaluation and interpretation. Crafting an eye-catching presentation has never been more straightforward. Let your presentation shine with this tasteful yet straightforward AI Model To Calculate Probability Of Debt Payment Rules Pdf template. It offers a minimalistic and classy look that is great for making a statement. The colors have been employed intelligently to add a bit of playfulness while still remaining professional. Construct the ideal AI Model To Calculate Probability Of Debt Payment Rules Pdf that effortlessly grabs the attention of your audience Begin now and be certain to wow your customers This slide showcases deployment of Artificial intelligence model that can help financial institutions to calculate debt collection probability. Its key elements are data collection, data preparation, machine learning models plus evaluation and interpretation.

Stages Of Pie Chart Data Interpretation Business Plan Template PowerPoint Templates
We present our stages of pie chart data interpretation business plan template PowerPoint templates.Download and present our Circle Charts PowerPoint Templates because You can Stir your ideas in the cauldron of our PowerPoint Templates and Slides. Cast a magic spell on your audience. Download our Marketing PowerPoint Templates because Our PowerPoint Templates and Slides will let you Hit the target. Go the full distance with ease and elan. Use our Business PowerPoint Templates because Our PowerPoint Templates and Slides are truly out of this world. Even the MIB duo has been keeping tabs on our team. Download our Shapes PowerPoint Templates because Watching this your Audience will Grab their eyeballs, they wont even blink. Download our Process and Flows PowerPoint Templates because It will Give impetus to the hopes of your colleagues. Our PowerPoint Templates and Slides will aid you in winning their trust.Use these PowerPoint slides for presentations relating to achievement, analysis, background, bank, banking, business, calculation, chart, circle, commerce, commercial, commission, concept, credit, crisis, debt, deposit, design, detail, diagram, earnings, economics, economy, element, finance, goal, gold, golden, graph, graphic, growth, icon, idea, illustration, income, increase, invest, isolated, level, loss, market, marketing, metal, modern, money, new, object, part, percent, percentage, pie, plot, politics, profit, progress, ratio, reflection, reflective. The prominent colors used in the PowerPoint template are Blue, Gray, Black. Feed their curiosity with our Stages Of Pie Chart Data Interpretation Business Plan Template PowerPoint Templates. Arouse expectations with your thoughts.
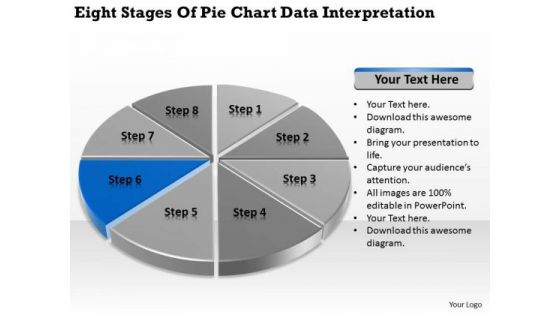
Stages Of Pie Chart Data Interpretation Example Business Plan PowerPoint Slides
We present our stages of pie chart data interpretation example business plan PowerPoint Slides.Download and present our Circle Charts PowerPoint Templates because It will let you Set new benchmarks with our PowerPoint Templates and Slides. They will keep your prospects well above par. Download our Marketing PowerPoint Templates because Our PowerPoint Templates and Slides will weave a web of your great ideas. They are gauranteed to attract even the most critical of your colleagues. Use our Business PowerPoint Templates because It will Strengthen your hand with your thoughts. They have all the aces you need to win the day. Present our Shapes PowerPoint Templates because It will get your audience in sync. Present our Process and Flows PowerPoint Templates because Our PowerPoint Templates and Slides will generate and maintain the level of interest you desire. They will create the impression you want to imprint on your audience.Use these PowerPoint slides for presentations relating to achievement, analysis, background, bank, banking, business, calculation, chart, circle, commerce, commercial, commission, concept, credit, crisis, debt, deposit, design, detail, diagram, earnings, economics, economy, element, finance, goal, gold, golden, graph, graphic, growth, icon, idea, illustration, income, increase, invest, isolated, level, loss, market, marketing, metal, modern, money, new, object, part, percent, percentage, pie, plot, politics, profit, progress, ratio, reflection, reflective. The prominent colors used in the PowerPoint template are Blue navy, Gray, Black. Add emphasis to your ideas with our Stages Of Pie Chart Data Interpretation Example Business Plan PowerPoint Slides. Lend greater credence to your expression.
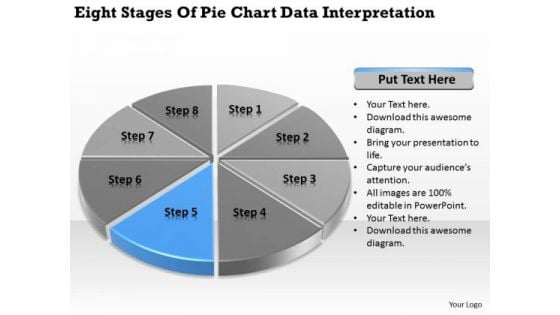
Stages Of Pie Chart Data Interpretation How To Write Business Plan PowerPoint Templates
We present our stages of pie chart data interpretation how to write business plan PowerPoint templates.Present our Circle Charts PowerPoint Templates because Our PowerPoint Templates and Slides will provide you a launch platform. Give a lift off to your ideas and send them into orbit. Present our Marketing PowerPoint Templates because Our PowerPoint Templates and Slides will let you Hit the right notes. Watch your audience start singing to your tune. Use our Business PowerPoint Templates because Our PowerPoint Templates and Slides come in all colours, shades and hues. They help highlight every nuance of your views. Download our Shapes PowerPoint Templates because It can Leverage your style with our PowerPoint Templates and Slides. Charm your audience with your ability. Use our Process and Flows PowerPoint Templates because You can Connect the dots. Fan expectations as the whole picture emerges.Use these PowerPoint slides for presentations relating to achievement, analysis, background, bank, banking, business, calculation, chart, circle, commerce, commercial, commission, concept, credit, crisis, debt, deposit, design, detail, diagram, earnings, economics, economy, element, finance, goal, gold, golden, graph, graphic, growth, icon, idea, illustration, income, increase, invest, isolated, level, loss, market, marketing, metal, modern, money, new, object, part, percent, percentage, pie, plot, politics, profit, progress, ratio, reflection, reflective. The prominent colors used in the PowerPoint template are Blue, Gray, Black. Our Stages Of Pie Chart Data Interpretation How To Write Business Plan PowerPoint Templates avoid exaggerations. They keep you away from any farce.
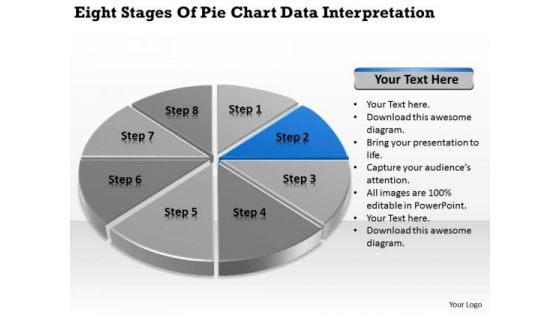
Stages Of Pie Chart Data Interpretation Vending Machine Business Plan PowerPoint Slides
We present our stages of pie chart data interpretation vending machine business plan PowerPoint Slides.Present our Circle Charts PowerPoint Templates because You should Bet on your luck with our PowerPoint Templates and Slides. Be assured that you will hit the jackpot. Present our Marketing PowerPoint Templates because Our PowerPoint Templates and Slides will provide you the cutting edge. Slice through the doubts in the minds of your listeners. Download our Business PowerPoint Templates because you should Experience excellence with our PowerPoint Templates and Slides. They will take your breath away. Download our Shapes PowerPoint Templates because It will Raise the bar of your Thoughts. They are programmed to take you to the next level. Present our Process and Flows PowerPoint Templates because Our PowerPoint Templates and Slides will give good value for money. They also have respect for the value of your time.Use these PowerPoint slides for presentations relating to achievement, analysis, background, bank, banking, business, calculation, chart, circle, commerce, commercial, commission, concept, credit, crisis, debt, deposit, design, detail, diagram, earnings, economics, economy, element, finance, goal, gold, golden, graph, graphic, growth, icon, idea, illustration, income, increase, invest, isolated, level, loss, market, marketing, metal, modern, money, new, object, part, percent, percentage, pie, plot, politics, profit, progress, ratio, reflection, reflective. The prominent colors used in the PowerPoint template are Blue, Gray, Black. Our Stages Of Pie Chart Data Interpretation Vending Machine Business Plan PowerPoint Slides come at a comfortable cost. They are definitely an economical choice.
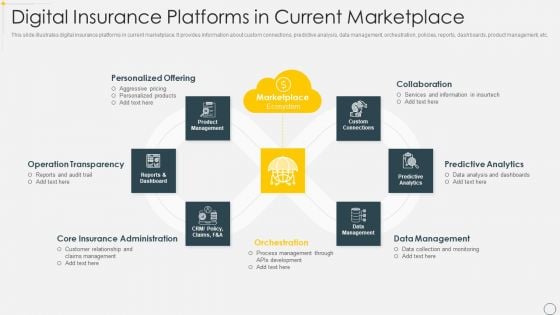
Digital Insurance Platforms In Current Marketplace Slides PDF
This slide illustrates digital insurance platforms in current marketplace. It provides information about custom connections, predictive analysis, data management, orchestration, policies, reports, dashboards, product management, etc. Persuade your audience using this Digital Insurance Platforms In Current Marketplace Slides PDF. This PPT design covers seven stages, thus making it a great tool to use. It also caters to a variety of topics including Operation Transparency, Personalized Offering, Data Management. Download this PPT design now to present a convincing pitch that not only emphasizes the topic but also showcases your presentation skills.
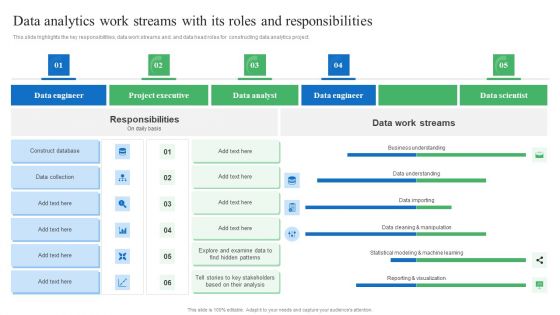
Data Analytics Work Streams With Its Roles And Responsibilities Rules PDF
This slide highlights the key responsibilities, data work streams and. and data head roles for constructing data analytics project. Here you can discover an assortment of the finest PowerPoint and Google Slides templates. With these templates, you can create presentations for a variety of purposes while simultaneously providing your audience with an eye catching visual experience. Download Data Analytics Work Streams With Its Roles And Responsibilities Rules PDF to deliver an impeccable presentation. These templates will make your job of preparing presentations much quicker, yet still, maintain a high level of quality. Slidegeeks has experienced researchers who prepare these templates and write high quality content for you. Later on, you can personalize the content by editing the Data Analytics Work Streams With Its Roles And Responsibilities Rules PDF.
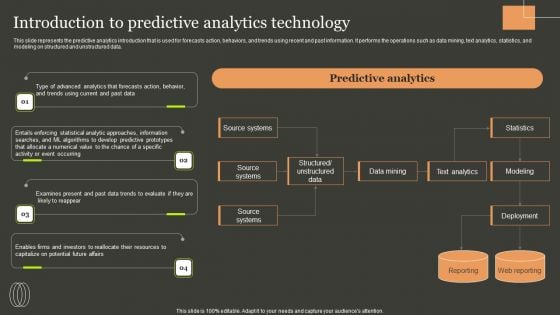
Predictive Analytics Methods Introduction To Predictive Analytics Technology Clipart PDF
This slide represents the predictive analytics introduction that is used for forecasts action, behaviors, and trends using recent and past information. It performs the operations such as data mining, text analytics, statistics, and modeling on structured and unstructured data. Do you have to make sure that everyone on your team knows about any specific topic I yes, then you should give Predictive Analytics Methods Introduction To Predictive Analytics Technology Clipart PDF a try. Our experts have put a lot of knowledge and effort into creating this impeccable Predictive Analytics Methods Introduction To Predictive Analytics Technology Clipart PDF. You can use this template for your upcoming presentations, as the slides are perfect to represent even the tiniest detail. You can download these templates from the Slidegeeks website and these are easy to edit. So grab these today.
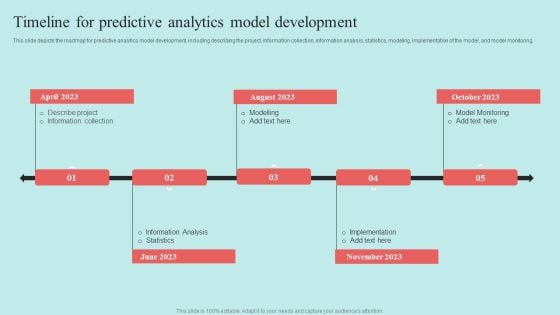
Predictive Data Model Timeline For Predictive Analytics Model Development Elements PDF

Most Common Predictive Analytics Software Developing Strategic Insights Using Big Data Analytics SS V
This slide showcases major software providers for predictive analytics based on company revenue. It provides information regarding companies such as microsoft, siemens, IBM corporation, oracle , google cloud and SAS institute inc. Make sure to capture your audiences attention in your business displays with our gratis customizable Most Common Predictive Analytics Software Developing Strategic Insights Using Big Data Analytics SS V. These are great for business strategies, office conferences, capital raising or task suggestions. If you desire to acquire more customers for your tech business and ensure they stay satisfied, create your own sales presentation with these plain slides. This slide showcases major software providers for predictive analytics based on company revenue. It provides information regarding companies such as microsoft, siemens, IBM corporation, oracle , google cloud and SAS institute inc.

Drug Discovery And Development Process Step 2 Preclinical Research Proof Summary PDF
This slide provides information about the second step in the drug discovery and development process i.e. preclinical research. Preclinical Research includes various elements such as absorption, distribution, disposition, metabolism, in vivo, in vitro, ex vivo assays, in silico assays, drug delivery methods etc. This is a drug discovery and development process step 2 preclinical research proof summary pdf template with various stages. Focus and dispense information on three stages using this creative set, that comes with editable features. It contains large content boxes to add your information on topics like development, projects, process. You can also showcase facts, figures, and other relevant content using this PPT layout. Grab it now.
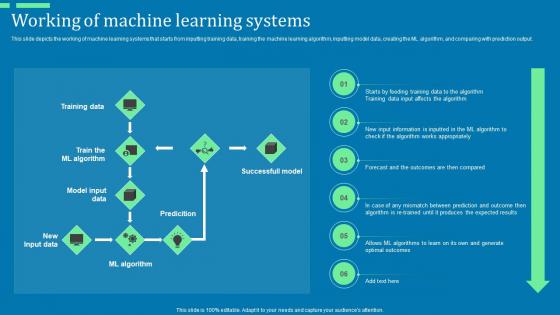
Working Of Machine Learning Systems Advanced Tools For Hyperautomation Ppt Summary Structure Pdf
This slide depicts the working of machine learning systems that starts from inputting training data, training the machine learning algorithm, inputting model data, creating the ML algorithm, and comparing with prediction output. The best PPT templates are a great way to save time, energy, and resources. Slidegeeks have 100 percent editable powerpoint slides making them incredibly versatile. With these quality presentation templates, you can create a captivating and memorable presentation by combining visually appealing slides and effectively communicating your message. Download Working Of Machine Learning Systems Advanced Tools For Hyperautomation Ppt Summary Structure Pdf from Slidegeeks and deliver a wonderful presentation. This slide depicts the working of machine learning systems that starts from inputting training data, training the machine learning algorithm, inputting model data, creating the ML algorithm, and comparing with prediction output.

Predictive Data Model Neural Network Model For Predictive Analytics Structure PDF
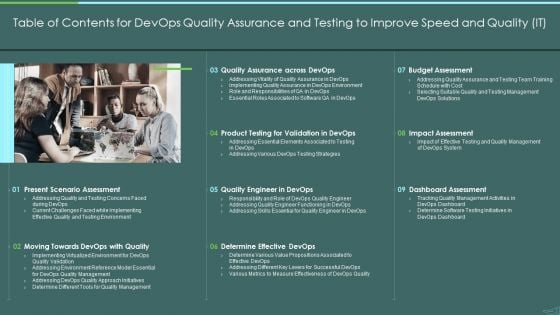
Table Of Contents For Devops Quality Assurance And Testing To Improve Speed And Quality IT Mockup PDF
Presenting table of contents for devops quality assurance and testing to improve speed and quality it mockup pdf to provide visual cues and insights. Share and navigate important information on nine stages that need your due attention. This template can be used to pitch topics like effective, dashboard, budget, impact assessment, management . In addtion, this PPT design contains high resolution images, graphics, etc, that are easily editable and available for immediate download.
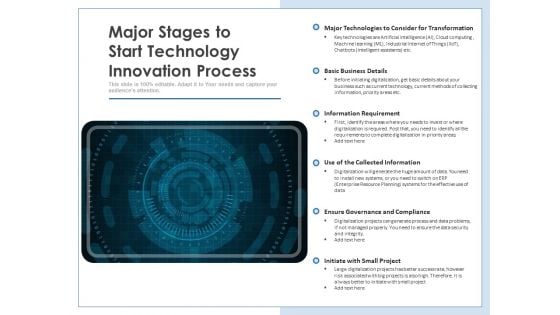
Major Stages To Start Technology Innovation Process Ppt PowerPoint Presentation Show Pictures PDF
Persuade your audience using this major stages to start technology innovation process ppt powerpoint presentation show pictures pdf. This PPT design covers one stages, thus making it a great tool to use. It also caters to a variety of topics including major technologies to consider for transformation, basic business details, information requirement, use of the collected information, ensure governance and compliance, initiate with small project. Download this PPT design now to present a convincing pitch that not only emphasizes the topic but also showcases your presentation skills.
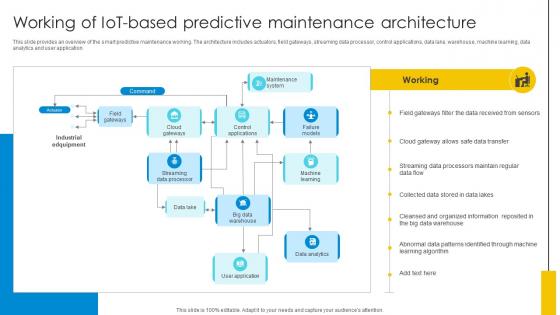
Working Of IoT Based Predictive Maintenance Architecture Optimizing Inventory Management IoT SS V
This slide provides an overview of the smart predictive maintenance working. The architecture includes actuators, field gateways, streaming data processor, control applications, data lake, warehouse, machine learning, data analytics and user application. There are so many reasons you need a Working Of IoT Based Predictive Maintenance Architecture Optimizing Inventory Management IoT SS V. The first reason is you can not spend time making everything from scratch, Thus, Slidegeeks has made presentation templates for you too. You can easily download these templates from our website easily. This slide provides an overview of the smart predictive maintenance working. The architecture includes actuators, field gateways, streaming data processor, control applications, data lake, warehouse, machine learning, data analytics and user application.
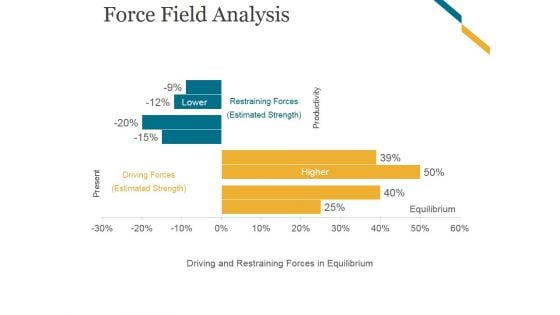
Force Field Analysis Template 2 Ppt PowerPoint Presentation Themes
This is a force field analysis template 2 ppt powerpoint presentation themes. This is a two stage process. The stages in this process are restraining forces, driving forces, estimated strength, equilibrium.
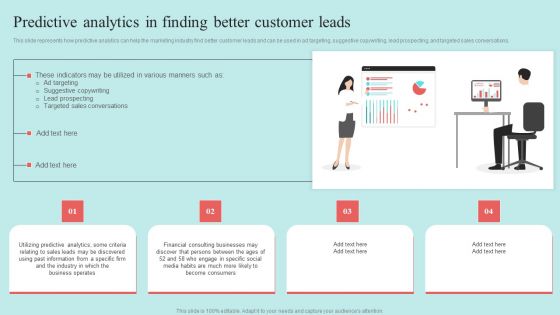
Predictive Data Model Predictive Analytics In Finding Better Customer Leads Sample PDF
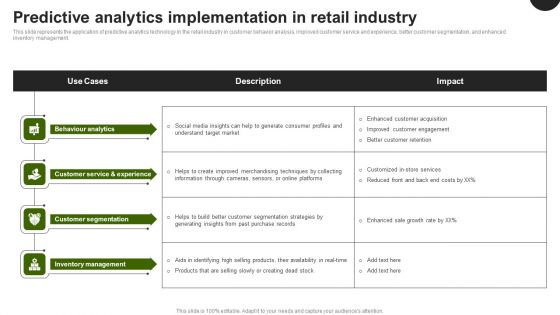
Predictive Analytics In The Age Of Big Data Predictive Analytics Implementation In Retail Industry Themes PDF
This slide represents the application of predictive analytics technology in the retail industry in customer behavior analysis, improved customer service and experience, better customer segmentation, and enhanced inventory management. Coming up with a presentation necessitates that the majority of the effort goes into the content and the message you intend to convey. The visuals of a PowerPoint presentation can only be effective if it supplements and supports the story that is being told. Keeping this in mind our experts created Predictive Analytics In The Age Of Big Data Predictive Analytics Implementation In Retail Industry Themes PDF to reduce the time that goes into designing the presentation. This way, you can concentrate on the message while our designers take care of providing you with the right template for the situation.
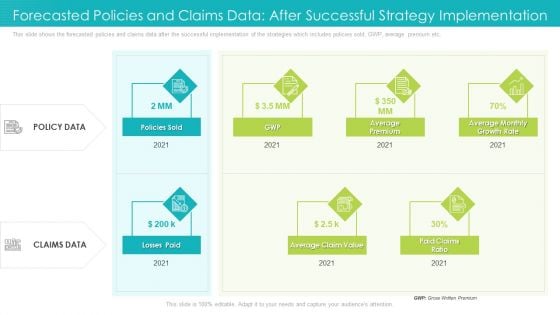
Forecasted Policies And Claims Data After Successful Strategy Implementation Ppt Model Introduction PDF
This slide shows the forecasted policies and claims data after the successful implementation of the strategies which includes policies sold, GWP, average premium etc. This is a forecasted policies and claims data after successful strategy implementation ppt model introduction pdf template with various stages. Focus and dispense information on two stages using this creative set, that comes with editable features. It contains large content boxes to add your information on topics like average premium, paid claims ratio, 2021. You can also showcase facts, figures, and other relevant content using this PPT layout. Grab it now.
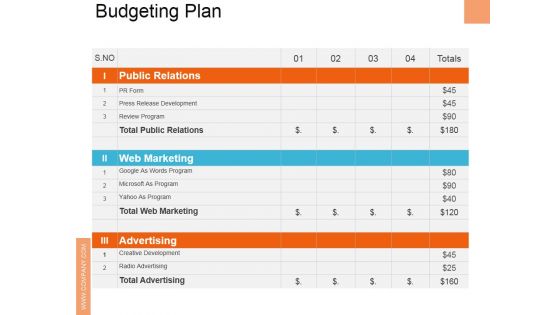
Budgeting Plan Ppt PowerPoint Presentation Show Slide Download
This is a budgeting plan ppt powerpoint presentation show slide download. This is a four stage process. The stages in this process are public relations, web marketing, advertising, press release development, review program.
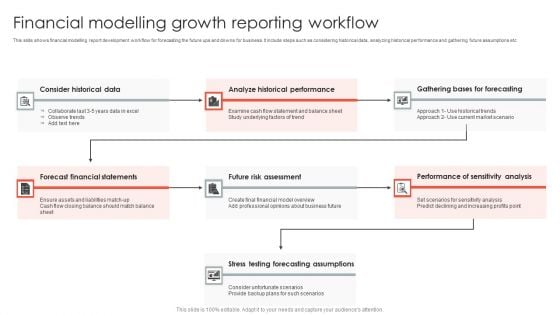
Financial Modelling Growth Reporting Workflow Formats PDF
This slide shows financial modelling report development workflow for forecasting the future ups and downs for business. It include steps such as considering historical data, analyzing historical performance and gathering future assumptions etc. Pitch your topic with ease and precision using this Financial Modelling Growth Reporting Workflow Formats PDF. This layout presents information on Forecast Financial Statements, Risk Assessment, Forecasting Assumptions. It is also available for immediate download and adjustment. So, changes can be made in the color, design, graphics or any other component to create a unique layout.
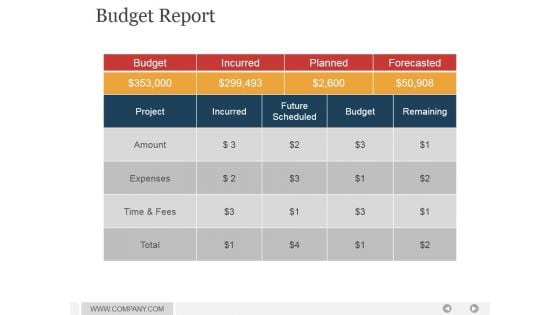
Budget Report Ppt PowerPoint Presentation Backgrounds
This is a budget report ppt powerpoint presentation backgrounds. This is a four stage process. The stages in this process are project, incurred, future scheduled, budget, remaining.
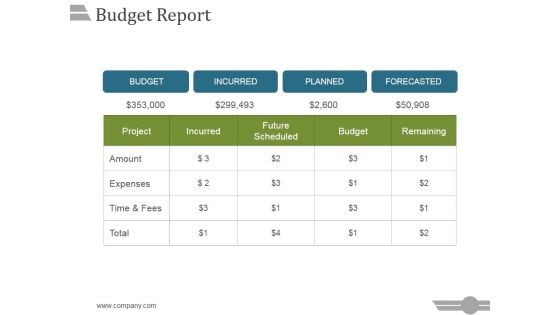
Budget Report Ppt PowerPoint Presentation Topics
This is a budget report ppt powerpoint presentation topics. This is a five stage process. The stages in this process are project, incurred, future scheduled, budget, remaining.
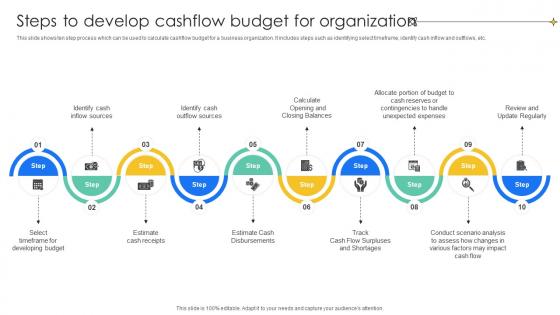
Steps To Develop Cashflow Budget For Effective And Efficient Tools To Develop Fin SS V
This slide shows ten step process which can be used to calculate cashflow budget for a business organization. It includes steps such as identifying select timeframe, identify cash inflow and outflows, etc. The Steps To Develop Cashflow Budget For Effective And Efficient Tools To Develop Fin SS V is a compilation of the most recent design trends as a series of slides. It is suitable for any subject or industry presentation, containing attractive visuals and photo spots for businesses to clearly express their messages. This template contains a variety of slides for the user to input data, such as structures to contrast two elements, bullet points, and slides for written information. Slidegeeks is prepared to create an impression. This slide shows ten step process which can be used to calculate cashflow budget for a business organization. It includes steps such as identifying select timeframe, identify cash inflow and outflows, etc.
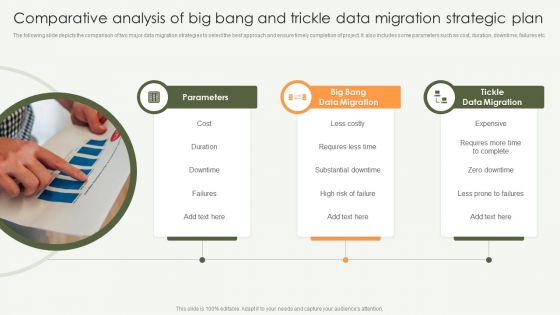
Comparative Analysis Of Big Bang And Trickle Data Migration Strategic Plan Designs PDF
The following slide depicts the comparison of two major data migration strategies to select the best approach and ensure timely completion of project. It also includes some parameters such as cost, duration, downtime, failures etc. Persuade your audience using this Comparative Analysis Of Big Bang And Trickle Data Migration Strategic Plan Designs PDF. This PPT design covers three stages, thus making it a great tool to use. It also caters to a variety of topics including Big Bang Data Migration, Tickle Data Migration, Cost. Download this PPT design now to present a convincing pitch that not only emphasizes the topic but also showcases your presentation skills.
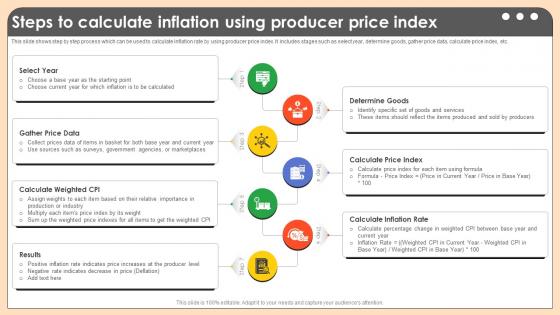
Steps To Calculate Inflation Using Producer Comprehensive Guide On Inflation Control CM SS V
This slide shows step by step process which can be used to calculate inflation rate by using producer price index. It includes stages such as select year, determine goods, gather price data, calculate price index, etc. Present like a pro with Steps To Calculate Inflation Using Producer Comprehensive Guide On Inflation Control CM SS V. Create beautiful presentations together with your team, using our easy-to-use presentation slides. Share your ideas in real-time and make changes on the fly by downloading our templates. So whether you are in the office, on the go, or in a remote location, you can stay in sync with your team and present your ideas with confidence. With Slidegeeks presentation got a whole lot easier. Grab these presentations today. This slide shows step by step process which can be used to calculate inflation rate by using producer price index. It includes stages such as select year, determine goods, gather price data, calculate price index, etc.
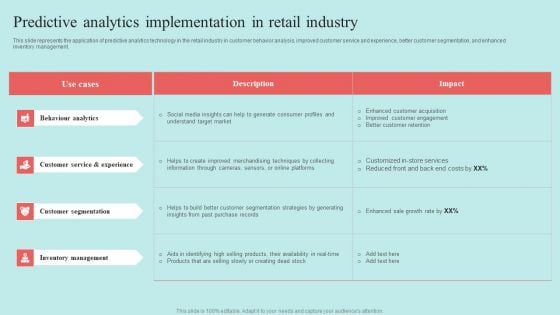
Predictive Data Model Predictive Analytics Implementation In Retail Industry Topics PDF
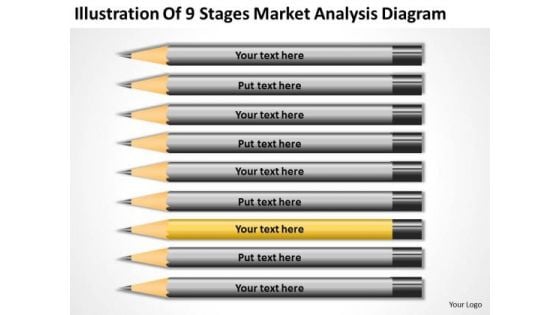
Illustration Of 9 Stages Market Analysis Diagram Ppt Business Plan Companies PowerPoint Slides
We present our illustration of 9 stages market analysis diagram ppt business plan companies PowerPoint Slides.Present our Communication PowerPoint Templates because Our PowerPoint Templates and Slides will definately Enhance the stature of your presentation. Adorn the beauty of your thoughts with their colourful backgrounds. Present our Marketing PowerPoint Templates because Our PowerPoint Templates and Slides offer you the needful to organise your thoughts. Use them to list out your views in a logical sequence. Download and present our Business PowerPoint Templates because Our PowerPoint Templates and Slides are aesthetically designed to attract attention. We gaurantee that they will grab all the eyeballs you need. Present our Shapes PowerPoint Templates because It is Aesthetically crafted by artistic young minds. Our PowerPoint Templates and Slides are designed to display your dexterity. Download our Process and Flows PowerPoint Templates because Our PowerPoint Templates and Slides offer you the widest possible range of options.Use these PowerPoint slides for presentations relating to Market, sales, statistics, economy, target, achievement, corporate, business, success, presentation, diagram, finance, data, stock, analysis, flowchart, drawing, report, calculation, graph, illustration, economic, chart, money, pie-chart, planning, design, growth, pencil, company, competition, progress, investment, analyze, office, banking, financial, cash, exchange. The prominent colors used in the PowerPoint template are Yellow, Gray, Black. Present like a genius. Our Illustration Of 9 Stages Market Analysis Diagram Ppt Business Plan Companies PowerPoint Slides help you play the part.
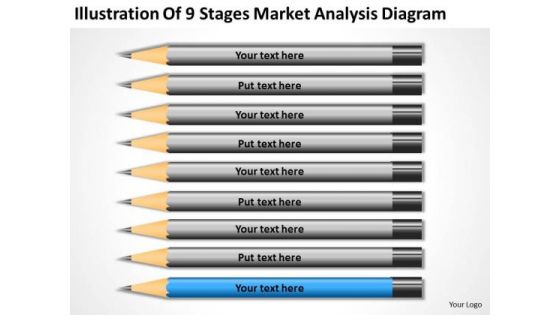
Illustration Of 9 Stages Market Analysis Diagram Ppt Personal Business Plan PowerPoint Templates
We present our illustration of 9 stages market analysis diagram ppt personal business plan PowerPoint templates.Download and present our Communication PowerPoint Templates because Our PowerPoint Templates and Slides will let you Clearly mark the path for others to follow. Use our Marketing PowerPoint Templates because You can Bait your audience with our PowerPoint Templates and Slides. They will bite the hook of your ideas in large numbers. Use our Business PowerPoint Templates because Our PowerPoint Templates and Slides provide you with a vast range of viable options. Select the appropriate ones and just fill in your text. Download our Shapes PowerPoint Templates because You can Hit the nail on the head with our PowerPoint Templates and Slides. Embed your ideas in the minds of your audience. Download our Process and Flows PowerPoint Templates because Our PowerPoint Templates and Slides are conceived by a dedicated team. Use them and give form to your wondrous ideas.Use these PowerPoint slides for presentations relating to Market, sales, statistics, economy, target, achievement, corporate, business, success, presentation, diagram, finance, data, stock, analysis, flowchart, drawing, report, calculation, graph, illustration, economic, chart, money, pie-chart, planning, design, growth, pencil, company, competition, progress, investment, analyze, office, banking, financial, cash, exchange. The prominent colors used in the PowerPoint template are Blue, Gray, Black. Allow your thoughts to flow with our Illustration Of 9 Stages Market Analysis Diagram Ppt Personal Business Plan PowerPoint Templates. They will develop your creative aptitude.
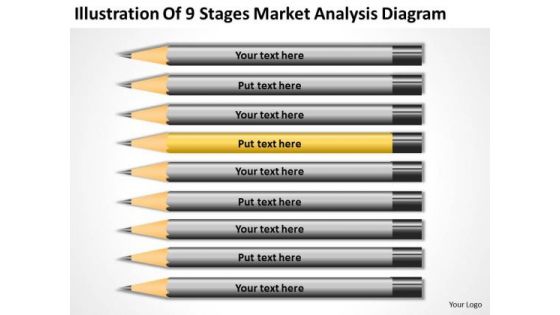
Illustration Of 9 Stages Market Analysis Diagram Business Plan PowerPoint Templates
We present our illustration of 9 stages market analysis diagram business plan PowerPoint templates.Download and present our Communication PowerPoint Templates because Our PowerPoint Templates and Slides will let you Hit the target. Go the full distance with ease and elan. Present our Marketing PowerPoint Templates because Our PowerPoint Templates and Slides will weave a web of your great ideas. They are gauranteed to attract even the most critical of your colleagues. Download and present our Business PowerPoint Templates because Our PowerPoint Templates and Slides help you meet the demand of the Market. Just browse and pick the slides that appeal to your intuitive senses. Present our Shapes PowerPoint Templates because Timeline crunches are a fact of life. Meet all deadlines using our PowerPoint Templates and Slides. Present our Process and Flows PowerPoint Templates because Our PowerPoint Templates and Slides will let you Clearly mark the path for others to follow.Use these PowerPoint slides for presentations relating to Market, sales, statistics, economy, target, achievement, corporate, business, success, presentation, diagram, finance, data, stock, analysis, flowchart, drawing, report, calculation, graph, illustration, economic, chart, money, pie-chart, planning, design, growth, pencil, company, competition, progress, investment, analyze, office, banking, financial, cash, exchange. The prominent colors used in the PowerPoint template are Yellow, Gray, Black. Fetch up with our Illustration Of 9 Stages Market Analysis Diagram Business Plan PowerPoint Templates. You will be applauded wherever you go.
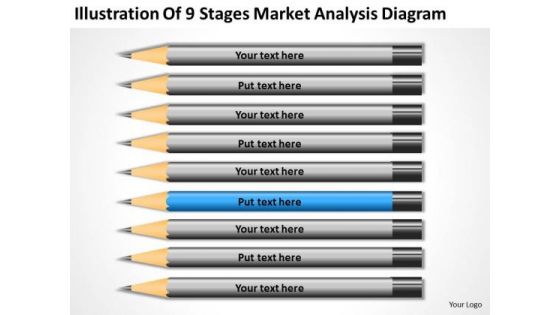
Illustration Of 9 Stages Market Analysis Diagram Ppt Business Plan Tools PowerPoint Templates
We present our illustration of 9 stages market analysis diagram ppt business plan tools PowerPoint templates.Use our Communication PowerPoint Templates because Our PowerPoint Templates and Slides are specially created by a professional team with vast experience. They diligently strive to come up with the right vehicle for your brilliant Ideas. Use our Marketing PowerPoint Templates because Our PowerPoint Templates and Slides will let you Hit the target. Go the full distance with ease and elan. Use our Business PowerPoint Templates because Our PowerPoint Templates and Slides will let you Leave a lasting impression to your audiences. They possess an inherent longstanding recall factor. Present our Shapes PowerPoint Templates because our PowerPoint Templates and Slides are the string of your bow. Fire of your ideas and conquer the podium. Present our Process and Flows PowerPoint Templates because You aspire to touch the sky with glory. Let our PowerPoint Templates and Slides provide the fuel for your ascent.Use these PowerPoint slides for presentations relating to Market, sales, statistics, economy, target, achievement, corporate, business, success, presentation, diagram, finance, data, stock, analysis, flowchart, drawing, report, calculation, graph, illustration, economic, chart, money, pie-chart, planning, design, growth, pencil, company, competition, progress, investment, analyze, office, banking, financial, cash, exchange. The prominent colors used in the PowerPoint template are Blue, Gray, Black. Your ideas deserve the best accessories. Our Illustration Of 9 Stages Market Analysis Diagram Ppt Business Plan Tools PowerPoint Templates are a shining example.
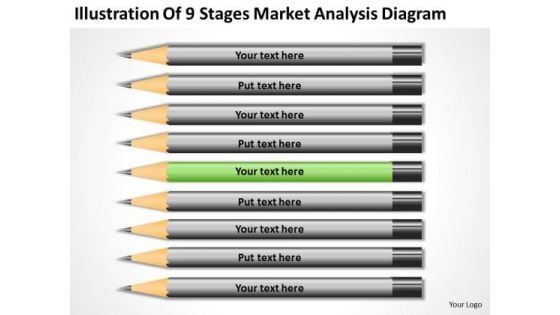
Illustration Of 9 Stages Market Analysis Diagram Ppt Business Plan Formats PowerPoint Templates
We present our illustration of 9 stages market analysis diagram ppt business plan formats PowerPoint templates.Download and present our Communication PowerPoint Templates because Our PowerPoint Templates and Slides are aesthetically designed to attract attention. We gaurantee that they will grab all the eyeballs you need. Download and present our Marketing PowerPoint Templates because It will mark the footprints of your journey. Illustrate how they will lead you to your desired destination. Download and present our Business PowerPoint Templates because Our PowerPoint Templates and Slides will fulfill your every need. Use them and effectively satisfy the desires of your audience. Present our Shapes PowerPoint Templates because Our PowerPoint Templates and Slides will let you Illuminate the road ahead to Pinpoint the important landmarks along the way. Download our Process and Flows PowerPoint Templates because It will mark the footprints of your journey. Illustrate how they will lead you to your desired destination.Use these PowerPoint slides for presentations relating to Market, sales, statistics, economy, target, achievement, corporate, business, success, presentation, diagram, finance, data, stock, analysis, flowchart, drawing, report, calculation, graph, illustration, economic, chart, money, pie-chart, planning, design, growth, pencil, company, competition, progress, investment, analyze, office, banking, financial, cash, exchange. The prominent colors used in the PowerPoint template are Green, Gray, Black. Our Illustration Of 9 Stages Market Analysis Diagram Ppt Business Plan Formats PowerPoint Templates will corroborate your thoughts. Add to the authenticity of your ideas.
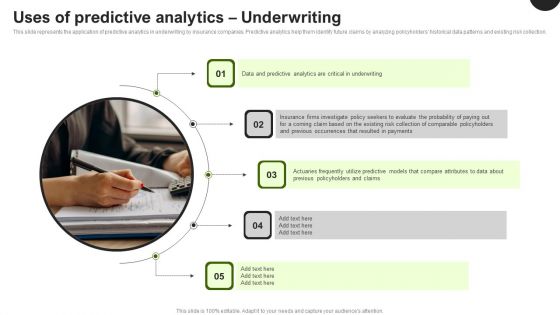
Predictive Analytics In The Age Of Big Data Uses Of Predictive Analytics Underwriting Sample PDF
This slide represents the application of predictive analytics in underwriting by insurance companies. Predictive analytics help them identify future claims by analyzing policyholders historical data patterns and existing risk collection. Do you have an important presentation coming up Are you looking for something that will make your presentation stand out from the rest Look no further than Predictive Analytics In The Age Of Big Data Uses Of Predictive Analytics Underwriting Sample PDF. With our professional designs, you can trust that your presentation will pop and make delivering it a smooth process. And with Slidegeeks, you can trust that your presentation will be unique and memorable. So why wait Grab Predictive Analytics In The Age Of Big Data Uses Of Predictive Analytics Underwriting Sample PDF today and make your presentation stand out from the rest.

Data Interpretation And Analysis Playbook Business Intelligence And Predictive Analytics Challenges Template PDF
This template covers the problems while implementing BI and predictive analytics in the organization. The challenges are undefined KPIs and metrics, and unable to hire right data science talent. Presenting data interpretation and analysis playbook business intelligence and predictive analytics challenges template pdf to provide visual cues and insights. Share and navigate important information on two stages that need your due attention. This template can be used to pitch topics like security vulnerabilities, operationalizing, perform analysis, deployed. In addtion, this PPT design contains high resolution images, graphics, etc, that are easily editable and available for immediate download.
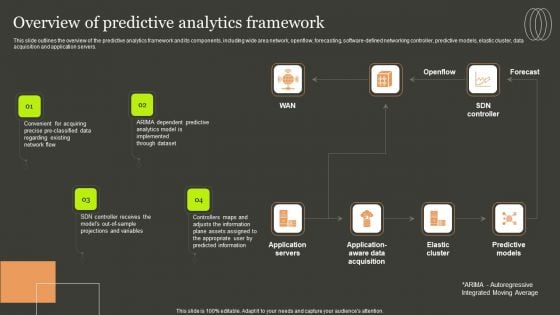
Predictive Analytics Methods Overview Of Predictive Analytics Framework Introduction PDF
This slide outlines the overview of the predictive analytics framework and its components, including wide area network, openflow, forecasting, software-defined networking controller, predictive models, elastic cluster, data acquisition and application servers. Slidegeeks is here to make your presentations a breeze with Predictive Analytics Methods Overview Of Predictive Analytics Framework Introduction PDF With our easy to use and customizable templates, you can focus on delivering your ideas rather than worrying about formatting. With a variety of designs to choose from, you are sure to find one that suits your needs. And with animations and unique photos, illustrations, and fonts, you can make your presentation pop. So whether you are giving a sales pitch or presenting to the board, make sure to check out Slidegeeks first.
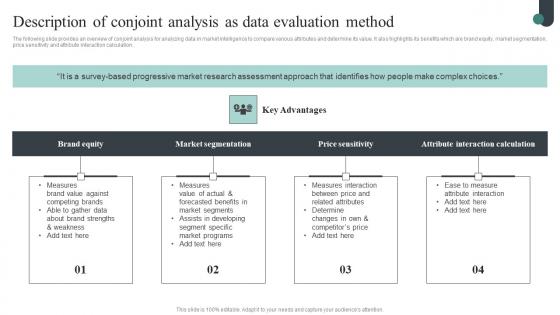
Competitive Intelligence Guide To Determine Market Description Of Conjoint Analysis As Data Designs Pdf
The following slide provides an overview of conjoint analysis for analyzing data in market intelligence to compare various attributes and determine its value. It also highlights its benefits which are brand equity, market segmentation, price sensitivity and attribute interaction calculation. Present like a pro with Competitive Intelligence Guide To Determine Market Description Of Conjoint Analysis As Data Designs Pdf Create beautiful presentations together with your team, using our easy-to-use presentation slides. Share your ideas in real-time and make changes on the fly by downloading our templates. So whether you are in the office, on the go, or in a remote location, you can stay in sync with your team and present your ideas with confidence. With Slidegeeks presentation got a whole lot easier. Grab these presentations today. The following slide provides an overview of conjoint analysis for analyzing data in market intelligence to compare various attributes and determine its value. It also highlights its benefits which are brand equity, market segmentation, price sensitivity and attribute interaction calculation.
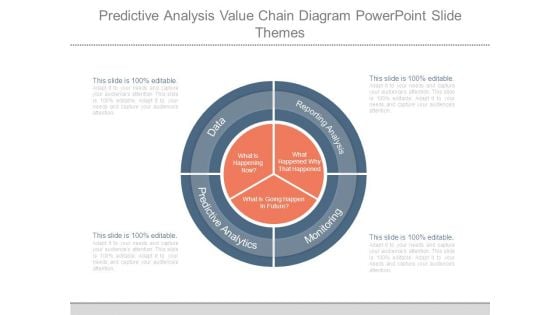
Predictive Analysis Value Chain Diagram Powerpoint Slide Themes
This is a predictive analysis value chain diagram powerpoint slide themes. This is a four stage process. The stages in this process are what is happening now, what is going happen in future, what happened why that happened, data, predictive analytics, reporting analysis, monitoring.
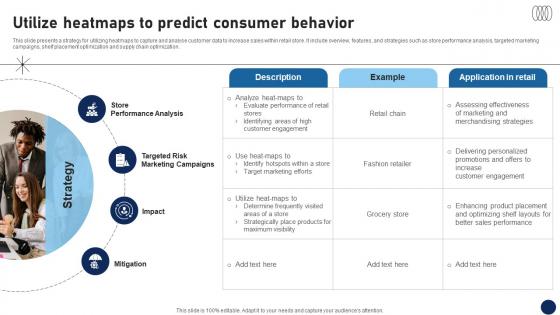
Utilize Heatmaps To Predict Consumer Behavior DT SS V
This slide presents a strategy for utilizing heatmaps to capture and analyse customer data to increase sales within retail store. It include overview, features, and strategies such as store performance analysis, targeted marketing campaigns, shelf placement optimization and supply chain optimization. Present like a pro with Utilize Heatmaps To Predict Consumer Behavior DT SS V. Create beautiful presentations together with your team, using our easy-to-use presentation slides. Share your ideas in real-time and make changes on the fly by downloading our templates. So whether you are in the office, on the go, or in a remote location, you can stay in sync with your team and present your ideas with confidence. With Slidegeeks presentation got a whole lot easier. Grab these presentations today. This slide presents a strategy for utilizing heatmaps to capture and analyse customer data to increase sales within retail store. It include overview, features, and strategies such as store performance analysis, targeted marketing campaigns, shelf placement optimization and supply chain optimization.
Expenditure Assessment Icon For Budget Planning Topics PDF
Presenting Expenditure Assessment Icon For Budget Planning Topics PDF to dispense important information. This template comprises Four stages. It also presents valuable insights into the topics including Expenditure Assessment, Icon For Budget Planning. This is a completely customizable PowerPoint theme that can be put to use immediately. So, download it and address the topic impactfully.
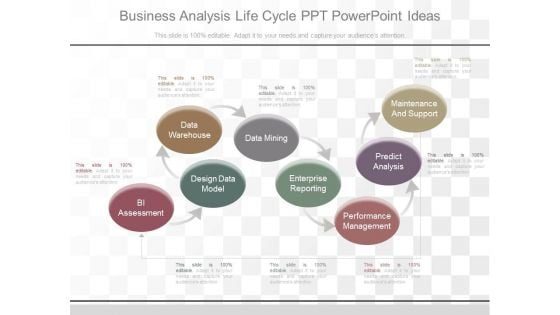
Business Analysis Life Cycle Ppt Powerpoint Ideas
This is a business analysis life cycle ppt powerpoint ideas. This is a eight stage process. The stages in this process are bi assessment, design data model, data warehouse, data mining, enterprise reporting, performance management, predict analysis, maintenance and support.
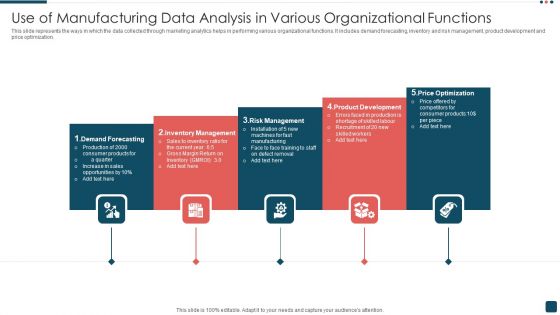
Use Of Manufacturing Data Analysis In Various Organizational Functions Introduction PDF
This slide represents the ways in which the data collected through marketing analytics helps in performing various organizational functions. It includes demand forecasting, inventory and risk management, product development and price optimization. Persuade your audience using this Use Of Manufacturing Data Analysis In Various Organizational Functions Introduction PDF. This PPT design covers five stages, thus making it a great tool to use. It also caters to a variety of topics including Inventory Management, Risk Management, Product Development. Download this PPT design now to present a convincing pitch that not only emphasizes the topic but also showcases your presentation skills.
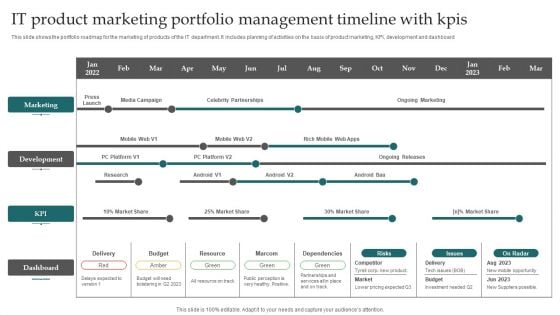
IT Product Marketing Portfolio Management Timeline With Kpis Elements PDF
This slide shows the portfolio roadmap for the marketing of products of the IT department. It includes planning of activities on the basis of product marketing, KPI, development and dashboard. Showcasing this set of slides titled IT Product Marketing Portfolio Management Timeline With Kpis Elements PDF. The topics addressed in these templates are Marketing, Development, Budget. All the content presented in this PPT design is completely editable. Download it and make adjustments in color, background, font etc. as per your unique business setting.

Six Stage Process To Calculate Inflation Rate Comprehensive Guide On Inflation Control CM SS V
This slide shows step by step process which can be used to calculate inflation rate by using ECI. It includes stages such as select year, collect data, calculate ECI for wages and benefits and interpret results. Do you have to make sure that everyone on your team knows about any specific topic I yes, then you should give Six Stage Process To Calculate Inflation Rate Comprehensive Guide On Inflation Control CM SS V a try. Our experts have put a lot of knowledge and effort into creating this impeccable Six Stage Process To Calculate Inflation Rate Comprehensive Guide On Inflation Control CM SS V. You can use this template for your upcoming presentations, as the slides are perfect to represent even the tiniest detail. You can download these templates from the Slidegeeks website and these are easy to edit. So grab these today This slide shows step by step process which can be used to calculate inflation rate by using ECI. It includes stages such as select year, collect data, calculate ECI for wages and benefits and interpret results.

Global Product Analytics Market Snapshot Product Analytics Implementation Data Analytics V
This slide showcase a graphical representation global product analytics market. It includes present and forecasted values of advanced analytics usage globally with key takeaways on market situationComing up with a presentation necessitates that the majority of the effort goes into the content and the message you intend to convey. The visuals of a PowerPoint presentation can only be effective if it supplements and supports the story that is being told. Keeping this in mind our experts created Global Product Analytics Market Snapshot Product Analytics Implementation Data Analytics V to reduce the time that goes into designing the presentation. This way, you can concentrate on the message while our designers take care of providing you with the right template for the situation. This slide showcase a graphical representation global product analytics market. It includes present and forecasted values of advanced analytics usage globally with key takeaways on market situation
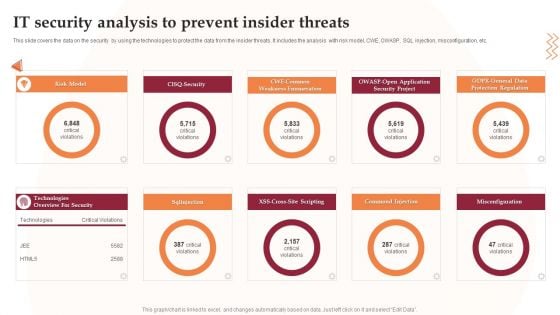
IT Security Analysis To Prevent Insider Threats Infographics PDF
This slide covers the data on the security by using the technologies to protect the data from the insider threats. It includes the analysis with risk model, CWE, OWASP, SQL injection, misconfiguration, etc. Presenting IT Security Analysis To Prevent Insider Threats Infographics PDF to dispense important information. This template comprises nine stages. It also presents valuable insights into the topics including Security Project, Application, Risk Model. This is a completely customizable PowerPoint theme that can be put to use immediately. So, download it and address the topic impactfully.
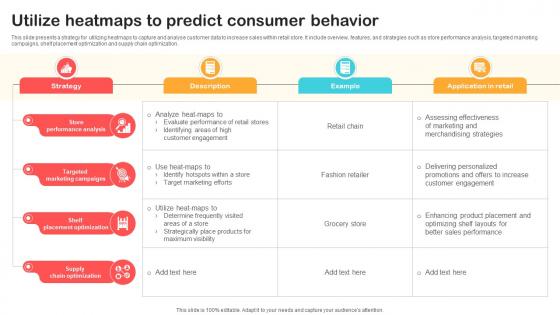
Utilize Heatmaps To Predict Consumer Behavior Optimizing Retail Operations With Digital DT SS V
This slide presents a strategy for utilizing heatmaps to capture and analyse customer data to increase sales within retail store. It include overview, features, and strategies such as store performance analysis, targeted marketing campaigns, shelf placement optimization and supply chain optimization. Present like a pro with Utilize Heatmaps To Predict Consumer Behavior Optimizing Retail Operations With Digital DT SS V. Create beautiful presentations together with your team, using our easy-to-use presentation slides. Share your ideas in real-time and make changes on the fly by downloading our templates. So whether you are in the office, on the go, or in a remote location, you can stay in sync with your team and present your ideas with confidence. With Slidegeeks presentation got a whole lot easier. Grab these presentations today. This slide presents a strategy for utilizing heatmaps to capture and analyse customer data to increase sales within retail store. It include overview, features, and strategies such as store performance analysis, targeted marketing campaigns, shelf placement optimization and supply chain optimization.
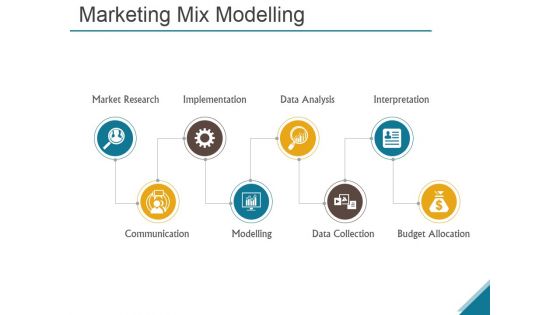
Marketing Mix Modelling Ppt PowerPoint Presentation Good
This is a marketing mix modelling ppt powerpoint presentation good. This is a eight stage process. The stages in this process are market research, implementation, data analysis, interpretation, communication, modelling, data collection, budget allocation.
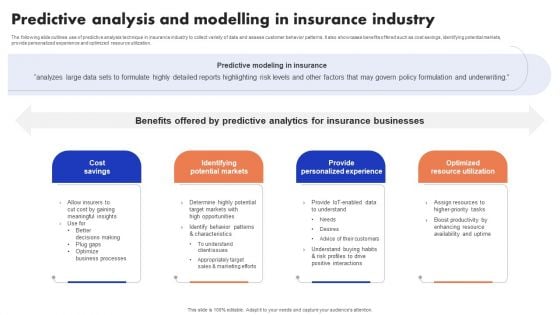
Implementation Of Digital Advancement Techniques Predictive Analysis And Modelling Slides PDF
The following slide outlines use of predictive analysis technique in insurance industry to collect variety of data and assess customer behavior patterns. It also showcases benefits offered such as cost savings, identifying potential markets, provide personalized experience and optimized resource utilization. The Implementation Of Digital Advancement Techniques Predictive Analysis And Modelling Slides PDF is a compilation of the most recent design trends as a series of slides. It is suitable for any subject or industry presentation, containing attractive visuals and photo spots for businesses to clearly express their messages. This template contains a variety of slides for the user to input data, such as structures to contrast two elements, bullet points, and slides for written information. Slidegeeks is prepared to create an impression.
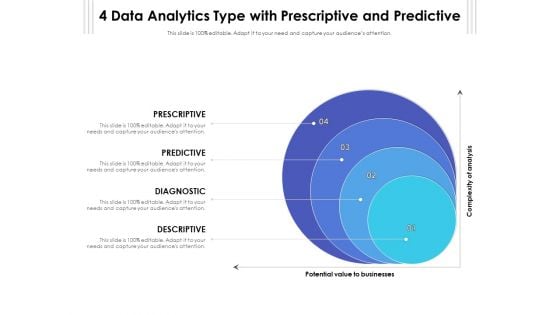
4 Data Analytics Type With Prescriptive And Predictive Ppt PowerPoint Presentation File Infographic Template PDF
Presenting 4 data analytics type with prescriptive and predictive ppt powerpoint presentation file infographic template pdf to dispense important information. This template comprises four stages. It also presents valuable insights into the topics including prescriptive, predictive, diagnostic. This is a completely customizable PowerPoint theme that can be put to use immediately. So, download it and address the topic impactfully.

Establishing An Efficient Integrated Marketing Communication Process Customer Engagement Maturity Assessment Sample PDF
This slide covers the customer engagement maturity assessment dashboard. It includes information about customer engagement success drivers and overall engagement maturity. Deliver and pitch your topic in the best possible manner with this establishing an efficient integrated marketing communication process customer engagement maturity assessment sample pdf. Use them to share invaluable insights on management leadership, organizational alignment, customer service success, technology, budget staffing and impress your audience. This template can be altered and modified as per your expectations. So, grab it now.

Transformation Toolkit Competitive Intelligence Information Analysis Value Stream Information Data Analytics Structure Infographics PDF
The slides shows the stages of data analytics with reactive and proactive approach. In includes four steps collection, analysis, predictive and actions. Present like a pro with Transformation Toolkit Competitive Intelligence Information Analysis Value Stream Information Data Analytics Structure Infographics PDF Create beautiful presentations together with your team, using our easy to use presentation slides. Share your ideas in real time and make changes on the fly by downloading our templates. So whether you are in the office, on the go, or in a remote location, you can stay in sync with your team and present your ideas with confidence. With Slidegeeks presentation got a whole lot easier. Grab these presentations today.
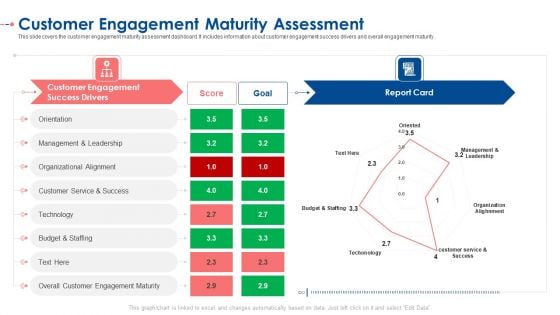
Customer Engagement Maturity Assessment Ppt Summary PDF
This slide covers the customer engagement maturity assessment dashboard. It includes information about customer engagement success drivers and overall engagement maturity. Deliver and pitch your topic in the best possible manner with this customer engagement maturity assessment ppt summary pdf. Use them to share invaluable insights on orientation, organizational alignment, technology, budget and staffing, customer service and impress your audience. This template can be altered and modified as per your expectations. So, grab it now.
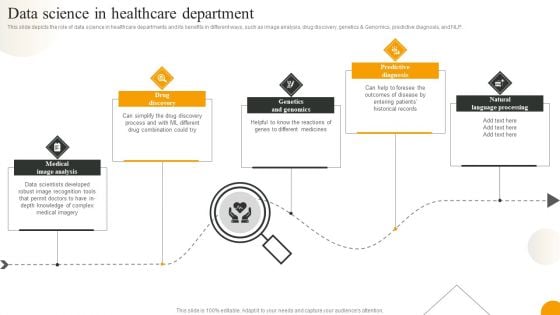
Using Data Science Technologies For Business Transformation Data Science In Healthcare Department Ideas PDF
This slide depicts the role of data science in healthcare departments and its benefits in different ways, such as image analysis, drug discovery, genetics and Genomics, predictive diagnosis, and NLP. Present like a pro with Using Data Science Technologies For Business Transformation Data Science In Healthcare Department Ideas PDF Create beautiful presentations together with your team, using our easy to use presentation slides. Share your ideas in real time and make changes on the fly by downloading our templates. So whether you are in the office, on the go, or in a remote location, you can stay in sync with your team and present your ideas with confidence. With Slidegeeks presentation got a whole lot easier. Grab these presentations today.
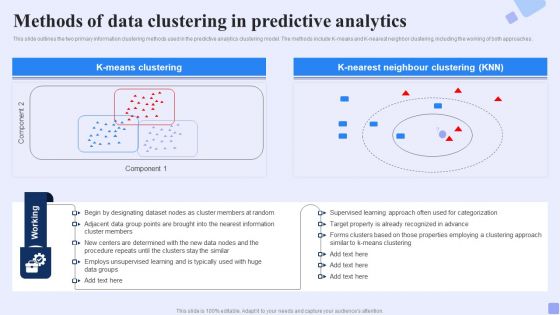
Methods Of Data Clustering In Predictive Analytics Forward Looking Analysis IT Professional PDF
This slide outlines the two primary information clustering methods used in the predictive analytics clustering model. The methods include K-means and K-nearest neighbor clustering, including the working of both approaches.Slidegeeks is here to make your presentations a breeze with Methods Of Data Clustering In Predictive Analytics Forward Looking Analysis IT Professional PDF With our easy-to-use and customizable templates, you can focus on delivering your ideas rather than worrying about formatting. With a variety of designs to choose from, you are sure to find one that suits your needs. And with animations and unique photos, illustrations, and fonts, you can make your presentation pop. So whether you are giving a sales pitch or presenting to the board, make sure to check out Slidegeeks first.
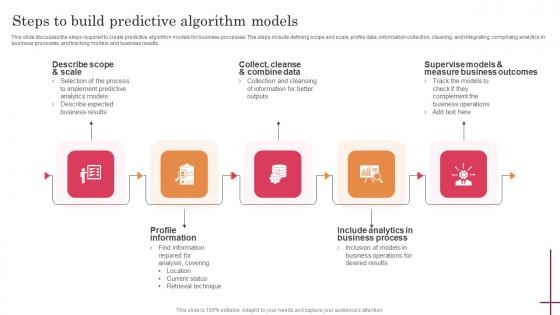
Steps To Build Predictive Algorithm Models Predictive Analytics For Improved Ideas Pdf
This slide discusses the steps required to create predictive algorithm models for business processes. The steps include defining scope and scale, profile data, information collection, cleaning, and integrating, comprising analytics in business processes, and tracking models and business results. Want to ace your presentation in front of a live audience Our Steps To Build Predictive Algorithm Models Predictive Analytics For Improved Ideas Pdf can help you do that by engaging all the users towards you. Slidegeeks experts have put their efforts and expertise into creating these impeccable powerpoint presentations so that you can communicate your ideas clearly. Moreover, all the templates are customizable, and easy-to-edit and downloadable. Use these for both personal and commercial use. This slide discusses the steps required to create predictive algorithm models for business processes. The steps include defining scope and scale, profile data, information collection, cleaning, and integrating, comprising analytics in business processes, and tracking models and business results.
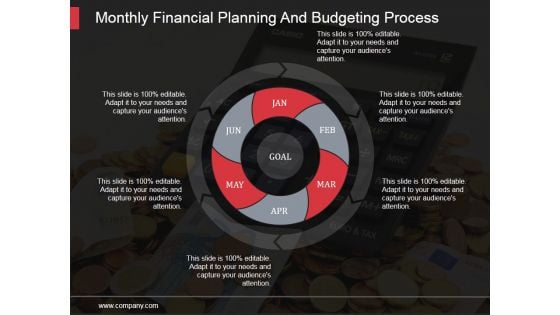
Monthly Financial Planning And Budgeting Process Ppt PowerPoint Presentation Visuals
This is a monthly financial planning and budgeting process ppt powerpoint presentation visuals. This is a six stage process. The stages in this process are growth, finance, development, financial development, economic growth, data analysis.


 Continue with Email

 Home
Home


