Project Snapshot
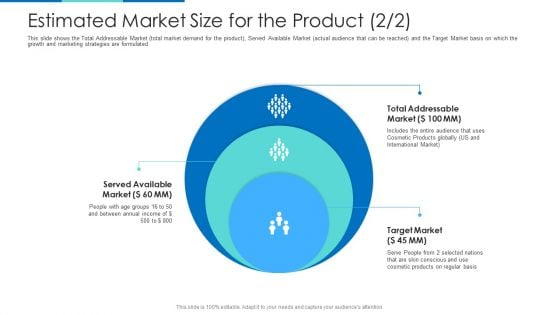
Estimated Market Size For The Product Ppt Pictures Graphics PDF
This slide shows the Total Addressable Market total market demand for the product, Served Available Market actual audience that can be reached and the Target Market basis on which the growth and marketing strategies are formulated. This is a estimated market size for the product ppt pictures graphics pdf. template with various stages. Focus and dispense information on three stages using this creative set, that comes with editable features. It contains large content boxes to add your information on topics like served available market, target market, total addressable market. You can also showcase facts, figures, and other relevant content using this PPT layout. Grab it now.
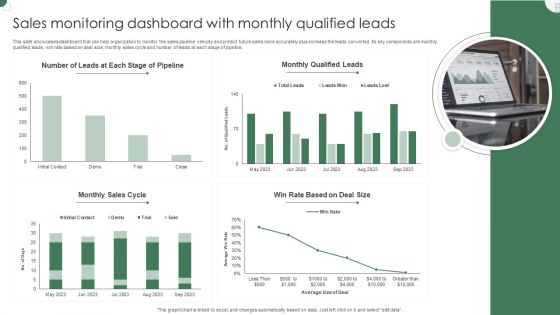
Sales Monitoring Dashboard With Monthly Qualified Leads Guidelines PDF
This slide showcases dashboard that can help organization to monitor the sales pipeline velocity and predict future sales more accurately plus increase the leads converted. Its key components are monthly qualified leads, win rate based on deal size, monthly sales cycle and number of leads at each stage of pipeline. Pitch your topic with ease and precision using this Sales Monitoring Dashboard With Monthly Qualified Leads Guidelines PDF. This layout presents information on Monthly Qualified, Monthly Sales Cycle, Deal Size. It is also available for immediate download and adjustment. So, changes can be made in the color, design, graphics or any other component to create a unique layout.
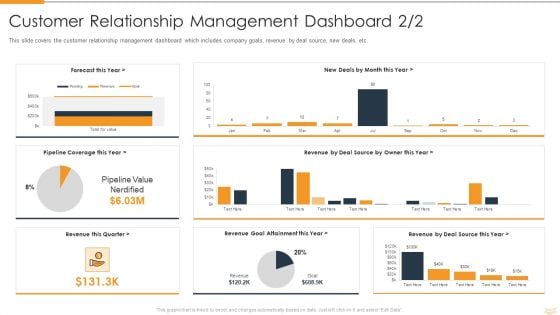
Strategic Partnership Management Plan Customer Relationship Management Dashboard Value Demonstration PDF
This slide covers the customer relationship management dashboard which includes company goals, revenue by deal source, new deals, etc. Deliver and pitch your topic in the best possible manner with this strategic partnership management plan customer relationship management dashboard value demonstration pdf. Use them to share invaluable insights on revenue this quarter, revenue goal attainment this year, revenue by deal source this year, revenue by deal source by owner this year, pipeline coverage this year, forecast this year, new deals by month this year and impress your audience. This template can be altered and modified as per your expectations. So, grab it now.
SFA Dashboard To Track Performance Ppt PowerPoint Presentation Icon Example File PDF
This Slide visually represents sales force automation dashboard to track performance which can be utilized by marketing managers to streamline the process of automated selling. It includes information about sales pipeline, competitors, opportunities, key competitors, etc. Pitch your topic with ease and precision using this sfa dashboard to track performance ppt powerpoint presentation icon example file pdf. This layout presents information on sales pipeline, sales pipeline by sales rep, key competitors, forecast by month, key opportunities. It is also available for immediate download and adjustment. So, changes can be made in the color, design, graphics or any other component to create a unique layout.
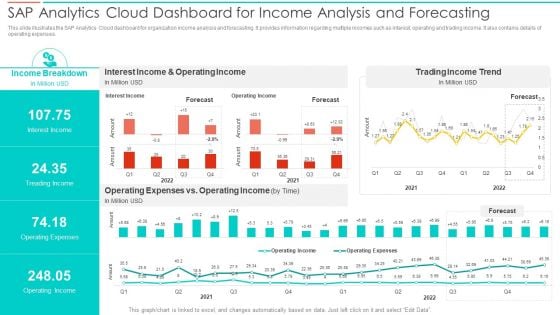
SAC Planning And Implementation SAP Analytics Cloud Dashboard For Income Analysis Summary PDF
This slide illustrates the SAP Analytics Cloud dashboard for organization income analysis and forecasting. It provides information regarding multiple incomes such as interest, operating and trading income. It also contains details of operating expenses. Deliver an awe inspiring pitch with this creative SAC Planning And Implementation SAP Analytics Cloud Dashboard For Income Analysis Summary PDF bundle. Topics like Income Breakdown, Interest Income, Operating Income, Trading Income Trend can be discussed with this completely editable template. It is available for immediate download depending on the needs and requirements of the user.
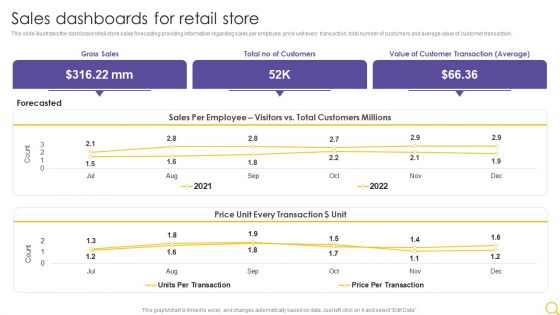
Retail Outlet Operational Efficiency Analytics Sales Dashboards For Retail Store Inspiration PDF
This slide illustrates the dashboard retail store sales forecasting providing information regarding sales per employee, price unit every transaction, total number of customers and average value of customer transaction. Deliver and pitch your topic in the best possible manner with this Retail Outlet Operational Efficiency Analytics Sales Dashboards For Retail Store Inspiration PDF. Use them to share invaluable insights on Gross Sales, Total No Customers, Value Customer and impress your audience. This template can be altered and modified as per your expectations. So, grab it now.
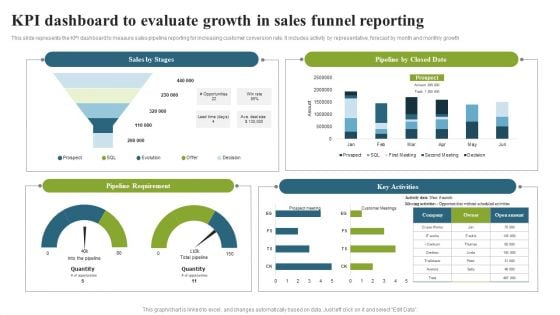
KPI Dashboard To Evaluate Growth In Sales Funnel Reporting Topics PDF
This slide represents the KPI dashboard to measure sales pipeline reporting for increasing customer conversion rate. It includes activity by representative, forecast by month and monthly growth. Pitch your topic with ease and precision using this KPI Dashboard To Evaluate Growth In Sales Funnel Reporting Topics PDF. This layout presents information on Pipeline Requirement, Key Activities, Pipeline Closed Date. It is also available for immediate download and adjustment. So, changes can be made in the color, design, graphics or any other component to create a unique layout.
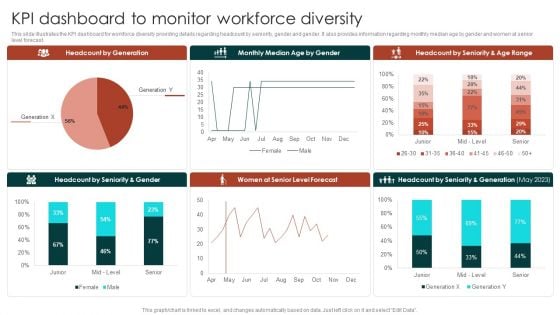
Diversity Management Plan To Improve Workplace Culture KPI Dashboard To Monitor Workforce Microsoft PDF
This slide illustrates the KPI dashboard for workforce diversity providing details regarding headcount by seniority, gender and gender. It also provides information regarding monthly median age by gender and women at senior level forecast.Find a pre-designed and impeccable Diversity Management Plan To Improve Workplace Culture KPI Dashboard To Monitor Workforce Microsoft PDF. The templates can ace your presentation without additional effort. You can download these easy-to-edit presentation templates to make your presentation stand out from others. So, what are you waiting for. Download the template from Slidegeeks today and give a unique touch to your presentation.
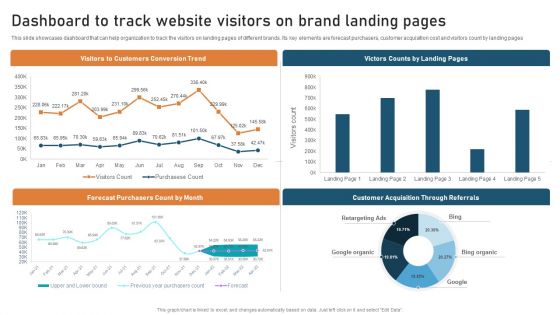
Targeted Market Entry Strategy Dashboard To Track Website Visitors On Brand Landing Guidelines PDF
This slide showcases dashboard that can help organization to track the visitors on landing pages of different brands. Its key elements are forecast purchasers, customer acquisition cost and visitors count by landing pages. From laying roadmaps to briefing everything in detail, our templates are perfect for you. You can set the stage with your presentation slides. All you have to do is download these easy-to-edit and customizable templates. Targeted Market Entry Strategy Dashboard To Track Website Visitors On Brand Landing Guidelines PDF will help you deliver an outstanding performance that everyone would remember and praise you for. Do download this presentation today.
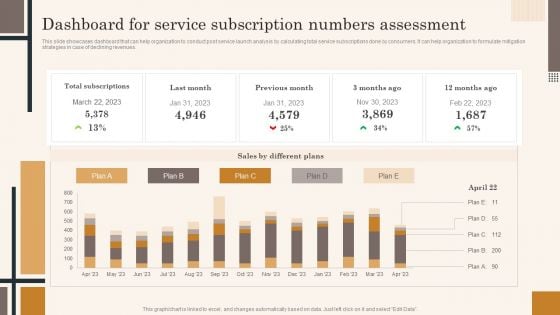
Dashboard For Service Subscription Numbers Assessment Professional PDF
This slide showcases dashboard that can help organization to conduct post service launch analysis by calculating total service subscriptions done by consumers. It can help organization to formulate mitigation strategies in case of declining revenues. Presenting this PowerPoint presentation, titled Dashboard For Service Subscription Numbers Assessment Professional PDF, with topics curated by our researchers after extensive research. This editable presentation is available for immediate download and provides attractive features when used. Download now and captivate your audience. Presenting this Dashboard For Service Subscription Numbers Assessment Professional PDF. Our researchers have carefully researched and created these slides with all aspects taken into consideration. This is a completely customizable Dashboard For Service Subscription Numbers Assessment Professional PDF that is available for immediate downloading. Download now and make an impact on your audience. Highlight the attractive features available with our PPTs.
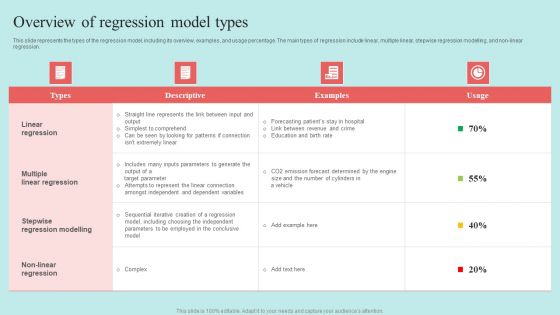
Predictive Data Model Overview Of Regression Model Types Elements PDF
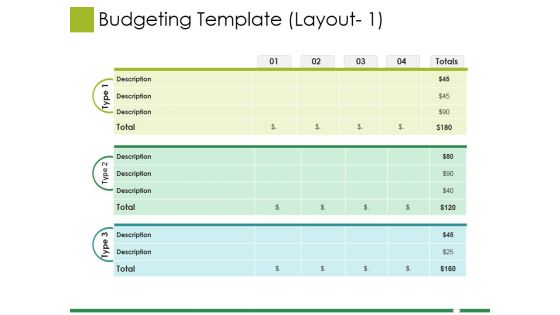
Budgeting Template Ppt PowerPoint Presentation Show Template
This is a budgeting template ppt powerpoint presentation show template. This is a three stage process. The stages in this process are business, marketing, finance, planning, tables.
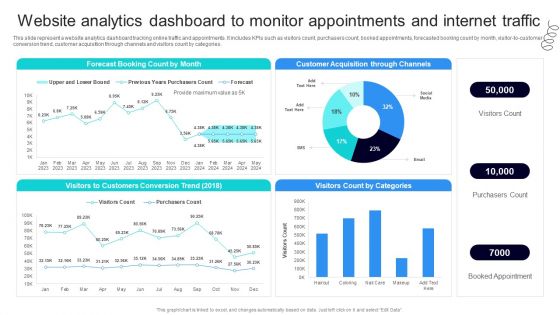
Strategic Marketing For Hair And Beauty Salon To Increase Website Analytics Dashboard Ideas PDF
This slide represent a website analytics dashboard tracking online traffic and appointments. It includes KPIs such as visitors count, purchasers count, booked appointments, forecasted booking count by month, visitor-to-customer conversion trend, customer acquisition through channels and visitors count by categories. Slidegeeks has constructed Strategic Marketing For Hair And Beauty Salon To Increase Website Analytics Dashboard Ideas PDF after conducting extensive research and examination. These presentation templates are constantly being generated and modified based on user preferences and critiques from editors. Here, you will find the most attractive templates for a range of purposes while taking into account ratings and remarks from users regarding the content. This is an excellent jumping off point to explore our content and will give new users an insight into our top notch PowerPoint Templates.
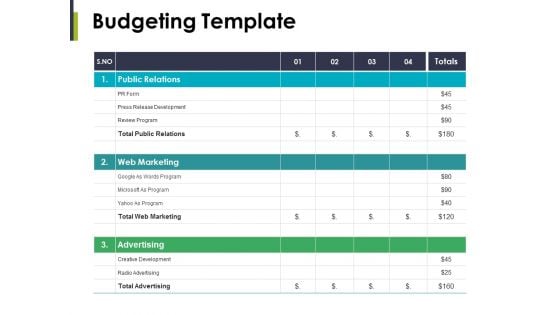
Budgeting Template Ppt PowerPoint Presentation Gallery Inspiration
This is a budgeting template ppt powerpoint presentation gallery inspiration. This is a three stage process. The stages in this process are public relations, web marketing, advertising, press release development, microsoft as program.
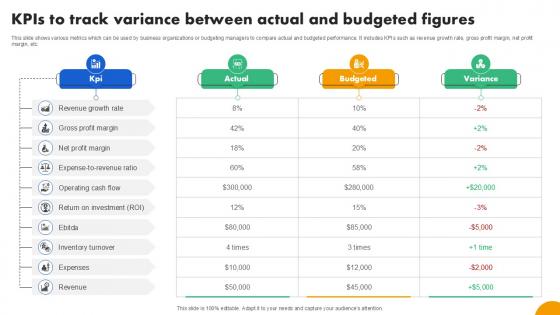
KPIs To Track Variance Between Strategies To Develop Effective Ppt PowerPoint Fin SS V
This slide shows various metrics which can be used by business organizations or budgeting managers to compare actual and budgeted performance. It includes KPIs such as revenue growth rate, gross profit margin, net profit margin, etc. Coming up with a presentation necessitates that the majority of the effort goes into the content and the message you intend to convey. The visuals of a PowerPoint presentation can only be effective if it supplements and supports the story that is being told. Keeping this in mind our experts created KPIs To Track Variance Between Strategies To Develop Effective Ppt PowerPoint Fin SS V to reduce the time that goes into designing the presentation. This way, you can concentrate on the message while our designers take care of providing you with the right template for the situation. This slide shows various metrics which can be used by business organizations or budgeting managers to compare actual and budgeted performance. It includes KPIs such as revenue growth rate, gross profit margin, net profit margin, etc.

Introduction To Monte Carlo Simulation Description And Objectives Data Analytics SS V
This slide provides an introduction to monte carlo simulation aimed ta helping businesses improve decision making by forecasting outcomes. It covers description, objectives and industries utilizing monte carlo simulation.Get a simple yet stunning designed Introduction To Monte Carlo Simulation Description And Objectives Data Analytics SS V. It is the best one to establish the tone in your meetings. It is an excellent way to make your presentations highly effective. So, download this PPT today from Slidegeeks and see the positive impacts. Our easy-to-edit Introduction To Monte Carlo Simulation Description And Objectives Data Analytics SS V can be your go-to option for all upcoming conferences and meetings. So, what are you waiting for Grab this template today. This slide provides an introduction to monte carlo simulation aimed ta helping businesses improve decision making by forecasting outcomes. It covers description, objectives and industries utilizing monte carlo simulation.
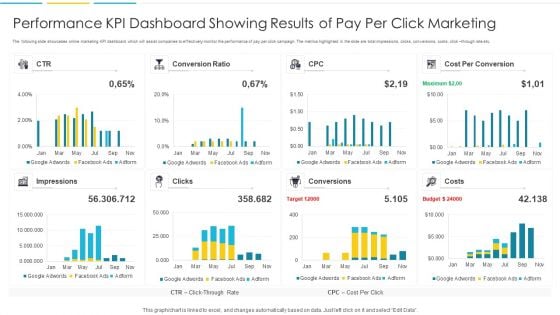
Performance KPI Dashboard Showing Results Of Pay Per Click Marketing Portrait PDF
The following slide showcases online marketing KPI dashboard which will assist companies to effectively monitor the performance of pay per click campaign. The metrics highlighted in the slide are total impressions, clicks, conversions, costs, click through rate etc. Pitch your topic with ease and precision using this Performance KPI Dashboard Showing Results Of Pay Per Click Marketing Portrait PDF. This layout presents information on Impressions, Target, Budget. It is also available for immediate download and adjustment. So, changes can be made in the color, design, graphics or any other component to create a unique layout.
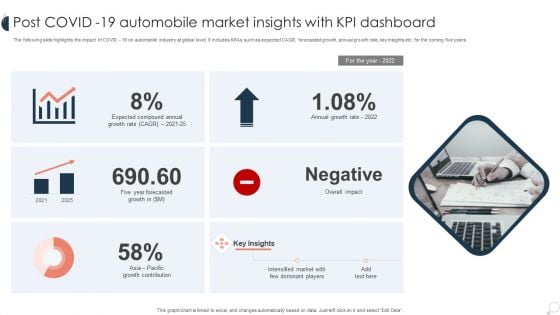
Post COVID 19 Automobile Market Insights With KPI Dashboard Ppt PowerPoint Presentation Slides Background Images PDF
The following slide highlights the impact of COVID 19 on automobile industry at global level. It includes KPAs such as expected CAGR, forecasted growth, annual growth rate, key insights etc. for the coming five years. Showcasing this set of slides titled Post COVID 19 Automobile Market Insights With KPI Dashboard Ppt PowerPoint Presentation Slides Background Images PDF. The topics addressed in these templates are Expected Compound, Annual Growth, Overall Impact. All the content presented in this PPT design is completely editable. Download it and make adjustments in color, background, font etc. as per your unique business setting.
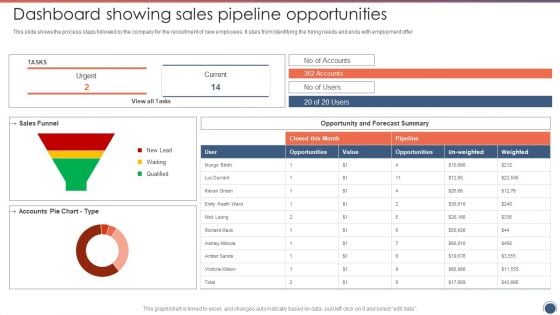
Dashboard Showing Sales Pipeline Opportunities Sales Funnel Management Strategies To Increase Sales Microsoft PDF
This slide shows the process steps followed by the company for the recruitment of new employees. It stars from Identifying the hiring needs and ends with employment offer.Deliver and pitch your topic in the best possible manner with this Dashboard Showing Sales Pipeline Opportunities Sales Funnel Management Strategies To Increase Sales Microsoft PDF. Use them to share invaluable insights on Sales Funnel, Forecast Summary, Opportunities and impress your audience. This template can be altered and modified as per your expectations. So, grab it now.

Overview Optimizing Business Intelligence With Erp Erp And Digital Transformation For Maximizing DT SS V
This slide presents an overview of how transforming ERP helps in optimizing business intelligence. It includes features advanced analytics, customizable dashboards, data integration, predictive analytics, ad hoc reporting, etc.Welcome to our selection of the Overview Optimizing Business Intelligence With Erp Erp And Digital Transformation For Maximizing DT SS V. These are designed to help you showcase your creativity and bring your sphere to life. Planning and Innovation are essential for any business that is just starting out. This collection contains the designs that you need for your everyday presentations. All of our PowerPoints are 100 percent editable, so you can customize them to suit your needs. This multi-purpose template can be used in various situations. Grab these presentation templates today. This slide presents an overview of how transforming ERP helps in optimizing business intelligence. It includes features advanced analytics, customizable dashboards, data integration, predictive analytics, ad hoc reporting, etc.
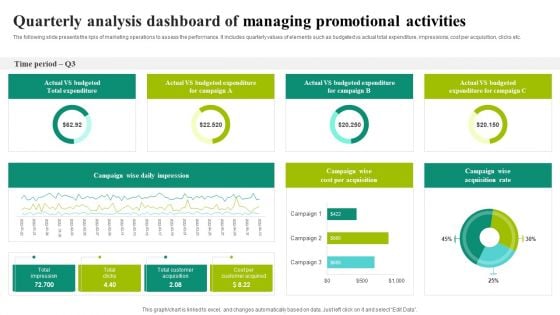
Quarterly Analysis Dashboard Of Managing Promotional Activities Ideas PDF
The following slide presents the kpis of marketing operations to assess the performance. It includes quarterly values of elements such as budgeted vs actual total expenditure, impressions, cost per acquisition, clicks etc. Showcasing this set of slides titled Quarterly Analysis Dashboard Of Managing Promotional Activities Ideas PDF. The topics addressed in these templates are Campaign Wise, Daily Impression, Total Impression, Total Clicks. All the content presented in this PPT design is completely editable. Download it and make adjustments in color, background, font etc. as per your unique business setting.
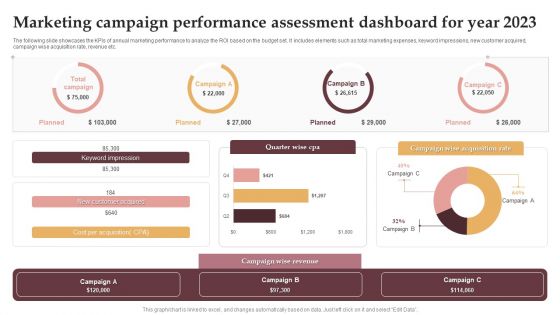
Marketing Campaign Performance Assessment Dashboard For Year 2023 Download PDF
The following slide showcases the KPIs of annual marketing performance to analyze the ROI based on the budget set. It includes elements such as total marketing expenses, keyword impressions, new customer acquired, campaign wise acquisition rate, revenue etc. Showcasing this set of slides titled Marketing Campaign Performance Assessment Dashboard For Year 2023 Download PDF. The topics addressed in these templates are Keyword Impression, New Customer Acquired, Campaign Wise Revenue. All the content presented in this PPT design is completely editable. Download it and make adjustments in color, background, font etc. as per your unique business setting.
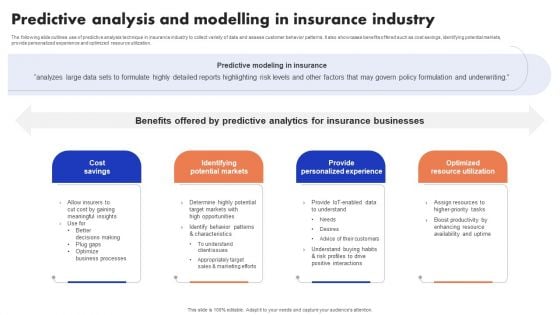
Implementation Of Digital Advancement Techniques Predictive Analysis And Modelling Slides PDF
The following slide outlines use of predictive analysis technique in insurance industry to collect variety of data and assess customer behavior patterns. It also showcases benefits offered such as cost savings, identifying potential markets, provide personalized experience and optimized resource utilization. The Implementation Of Digital Advancement Techniques Predictive Analysis And Modelling Slides PDF is a compilation of the most recent design trends as a series of slides. It is suitable for any subject or industry presentation, containing attractive visuals and photo spots for businesses to clearly express their messages. This template contains a variety of slides for the user to input data, such as structures to contrast two elements, bullet points, and slides for written information. Slidegeeks is prepared to create an impression.
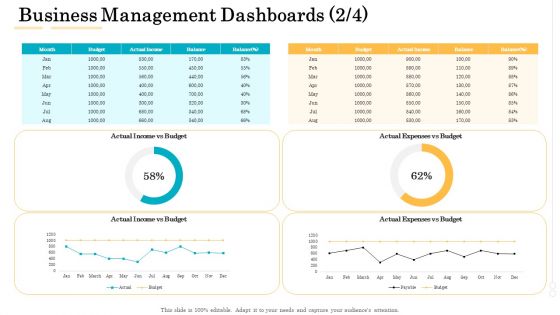
Administrative Regulation Business Management Dashboards Ppt PowerPoint Presentation Model Inspiration PDF
Deliver and pitch your topic in the best possible manner with this administrative regulation business management dashboards ppt powerpoint presentation model inspiration pdf. Use them to share invaluable insights on actual income vs budget, actual expenses vs budget, payable, budget and impress your audience. This template can be altered and modified as per your expectations. So, grab it now.

Toolkit For Data Science And Analytics Transition Data Analytics Value Stream Chain Pictures PDF
This slide illustrates the series of activities required for analyzing the data. It contains information such as data preparation, exploratory analysis, and predictive analytics etc. If you are looking for a format to display your unique thoughts, then the professionally designed Toolkit For Data Science And Analytics Transition Data Analytics Value Stream Chain Pictures PDF is the one for you. You can use it as a Google Slides template or a PowerPoint template. Incorporate impressive visuals, symbols, images, and other charts. Modify or reorganize the text boxes as you desire. Experiment with shade schemes and font pairings. Alter, share or cooperate with other people on your work. Download Toolkit For Data Science And Analytics Transition Data Analytics Value Stream Chain Pictures PDF and find out how to give a successful presentation. Present a perfect display to your team and make your presentation unforgettable.
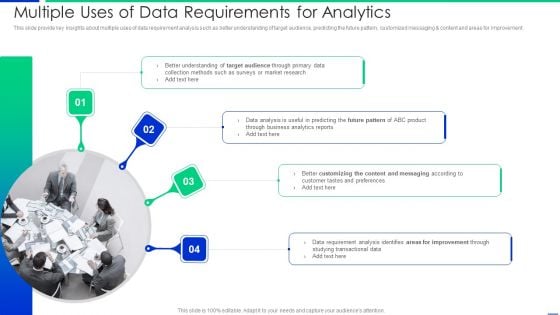
Multiple Uses Of Data Requirements For Analytics Pictures PDF
This slide provide key insights about multiple uses of data requirement analysis such as better understanding of target audience, predicting the future pattern, customized messaging and content and areas for improvement. Presenting multiple uses of data requirements for analytics pictures pdf to dispense important information. This template comprises four stages. It also presents valuable insights into the topics including analysis, customer, requirement. This is a completely customizable PowerPoint theme that can be put to use immediately. So, download it and address the topic impactfully.
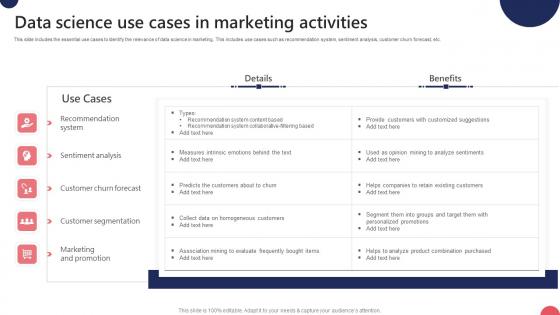
Data Science Use Cases In Marketing Activities Ppt Portfolio Graphics Tutorials Pdf
This slide includes the essential use cases to identify the relevance of data science in marketing. This includes use cases such as recommendation system, sentiment analysis, customer churn forecast, etc. Showcasing this set of slides titled Data Science Use Cases In Marketing Activities Ppt Portfolio Graphics Tutorials Pdf. The topics addressed in these templates are Recommendation System, Sentiment Analysis, Customer Churn Forecast. All the content presented in this PPT design is completely editable. Download it and make adjustments in color, background, font etc. as per your unique business setting. This slide includes the essential use cases to identify the relevance of data science in marketing. This includes use cases such as recommendation system, sentiment analysis, customer churn forecast, etc.
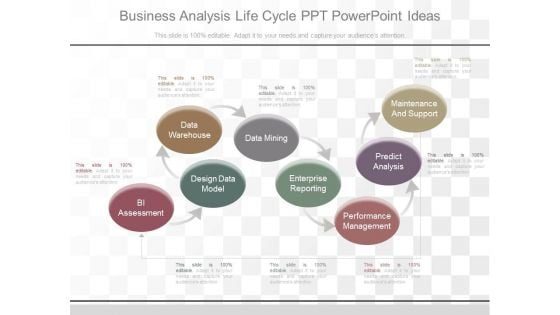
Business Analysis Life Cycle Ppt Powerpoint Ideas
This is a business analysis life cycle ppt powerpoint ideas. This is a eight stage process. The stages in this process are bi assessment, design data model, data warehouse, data mining, enterprise reporting, performance management, predict analysis, maintenance and support.
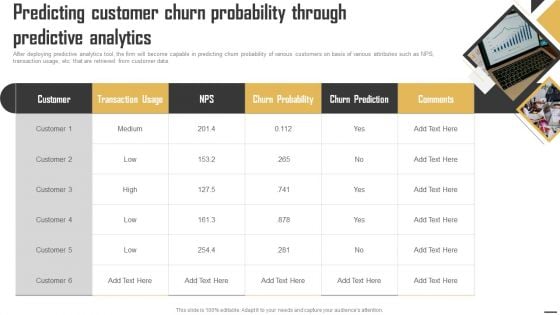
Data Monetization And Management Predicting Customer Churn Probability Through Formats PDF
After deploying predictive analytics tool, the firm will become capable in predicting churn probability of various customers on basis of various attributes such as NPS, transaction usage, etc. that are retrieved from customer data. Are you searching for a Data Monetization And Management Predicting Customer Churn Probability Through Formats PDF that is uncluttered, straightforward, and original Its easy to edit, and you can change the colors to suit your personal or business branding. For a presentation that expresses how much effort youve put in, this template is ideal With all of its features, including tables, diagrams, statistics, and lists, its perfect for a business plan presentation. Make your ideas more appealing with these professional slides. Download Data Monetization And Management Predicting Customer Churn Probability Through Formats PDF from Slidegeeks today.
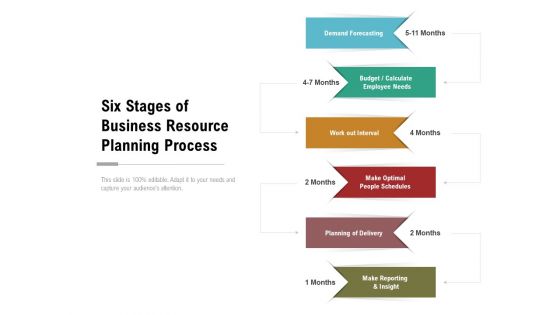
Six Stages Of Business Resource Planning Process Ppt PowerPoint Presentation Pictures Design Inspiration PDF
Presenting six stages of business resource planning process ppt powerpoint presentation pictures design inspiration pdf to dispense important information. This template comprises six stages. It also presents valuable insights into the topics including demand forecasting, budget, calculate, employee needs, work out interval, make optimal, people schedules, planning of delivery, make reporting and insight. This is a completely customizable PowerPoint theme that can be put to use immediately. So, download it and address the topic impactfully.
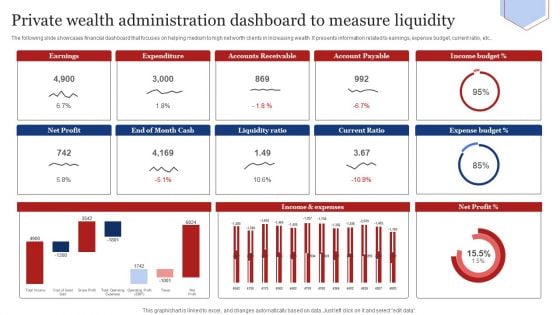
Private Wealth Administration Dashboard To Measure Liquidity Infographics PDF
The following slide showcases financial dashboard that focuses on helping medium to high net worth clients in increasing wealth. It presents information related to earnings, expense budget, current ratio, etc. Showcasing this set of slides titled Private Wealth Administration Dashboard To Measure Liquidity Infographics PDF. The topics addressed in these templates are Liquidity Ratio, Current Ratio, Expense Budget. All the content presented in this PPT design is completely editable. Download it and make adjustments in color, background, font etc. as per your unique business setting.
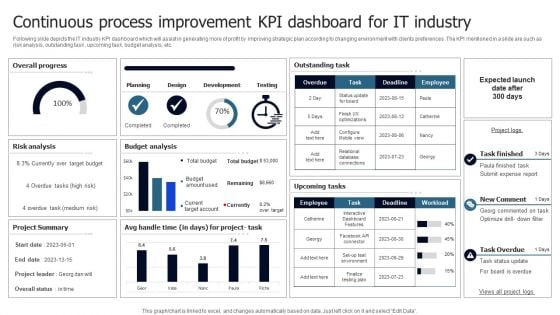
Continuous Process Improvement KPI Dashboard For IT Industry Clipart PDF
Following slide depicts the IT industry KPI dashboard which will assist in generating more of profit by improving strategic plan according to changing environment with clients preferences .The KPI mentioned in a slide are such as risk analysis, outstanding task , upcoming task, budget analysis, etc. Pitch your topic with ease and precision using this Continuous Process Improvement KPI Dashboard For IT Industry Clipart PDF. This layout presents information on Overall Progress, Risk Analysis, Budget Analysis. It is also available for immediate download and adjustment. So, changes can be made in the color, design, graphics or any other component to create a unique layout.
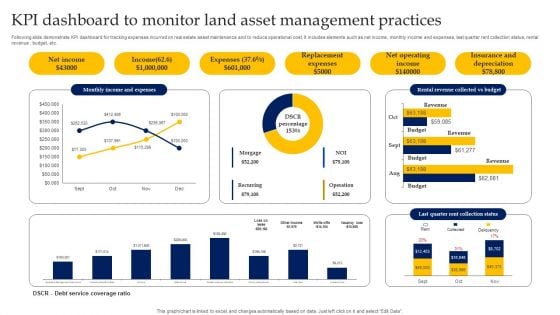
KPI Dashboard To Monitor Land Asset Management Practices Clipart PDF
Following slide demonstrate KPI dashboard for tracking expenses incurred on real estate asset maintenance and to reduce operational cost. It includes elements such as net income, monthly income and expenses, last quarter rent collection status, rental revenue , budget, etc. Pitch your topic with ease and precision using this KPI Dashboard To Monitor Land Asset Management Practices Clipart PDF. This layout presents information on Revenue, Budget, Income. It is also available for immediate download and adjustment. So, changes can be made in the color, design, graphics or any other component to create a unique layout.
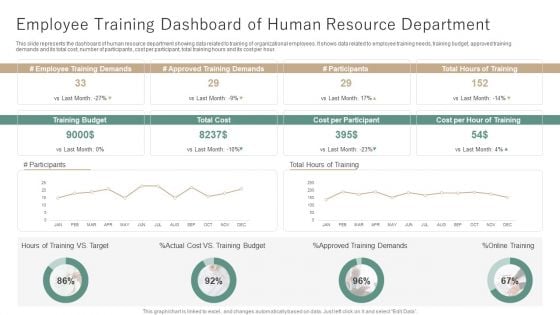
Employee Training Dashboard Of Human Resource Department Ppt Outline Themes PDF
This slide represents the dashboard of human resource department showing data related to training of organizational employees. It shows data related to employee training needs, training budget, approved training demands and its total cost, number of participants, cost per participant, total training hours and its cost per hour. Showcasing this set of slides titled Employee Training Dashboard Of Human Resource Department Ppt Outline Themes PDF. The topics addressed in these templates are Employee Training Demands, Approved Training Demands, Cost per Participant. All the content presented in this PPT design is completely editable. Download it and make adjustments in color, background, font etc. as per your unique business setting.
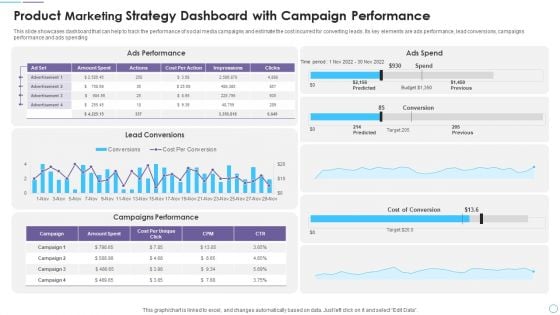
Product Marketing Strategy Dashboard With Campaign Performance Inspiration PDF
This slide showcases dashboard that can help to track the performance of social media campaigns and estimate the cost incurred for converting leads. Its key elements are ads performance, lead conversions, campaigns performance and ads spending. Showcasing this set of slides titled Product Marketing Strategy Dashboard With Campaign Performance Inspiration PDF. The topics addressed in these templates are Ads Performance, Ads Spend, Lead Conversions, Campaigns Performance. All the content presented in this PPT design is completely editable. Download it and make adjustments in color, background, font etc. as per your unique business setting.
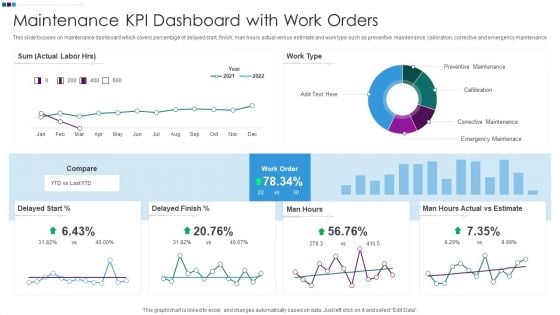
Maintenance KPI Dashboard With Work Orders Ppt Gallery Model PDF
This slide focuses on maintenance dashboard which covers percentage of delayed start, finish, man hours actual versus estimate and work type such as preventive maintenance, calibration, corrective and emergency maintenance. Showcasing this set of slides titled Maintenance KPI Dashboard With Work Orders Ppt Gallery Model PDF. The topics addressed in these templates are Preventive Maintenance Callibration, Man Hours Actual, Delayed Finish Percent. All the content presented in this PPT design is completely editable. Download it and make adjustments in color, background, font etc. as per your unique business setting.
Property Flipping Expenses And Profit Tracking Dashboard Ppt Good PDF
This slide covers dashboard to estimate multiple expenses incurred and profits earned by property flipping. It includes elements such repair costs, after repair value, rehab profits, purchase price, total amount of investment Made, etc. Showcasing this set of slides titled Property Flipping Expenses And Profit Tracking Dashboard Ppt Good PDF. The topics addressed in these templates are Repair Costs, Loan Amount, Down Payment. All the content presented in this PPT design is completely editable. Download it and make adjustments in color, background, font etc. as per your unique business setting.

Global Internet Of Things In Manufacturing Iot Manufacturing Ai Big Data And Predictive Guidelines PDF
This slide highlights the IoT components of manufacturing which includes artificial intelligence AI, big data and predictive analysis with the importance to businesses. This modern and well-arranged Global Internet Of Things In Manufacturing Iot Manufacturing Ai Big Data And Predictive Guidelines PDF provides lots of creative possibilities. It is very simple to customize and edit with the Powerpoint Software. Just drag and drop your pictures into the shapes. All facets of this template can be edited with Powerpoint, no extra software is necessary. Add your own material, put your images in the places assigned for them, adjust the colors, and then you can show your slides to the world, with an animated slide included.
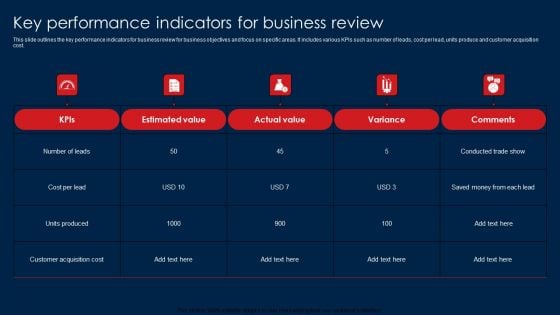
Key Performance Indicators For Business Review Mockup PDF
This slide outlines the key performance indicators for business review for business objectives and focus on specific areas. It includes various KPIs such as number of leads, cost per lead, units produce and customer acquisition cost. Showcasing this set of slides titled Key Performance Indicators For Business Review Mockup PDF. The topics addressed in these templates are Estimated Value, Actual Value, Variance. All the content presented in this PPT design is completely editable. Download it and make adjustments in color, background, font etc. as per your unique business setting.
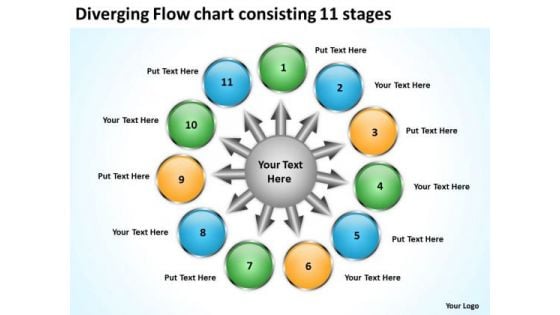
Flow Chart Consisting 11 Stages Ppt Relative Circular Arrow Diagram PowerPoint Templates
We present our flow chart consisting 11 stages ppt Relative Circular Arrow Diagram PowerPoint templates.Present our Circle Charts PowerPoint Templates because you can Help your viewers automatically emphathise with your thoughts. Present our Arrows PowerPoint Templates because that was the well known Musketeers call. Use our Business PowerPoint Templates because the great Bald headed Eagle embodies your personality. the eagle eye to seize upon the smallest of opportunities. Download our Shapes PowerPoint Templates because you know your business and have a vision for it. Use our Flow Charts PowerPoint Templates because using this Ideas will roll along in your mind like billiard balls.Use these PowerPoint slides for presentations relating to action, around, arrow, business, button, cartoon, catalyzing, center, chart, circle, circuits, clipart, comic, commerce, concept, conceptual, continue, corporate, cycle, diagram, guide, guidelines, illustration, line, manage, management, map, marketing, mentoring, messenger, mind, mind mapping, mindmap, organization, performance, plans, procedure, process, project, public, repeat, representation, sketch, steps, topic, vector, web, weblogs, website. The prominent colors used in the PowerPoint template are Green, Blue, Yellow. Customers tell us our flow chart consisting 11 stages ppt Relative Circular Arrow Diagram PowerPoint templates are Attractive. PowerPoint presentation experts tell us our button PowerPoint templates and PPT Slides will save the presenter time. People tell us our flow chart consisting 11 stages ppt Relative Circular Arrow Diagram PowerPoint templates are Multicolored. People tell us our button PowerPoint templates and PPT Slides are Striking. Customers tell us our flow chart consisting 11 stages ppt Relative Circular Arrow Diagram PowerPoint templates are Pretty. People tell us our button PowerPoint templates and PPT Slides will generate and maintain the level of interest you desire. They will create the impression you want to imprint on your audience. Our Flow Chart Consisting 11 Stages Ppt Relative Circular Arrow Diagram PowerPoint Templates are ever evolving. They absorb new concepts with complete ease.
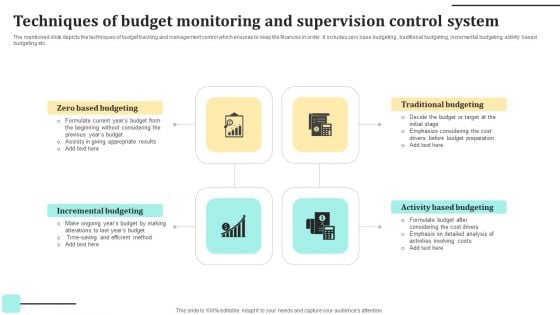
Techniques Of Budget Monitoring And Supervision Control System Slides PDF
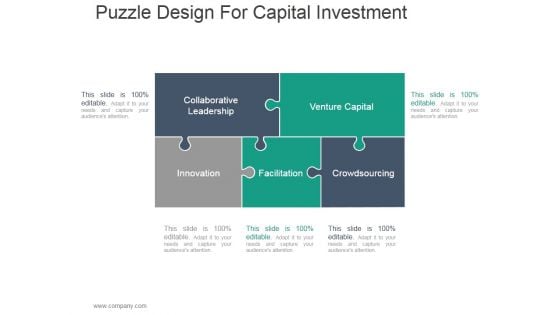
Puzzle Design For Capital Investment Ppt PowerPoint Presentation Picture
This is a puzzle design for capital investment ppt powerpoint presentation picture. This is a five stage process. The stages in this process are collaborative leadership, venture capital, innovation, facilitation, crowdsourcing.
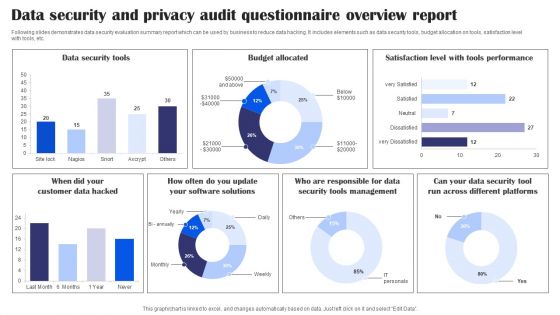
Data Security And Privacy Audit Questionnaire Overview Report Survey SS
Following slides demonstrates data security evaluation summary report which can be used by business to reduce data hacking. It includes elements such as data security tools, budget allocation on tools, satisfaction level with tools, etc. Pitch your topic with ease and precision using this Data Security And Privacy Audit Questionnaire Overview Report Survey SS. This layout presents information on Data Security Tools, Budget Allocated, Tools Performance, Data Security Tools Management. It is also available for immediate download and adjustment. So, changes can be made in the color, design, graphics or any other component to create a unique layout.
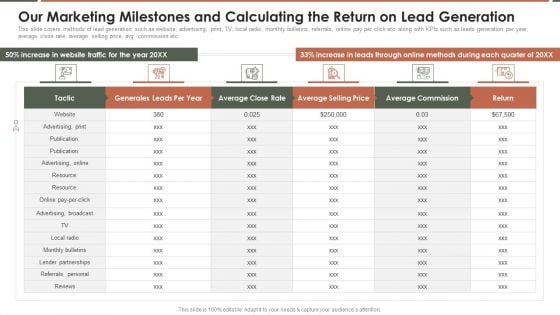
Talent Acquisition Marketing Our Marketing Milestones And Calculating The Return On Lead Generation Inspiration PDF
This slide covers methods of lead generation such as website, advertising, print, TV, local radio, monthly bulletins, referrals, online pay per click etc. along with KPIs such as leads generation per year, average close rate, average selling price, avg. commission etc.Deliver an awe inspiring pitch with this creative Talent Acquisition Marketing Our Marketing Milestones And Calculating The Return On Lead Generation Inspiration PDF bundle. Topics like Advertising Broadcast, Lender Partnerships, Referrals Personal can be discussed with this completely editable template. It is available for immediate download depending on the needs and requirements of the user.
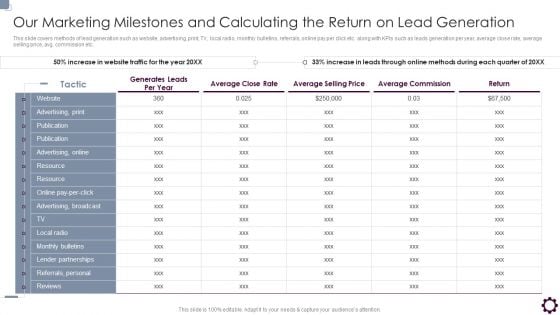
Our Marketing Milestones And Calculating The Return On Lead Generation Brochure PDF
This slide covers methods of lead generation such as website, advertising, print, TV, local radio, monthly bulletins, referrals, online pay per click etc. along with KPIs such as leads generation per year, average close rate, average selling price, avg. commission etc.Deliver an awe inspiring pitch with this creative Our Marketing Milestones And Calculating The Return On Lead Generation Brochure PDF bundle. Topics like Average Commission, Average Close, Average Selling can be discussed with this completely editable template. It is available for immediate download depending on the needs and requirements of the user.
Inbound Recruiting Methodology Our Marketing Milestones And Calculating The Return On Lead Generation Icons PDF
This slide covers methods of lead generation such as website, advertising, print, TV, local radio, monthly bulletins, referrals, online pay per click etc. along with KPIs such as leads generation per year, average close rate, average selling price, avg. commission etc. Deliver and pitch your topic in the best possible manner with this Inbound Recruiting Methodology Our Marketing Milestones And Calculating The Return On Lead Generation Icons PDF. Use them to share invaluable insights on Average Commission, Advertising, Resource and impress your audience. This template can be altered and modified as per your expectations. So, grab it now.
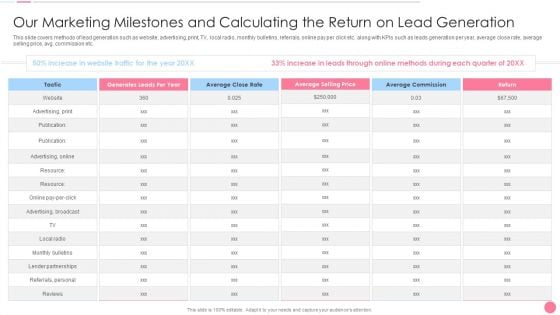
Our Marketing Milestones And Calculating The Return On Lead Generation Microsoft PDF
This slide covers methods of lead generation such as website, advertising, print, TV, local radio, monthly bulletins, referrals, online pay per click etc. along with KPIs such as leads generation per year, average close rate, average selling price, avg. commission etc.Deliver and pitch your topic in the best possible manner with this Our Marketing Milestones And Calculating The Return On Lead Generation Microsoft PDF. Use them to share invaluable insights on Generates Leads, Average Close, Average Selling and impress your audience. This template can be altered and modified as per your expectations. So, grab it now.

Benefits Of Implementing Artificial Intelligence In Analytics Data Analytics SS V
This slide outlines key advantages of leveraging artificial intelligence in analytics aimed at helping businesses objectively predict results of the actions before implementation in real world . It covers the benefits such as enhanced speed, better predictive capabilities, improved customer experience and reduced costs.Make sure to capture your audiences attention in your business displays with our gratis customizable Benefits Of Implementing Artificial Intelligence In Analytics Data Analytics SS V. These are great for business strategies, office conferences, capital raising or task suggestions. If you desire to acquire more customers for your tech business and ensure they stay satisfied, create your own sales presentation with these plain slides. This slide outlines key advantages of leveraging artificial intelligence in analytics aimed at helping businesses objectively predict results of the actions before implementation in real world . It covers the benefits such as enhanced speed, better predictive capabilities, improved customer experience and reduced costs.
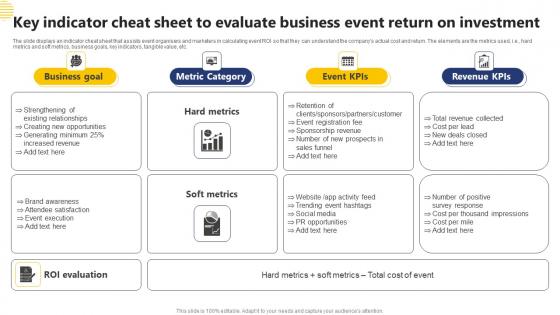
Key Indicator Cheat Sheet To Evaluate Business Event Return On Investment Template Pdf
The slide displays an indicator cheat sheet that assists event organisers and marketers in calculating event ROI so that they can understand the companys actual cost and return. The elements are the metrics used, i.e., hard metrics and soft metrics, business goals, key indicators, tangible value, etc. Showcasing this set of slides titled Key Indicator Cheat Sheet To Evaluate Business Event Return On Investment Template Pdf The topics addressed in these templates are Business Goal, Metric Category, Revenue KPIS All the content presented in this PPT design is completely editable. Download it and make adjustments in color, background, font etc. as per your unique business setting. The slide displays an indicator cheat sheet that assists event organisers and marketers in calculating event ROI so that they can understand the companys actual cost and return. The elements are the metrics used, i.e., hard metrics and soft metrics, business goals, key indicators, tangible value, etc.
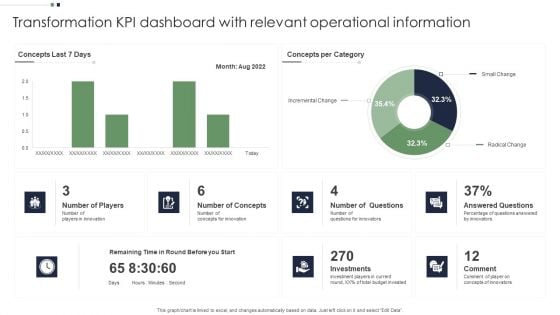
Transformation KPI Dashboard With Relevant Operational Information Portrait PDF
Showcasing this set of slides titled Transformation KPI Dashboard With Relevant Operational Information Portrait PDF. The topics addressed in these templates are Investment, Budget, Innovators. All the content presented in this PPT design is completely editable. Download it and make adjustments in color, background, font etc. as per your unique business setting.
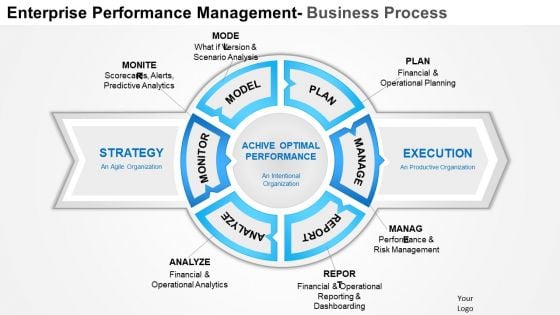
Business Framework Enterprise Performance Management PowerPoint Presentation
This image slide has been designed to depict enterprise performance management diagram. This image slide displays business planning and forecasting. This image slide may be used to exhibit business performance management in your presentations. This image slide will give edge to your presentations.
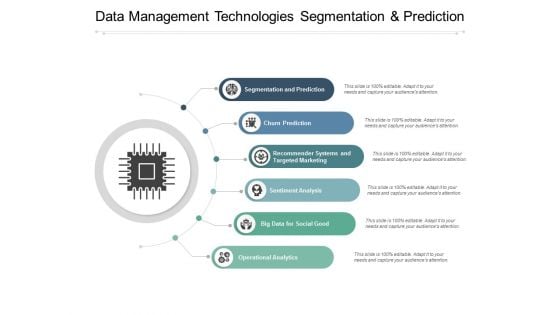
Data Management Technologies Segmentation And Prediction Ppt PowerPoint Presentation Professional Show
Presenting this set of slides with name data management technologies segmentation and prediction ppt powerpoint presentation professional show. This is a six stage process. The stages in this process are big data analysis, data management, technologies segmentation. This is a completely editable PowerPoint presentation and is available for immediate download. Download now and impress your audience.
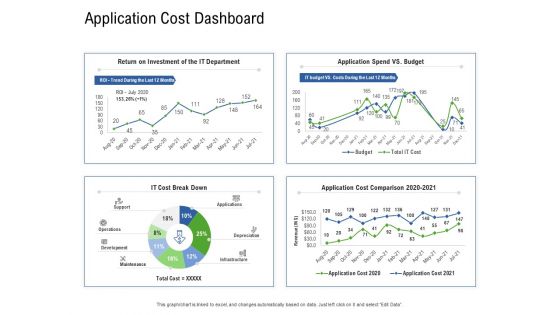
Application Performance Management Application Cost Dashboard Ppt Ideas Inspiration PDF
Deliver an awe inspiring pitch with this creative application performance management application cost dashboard ppt ideas inspiration pdf bundle. Topics like investment, department, budget, cost, comparison can be discussed with this completely editable template. It is available for immediate download depending on the needs and requirements of the user.
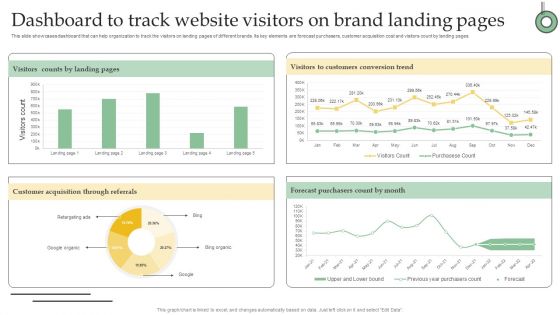
Dashboard To Track Website Visitors On Brand Landing Pages Ppt PowerPoint Presentation File Files PDF
This slide showcases dashboard that can help organization to track the visitors on landing pages of different brands. Its key elements are forecast purchasers, customer acquisition cost and visitors count by landing pages. This modern and well arranged Dashboard To Track Website Visitors On Brand Landing Pages Ppt PowerPoint Presentation File Files PDF provides lots of creative possibilities. It is very simple to customize and edit with the Powerpoint Software. Just drag and drop your pictures into the shapes. All facets of this template can be edited with Powerpoint no extra software is necessary. Add your own material, put your images in the places assigned for them, adjust the colors, and then you can show your slides to the world, with an animated slide included.
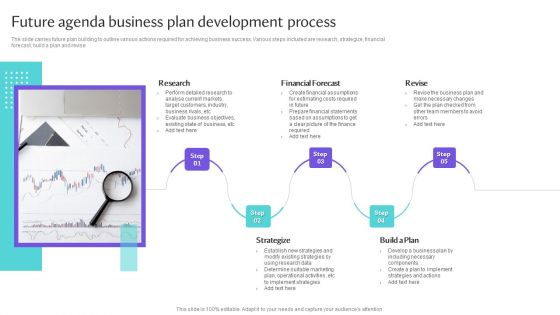
Future Agenda Business Plan Development Process Topics PDF
The slide carries future plan building to outline various actions required for achieving business success. Various steps included are research, strategize, financial forecast, build a plan and revise.Persuade your audience using this Future Agenda Business Plan Development Process Topics PDF. This PPT design covers five stages, thus making it a great tool to use. It also caters to a variety of topics including Financial Forecast, Establish Strategies, Determine Suitable Download this PPT design now to present a convincing pitch that not only emphasizes the topic but also showcases your presentation skills.
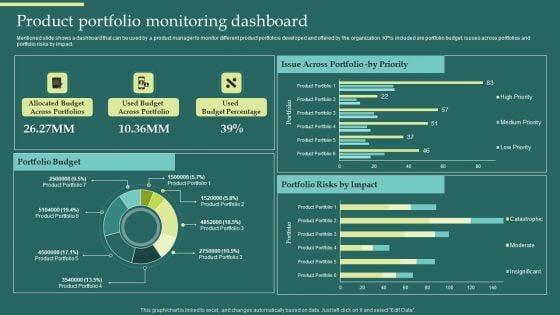
Product Portfolios And Strategic Product Portfolio Monitoring Dashboard Introduction PDF
Mentioned slide shows a dashboard that can be used by a product manager to monitor different product portfolios developed and offered by the organization. KPIs included are portfolio budget, issues across portfolios and portfolio risks by impact. Explore a selection of the finest Product Portfolios And Strategic Product Portfolio Monitoring Dashboard Introduction PDF here. With a plethora of professionally designed and pre-made slide templates, you can quickly and easily find the right one for your upcoming presentation. You can use our Product Portfolios And Strategic Product Portfolio Monitoring Dashboard Introduction PDF to effectively convey your message to a wider audience. Slidegeeks has done a lot of research before preparing these presentation templates. The content can be personalized and the slides are highly editable. Grab templates today from Slidegeeks.
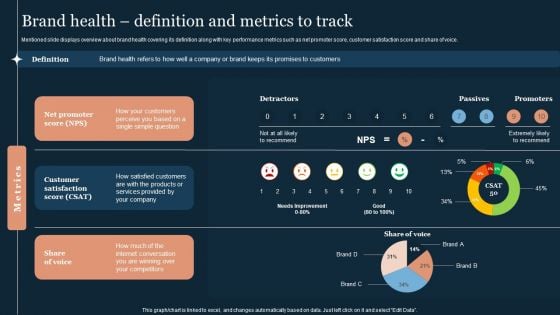
Guide To Develop And Estimate Brand Value Brand Health Definition And Metrics To Track Elements PDF
Mentioned slide displays overview about brand health covering its definition along with key performance metrics such as net promoter score, customer satisfaction score and share of voice.Whether you have daily or monthly meetings, a brilliant presentation is necessary. Guide To Develop And Estimate Brand Value Brand Health Definition And Metrics To Track Elements PDF can be your best option for delivering a presentation. Represent everything in detail using Guide To Develop And Estimate Brand Value Brand Health Definition And Metrics To Track Elements PDF and make yourself stand out in meetings. The template is versatile and follows a structure that will cater to your requirements. All the templates prepared by Slidegeeks are easy to download and edit. Our research experts have taken care of the corporate themes as well. So, give it a try and see the results.

Brand Health Definition And Metrics To Track Brand Value Estimation Guide Mockup PDF
Following slide provides an overview about brand equity by covering its definition and key components such as brand loyalty, awareness, quality, association and experience.Present like a pro with Brand Health Definition And Metrics To Track Brand Value Estimation Guide Mockup PDF Create beautiful presentations together with your team, using our easy-to-use presentation slides. Share your ideas in real-time and make changes on the fly by downloading our templates. So whether you are in the office, on the go, or in a remote location, you can stay in sync with your team and present your ideas with confidence. With Slidegeeks presentation got a whole lot easier. Grab these presentations today.
Stock Photo Business Growth Strategy Coins Concept Of Money Pictures Images
Control The Fall Of The Dice With Our stock photo business growth strategy coins concept of money pictures images. Your Forecasts Will Come Out Correct. Our marketing Can Control Fate. The Dice Will Fall As Per Your Call.
Stock Photo Business Planning Strategy Construction With Scale And Pencil Pictures Images
Disregard Any Foreboding With Our stock photo business planning strategy construction with scale and pencil pictures images. They Ensure A Bright Forecast. Our Education Can Be Very Arousing. Develop On The Drive In Them To Excel.


 Continue with Email

 Home
Home


